Analysis Summary
Notes:
- 1) No attempt has been made to eliminate the non-significant decimal places.
- 2) This batgrbproduct analysis is done using the HEASARC data.
- 3) This batgrbproduct analysis is using the flight position for the mask-weighting calculation.
======================================================================
                  BAT GRB EVENT DATA PROCESSING REPORT
    Process Script Ver: batgrbproduct v2.46
    Process Start Time: Sun Jan 19 22:50:56 EST 2014
             Host Name: batevent1
   Current Working Dir: /local/data/batevent/batevent_reproc/trigger324561
======================================================================

  Trigger: 00324561      Segment: 000

  BAT Trigger Time: 242981217.216   [s; MET]
      Trigger Stop: 242981218.24   [s; MET]
               UTC: 2008-09-13T06:46:54.122140    [includes UTCF correction]
       Where From?: TDRSS position message

  BAT
    RA: 65.7245690715967   Dec: -25.1102227127259  [deg; J2000]

     Catalogged Source?: NO
     Point Source?:      YES
     GRB Indicated?:     YES    [ by BAT flight software ]
     Image S/N Ratio:    9.39
     Image Trigger?:     NO
     Rate S/N Ratio:     13.9283882771841  [ if not an image trigger ]
     Image S/N Ratio:    9.39

  Analysis Position:   [ source = BAT ]
    RA: 65.7245690715967   Dec: -25.1102227127259  [deg; J2000]

  Refined Position:   [ source = BAT pre-slew burst ]
    RA: 65.7457402403733   Dec: -25.1296750070989  [deg; J2000]
        { 04h 22m 59.0s , -25d 07' 46.8" }
         +/- 1.47128223274255 [arcmin] (estimated 90% radius based on SNR)
         +/- 0.580199084280103 [arcmin] (formal 1-sigma fit error)
    SNR: 17.5207494569967

  Angular difference between the analysis and refined position is 1.638599 arcmin

  Partial Coding Fraction: 0.390625    [ including projection effects ]

  Duration
     T90: 7.45600003004074 +/- 0.756676955920547
        Measured from: -3.28000000119209
                   to: 4.17600002884865     [s; relative to TRIGTIME]
     T50: 3.67200002074242 +/- 1.15100130250627
        Measured from: -1.82400000095367
                   to: 1.84800001978874     [s; relative to TRIGTIME]


  Fluence
     Peak Flux  (peak 1 second)
        Measured from: 0.128000020980835
                   to: 1.12800002098083     [s; relative to TRIGTIME]
     Total Fluence
        Measured from: -3.77199998497963
                   to: 4.55600002408028     [s; relative to TRIGTIME]

             Band 1     Band 2     Band 3     Band 4
              15-25      25-50     50-100    100-350     keV
 Total     0.131878   0.281280   0.272643   0.079838
           0.023777   0.025821   0.023959   0.020109 [error]
 Peak      0.025380   0.065550   0.049943   0.015482
           0.008512   0.009293   0.008936   0.007171 [error]

     [ fluence units of on-axis counts / fully illuminated detector ]

======================================================================


====== Table of the duration information =============================

        Value   tstart    tstop
T100    8.328   -3.772    4.556
T90     7.456   -3.280    4.176
T50     3.672   -1.824    1.848
Peak    1.000    0.128    1.128


====== Spectral Analysis Summary =====================================

Model      : spectral model: simple power-law (PL) and cutoff power-law (CPL)
Ph_index   : photon index: E^{Ph_index}
Ph_90err   : 90% error of the photon index
Epeak      : Epeak in keV
Epeak_90err: 90% error of Epeak
Norm       : normalization at 50 keV in both the PL model and CPL model
Nomr_90err : 90% error of the normalization
chi2       : Chi-Squared
dof        : degree of freedo

=== Time-averaged spectral analysis ===
(Best model with acceptable fit: PL)

Model Ph_index Ph_90err_low Ph_90err_hi  Epeak  Epeak_90err_low  Epeak_90err_hi  Norm       Nomr_90err_low    Norm_90err_hi    chi2    dof
PL      -1.200    -0.155      0.158       -           -               -         6.77e-03     -6.49e-04          6.48e-04      44.420   57
CPL     -0.389    -0.646      0.761      111.497     -29.930       192.974      1.59e-02     -7.69e-03          1.83e-02      39.660   56


=== 1-s peak spectral analysis ===
(Best model with acceptable fit: PL)

Model Ph_index Ph_90err_low Ph_90err_hi  Epeak  Epeak_90err_low  Epeak_90err_hi  Norm       Nomr_90err_low    Norm_90err_hi    chi2    dof
PL      -1.375     -0.270     0.271       -           -               -         1.13e-02     -1.94e-03          1.94e-03      65.120   57
CPL     -0.123     -1.157     1.607       76.919     -21.306       233.867      4.70e-02     -4.70e-02          2.41e-01      61.640   56


=== Fluence/Peak Flux Summary ===

              Model    Band1     Band2     Band3     Band4     Band5     Total
                       15-25     25-50    50-100    100-350    15-150    15-350    keV
Fluence         PL   5.43e-08  1.20e-07  2.09e-07  8.47e-07  5.72e-07  1.23e-06   erg/cm2
      90%_error_low -9.75e-09 -1.37e-08 -2.21e-08 -1.80e-07 -5.69e-08 -1.95e-07   erg/cm2
      90%_error_hi   1.03e-08  1.36e-08  2.19e-08  2.10e-07  5.71e-08  2.19e-07   erg/cm2
Peak flux       PL   4.12e-01  4.47e-01  3.45e-01  4.35e-01  1.37e+00  1.64e+00   ph/cm2/s
      90%_error_low -1.17e-01 -8.58e-02 -6.90e-02 -1.51e-01 -2.42e-01 -2.84e-01   ph/cm2/s
      90%_error_hi   1.27e-01  8.47e-02  6.82e-02  1.91e-01  2.43e-01  2.86e-01   ph/cm2/s

Fluence        CPL   4.51e-08  1.28e-07  2.28e-07  3.41e-07  5.54e-07  7.41e-07   erg/cm2
      90%_error_low -1.16e-08 -1.58e-08 -2.68e-08 -1.61e-07 -6.04e-08 -1.68e-07   erg/cm2
      90%_error_hi   1.23e-08  1.61e-08  2.75e-08  3.49e-07  5.99e-08  3.42e-07   erg/cm2
Peak flux      CPL   3.25e-01  4.99e-01  3.86e-01  1.48e-01  1.32e+00  1.36e+00   ph/cm2/s
      90%_error_low -1.34e-01 -1.03e-01 -8.40e-02 -1.02e-01 -2.46e-01 -2.71e-01   ph/cm2/s
      90%_error_hi   1.48e-01  1.09e-01  8.67e-02  2.57e-01  2.47e-01  3.20e-01   ph/cm2/s

======================================================================
Image
Pre-slew 15.0-350.0 keV image (Event data)
#   RAcent    DECcent   POSerr    Theta     Phi              Peak Cts       SNR   Name
   65.7457   -25.1297   0.0109    46.3273  -168.2143         0.8454300     17.521 TRIG_00324561

Foreground time interval of the image:
 -3.772   4.556 (delta_t =   8.328 [sec])
Background time interval of the image:
-565.115 -462.112 (delta_t = 103.004 [sec])
-239.216  -3.772 (delta_t = 235.444 [sec])
Light Curves
Note: The mask-weighted lightcurves have units of either count/det or counts/sec/det, where a det is 0.4 x 0.4 = 0.16 sq cm.
Full-time range; 1 s binning
Other quick-look light curves:
- 64 ms binning (zoomed)
- 16 ms binning (zoomed)
- 8 ms binning (zoomed)
- 2 ms binning (zoomed)
- SN=5 or 10 s binning (full-time range)
- Raw light curve
Spectra
- 64 ms binning (zoomed)
- 16 ms binning (zoomed)
- 8 ms binning (zoomed)
- 2 ms binning (zoomed)
- SN=5 or 10 s binning (full-time range)
- Raw light curve
Spectra
Notes:
- 1) The fitting includes the systematic errors.
- 2) When the burst includes telescope slew time periods, the fitting uses an average response file made from multiple 5-s response files through out the slew time plus single time preiod for the non-slew times, and weighted by the total counts in the corresponding time period using addrmf. An average response file is needed becuase a spectral fit using the pre-slew DRM will introduce some errors in both a spectral shape and a normalization if the PHA file contains a lot of the slew/post-slew time interval.
- 3) For fits to more complicated models (e.g. a power-law over a cutoff power-law), the BAT team has decided to require a chi-square improvement of more than 6 for each extra dof.
Time averaged spectrum fit using the average DRM
Power-law model
Time interval is from   -3.772 sec. to    4.556 sec.

Spectral model in power-law:
------------------------------------------------------------
Parameters  : value       lower 90%   higher 90%
Photon index: -1.19984     ( -0.154994   0.158489 )
Norm@50keV  : 6.76545E-03    ( -0.000649458   0.00064835 )
------------------------------------------------------------
#Fit statistic : Chi-Squared =          44.42 using 59 PHA bins.
# Reduced chi-squared =         0.7792 for     57 degrees of freedom
# Null hypothesis probability =   8.877936e-01

Photon flux (15-150 keV)    in 8.328 sec: 0.794115 ( -0.080307  0.08064 ) ph/cm2/s
Energy fluence (15-150 keV)             : 5.71703e-07 ( -5.69241e-08  5.70799e-08 ) ergs/cm2
Cutoff power-law model
Time interval is from   -3.772 sec. to    4.556 sec.
Spectral model in the cutoff power-law:
------------------------------------------------------------
Parameters  : value       lower 90%   higher 90%
Photon index: -0.389322     ( -0.646022   0.761369 )
Epeak [keV] : 111.497      ( -29.9306 192.974 )
Norm@50keV  : 1.58721E-02    ( -0.00769144   0.018291 )
------------------------------------------------------------
#Fit statistic : Chi-Squared =          39.66 using 59 PHA bins.
# Reduced chi-squared =         0.7083 for     56 degrees of freedom
# Null hypothesis probability =   9.516805e-01

Photon flux (15-150 keV)    in 8.328 sec: 0.770971 ( -0.082194  0.082585 ) ph/cm2/s
Energy fluence (15-150 keV)             : 5.5358e-07 ( -6.03945e-08  5.99282e-08 ) ergs/cm2
1-s peak spectrum fit
Power-law model
Time interval is from    0.128 sec. to    1.128 sec.

Spectral model in power-law:
------------------------------------------------------------
Parameters  : value       lower 90%   higher 90%
Photon index: -1.37457     ( -0.270019   0.270598 )
Norm@50keV  : 1.12900E-02    ( -0.00194072   0.00193918 )
------------------------------------------------------------
#Fit statistic : Chi-Squared =          65.12 using 59 PHA bins.
# Reduced chi-squared =          1.142 for     57 degrees of freedom
# Null hypothesis probability =   2.151694e-01

Photon flux (15-150 keV)    in 1 sec: 1.36723 ( -0.24161  0.24254 ) ph/cm2/s
Energy fluence (15-150 keV)             : 1.09686e-07 ( -2.01969e-08  2.03669e-08 ) ergs/cm2
Cutoff power-law model
Time interval is from    0.128 sec. to    1.128 sec.
Spectral model in the cutoff power-law:
------------------------------------------------------------
Parameters  : value       lower 90%   higher 90%
Photon index: -0.12343     ( -1.15727   1.6074 )
Epeak [keV] : 76.9187      ( -21.3064 233.867 )
Norm@50keV  : 4.70389E-02    ( -0.0470388   0.240629 )
------------------------------------------------------------
#Fit statistic : Chi-Squared =          61.64 using 59 PHA bins.
# Reduced chi-squared =          1.101 for     56 degrees of freedom
# Null hypothesis probability =   2.814323e-01

Photon flux (15-150 keV)    in 1 sec: 1.31643 ( -0.24578  0.24708 ) ph/cm2/s
Energy fluence (15-150 keV)             : 1.02648e-07 ( -2.18799e-08  2.1921e-08 ) ergs/cm2
Time-resolved spectra
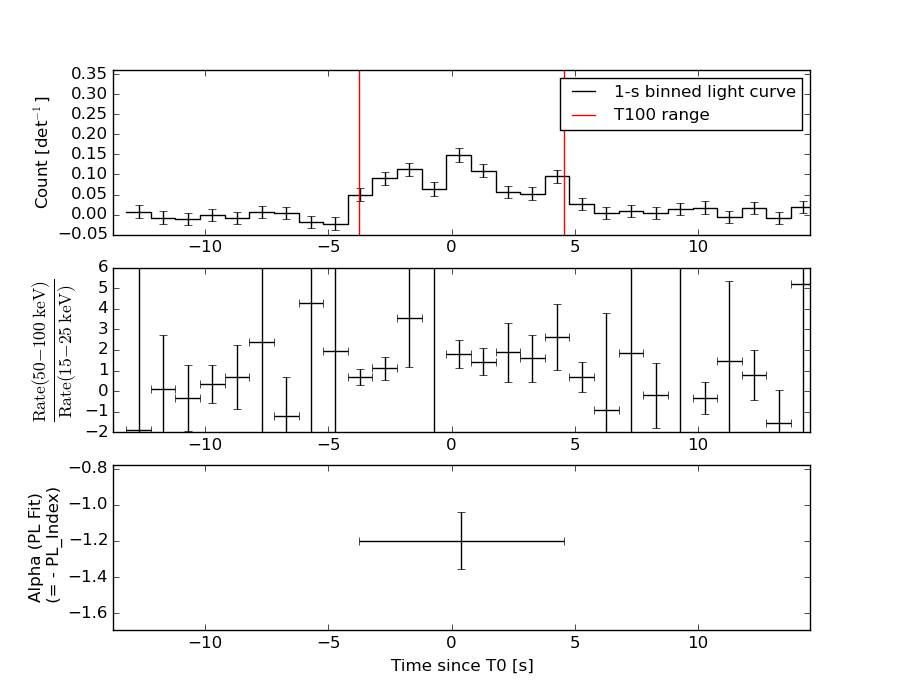
Distribution
T90 vs. Hardness ratio plot
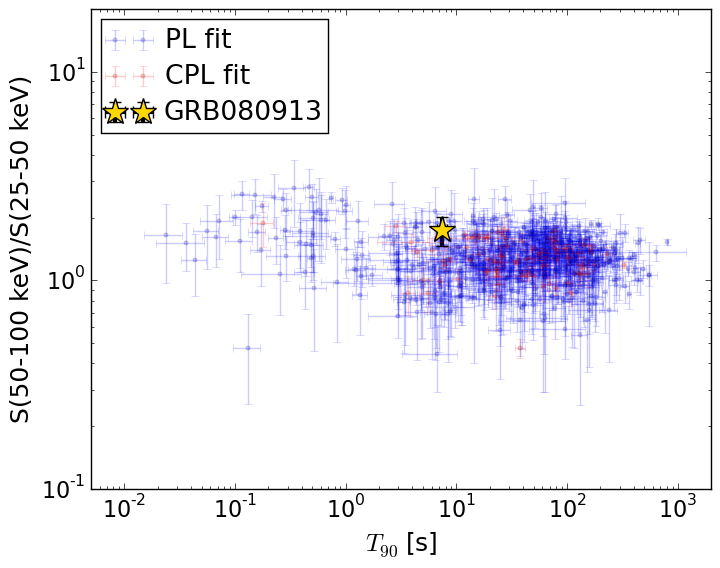
T90                                   = 7.456 sec.
Hardness ratio (energy fluence ratio) = 1.74132685483
S(15-50 keV) vs. S(50-150 keV) plot
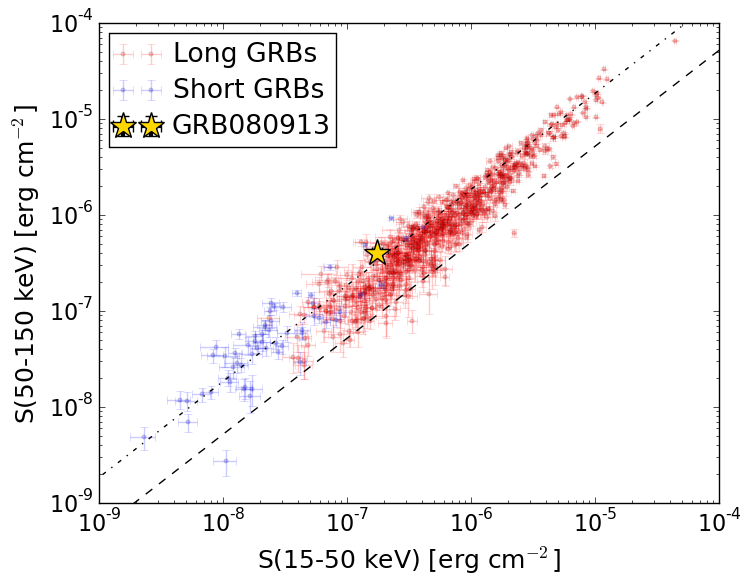
S(15-50 keV)  = 1.7441655e-07
S(50-150 keV) = 3.97297e-07
The dash-dotted line and the dashed line traces the fluences calculated from the Band function with Epeak = 15 and 150 keV, respectively. Both lines assume a canonical values of alpha = -1 and beta = -2.5.
Mask shadow pattern
IMX = -1.025355958080295E+00, IMY = 2.139408541184475E-01
Spacecraft aspect plot
Bright source in the pre-burst/pre-slew/post-slew images
Pre-burst image of 15-350 keV band
Time interval of the image:
-565.115400 -462.111800
-239.216000 -3.772000

# RAcent  DECcent POSerr Theta    Phi  PeakCts   SNR AngSep     Name
#  [deg]    [deg]    ['] [deg]  [deg]                   [']
339.3997 -30.2084    2.3  33.7   51.1   1.6931   5.0 ------	UNKNOWN
 18.5818 -34.4177    2.7  17.0  126.2   0.8709   4.3 ------	UNKNOWN
 31.6072 -48.4785    3.0  11.0 -161.8   0.7469   3.8 ------	UNKNOWN
 35.4039 -58.5806    2.2  13.7 -113.4   1.0127   5.3 ------	UNKNOWN
Pre-slew background subtracted image of 15-350 keV band
Time interval of the image:
-3.772000 4.556000

# RAcent  DECcent POSerr Theta    Phi  PeakCts   SNR AngSep     Name
#  [deg]    [deg]    ['] [deg]  [deg]                   [']
335.9712 -58.6717    1.9  23.3   -7.5   0.1556   5.9 ------	UNKNOWN
 65.7458 -25.1297    0.7  46.3 -168.2   0.8453  17.5 ------	UNKNOWN
Post-slew image of 15-350 keV band
Time interval of the image:
83.284600 962.797600

# RAcent  DECcent POSerr Theta    Phi  PeakCts   SNR AngSep     Name
#  [deg]    [deg]    ['] [deg]  [deg]                   [']
 83.6274  22.0117    0.4  50.2 -161.5  35.8122  31.2    0.4	Crab
 33.7054  -8.0103    3.1  35.0  110.4   3.4076   3.7 ------	UNKNOWN
 49.9799  19.1694    2.6  46.9  156.2   6.0380   4.4 ------	UNKNOWN
 67.3400 -60.2036    3.1  35.1   -4.7   2.2977   3.7 ------	UNKNOWN
 69.6942 -18.9640    2.8   7.2 -151.7   1.6116   4.2 ------	UNKNOWN
104.6001 -65.9932    3.6  47.6  -23.5   2.6985   3.2 ------	UNKNOWN
123.1778 -52.7653    3.3  50.7  -44.5   9.1337   3.5 ------	UNKNOWN