Analysis Summary
Notes:
- 1) No attempt has been made to eliminate the non-significant decimal places.
- 2) This batgrbproduct analysis is done using the HEASARC data.
- 3) This batgrbproduct analysis is using the flight position for the mask-weighting calculation.
======================================================================
                  BAT GRB EVENT DATA PROCESSING REPORT
    Process Script Ver: batgrbproduct v2.46
    Process Start Time: Sun Jan 19 22:45:44 EST 2014
             Host Name: batevent1
   Current Working Dir: /local/data/batevent/batevent_reproc/trigger324744
======================================================================

  Trigger: 00324744      Segment: 000

  BAT Trigger Time: 243129773.056   [s; MET]
      Trigger Stop: 243129777.152   [s; MET]
               UTC: 2008-09-15T00:02:49.957760    [includes UTCF correction]
       Where From?: TDRSS position message

  BAT
    RA: 18.0040672407145   Dec: -76.0144041971717  [deg; J2000]

     Catalogged Source?: NO
     Point Source?:      YES
     GRB Indicated?:     YES    [ by BAT flight software ]
     Image S/N Ratio:    7.13
     Image Trigger?:     NO
     Rate S/N Ratio:     8.18535277187245  [ if not an image trigger ]
     Image S/N Ratio:    7.13

  Analysis Position:   [ source = BAT ]
    RA: 18.0040672407145   Dec: -76.0144041971717  [deg; J2000]

  Refined Position:   [ source = BAT pre-slew burst ]
    RA: 17.8853408690745   Dec: -76.0443829252976  [deg; J2000]
        { 01h 11m 32.5s , -76d 02' 39.8" }
         +/- 2.43155402306048 [arcmin] (estimated 90% radius based on SNR)
         +/- 1.52620369750692 [arcmin] (formal 1-sigma fit error)
    SNR: 8.54782520983947

  Angular difference between the analysis and refined position is 2.488600 arcmin

  Partial Coding Fraction: 0.890625    [ including projection effects ]

  Duration
     T90: 26.2879999577999 +/- 3.89810207565097
        Measured from: -0.815999984741211
                   to: 25.4719999730587     [s; relative to TRIGTIME]
     T50: 10.6079999804497 +/- 9.8563247074382
        Measured from: 3.12000000476837
                   to: 13.727999985218     [s; relative to TRIGTIME]


  Fluence
     Peak Flux  (peak 1 second)
        Measured from: 3.04399999976158
                   to: 4.04399999976158     [s; relative to TRIGTIME]
     Total Fluence
        Measured from: -2.67199999094009
                   to: 26.7199999988079     [s; relative to TRIGTIME]

             Band 1     Band 2     Band 3     Band 4
              15-25      25-50     50-100    100-350     keV
 Total     0.146887   0.201004   0.097420   0.021154
           0.028435   0.029328   0.026237   0.024173 [error]
 Peak      0.019211   0.015941   0.016887  -0.000338
           0.005280   0.005457   0.004887   0.004639 [error]

     [ fluence units of on-axis counts / fully illuminated detector ]

======================================================================


====== Table of the duration information =============================

        Value   tstart    tstop
T100   29.392   -2.672   26.720
T90    26.288   -0.816   25.472
T50    10.608    3.120   13.728
Peak    1.000    3.044    4.044


====== Spectral Analysis Summary =====================================

Model      : spectral model: simple power-law (PL) and cutoff power-law (CPL)
Ph_index   : photon index: E^{Ph_index}
Ph_90err   : 90% error of the photon index
Epeak      : Epeak in keV
Epeak_90err: 90% error of Epeak
Norm       : normalization at 50 keV in both the PL model and CPL model
Nomr_90err : 90% error of the normalization
chi2       : Chi-Squared
dof        : degree of freedo

=== Time-averaged spectral analysis ===
(Best model with acceptable fit: PL)

Model Ph_index Ph_90err_low Ph_90err_hi  Epeak  Epeak_90err_low  Epeak_90err_hi  Norm       Nomr_90err_low    Norm_90err_hi    chi2    dof
PL      -1.582    -0.312      0.306       -           -               -         1.06e-03     -2.02e-04          1.98e-04      52.620   57
CPL     -1.288    -0.596      2.408      103.087    -103.087      -103.087      1.56e-03     -9.97e-04          4.36e-02      52.500   56


=== 1-s peak spectral analysis ===
(Best model with acceptable fit: PL)

Model Ph_index Ph_90err_low Ph_90err_hi  Epeak  Epeak_90err_low  Epeak_90err_hi  Norm       Nomr_90err_low    Norm_90err_hi    chi2    dof
PL      -1.488     -0.567     0.540       -           -               -         3.72e-03     -1.12e-03          1.07e-03      55.670   57
CPL     -1.488     -2.094     1.270     9999.340      N/A           N/A         3.72e-03        N/A               N/A         55.670   56


=== Fluence/Peak Flux Summary ===

              Model    Band1     Band2     Band3     Band4     Band5     Total
                       15-25     25-50    50-100    100-350    15-150    15-350    keV
Fluence         PL   4.28e-08  7.49e-08  1.00e-07  2.74e-07  2.91e-07  4.91e-07   erg/cm2
      90%_error_low -1.15e-08 -1.33e-08 -2.51e-08 -1.19e-07 -5.94e-08 -1.46e-07   erg/cm2
      90%_error_hi   1.20e-08  1.32e-08  2.53e-08  1.71e-07  6.10e-08  1.89e-07   erg/cm2
Peak flux       PL   1.51e-01  1.53e-01  1.09e-01  1.24e-01  4.62e-01  5.38e-01   ph/cm2/s
      90%_error_low -6.94e-02 -4.61e-02 -4.26e-02 -7.70e-02 -1.29e-01 -1.53e-01   ph/cm2/s
      90%_error_hi   7.89e-02  4.44e-02  4.10e-02  1.30e-01  1.29e-01  1.58e-01   ph/cm2/s

Fluence        CPL   4.19e-08  7.79e-08  9.93e-08  1.57e-07  2.80e-07  3.72e-07   erg/cm2
      90%_error_low -1.26e-08 -1.60e-08    N/A       N/A    -8.73e-08 -1.78e-07   erg/cm2
      90%_error_hi   1.27e-08  2.32e-08    N/A       N/A     7.04e-08  1.73e-07   erg/cm2
Peak flux      CPL   1.54e-01  1.53e-01  1.08e-01  1.38e-01  4.63e-01  5.41e-01   ph/cm2/s
      90%_error_low     N/A   -4.59e-02     N/A       N/A       N/A   -1.83e-01   ph/cm2/s
      90%_error_hi      N/A    4.79e-02     N/A       N/A       N/A    1.41e-01   ph/cm2/s

======================================================================
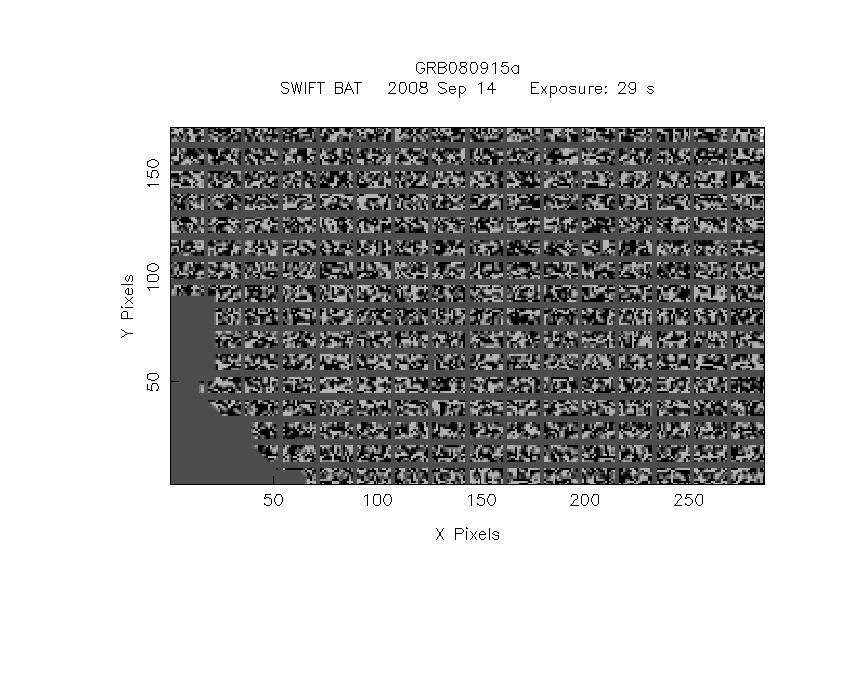
Image
Pre-slew 15.0-350.0 keV image (Event data)
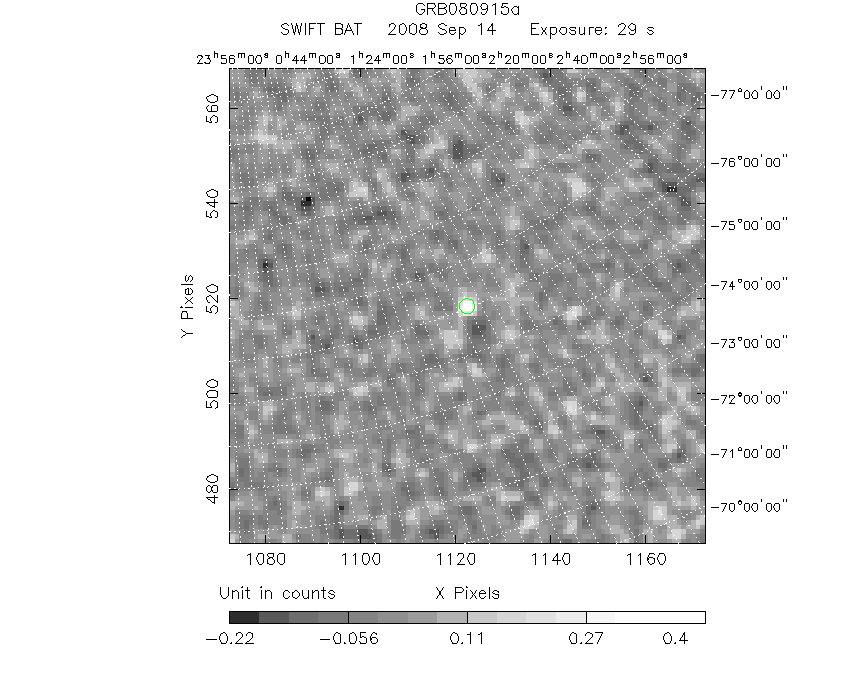
#   RAcent    DECcent   POSerr    Theta     Phi              Peak Cts       SNR   Name
   17.8853   -76.0444   0.0224    27.3669  -170.2244         0.4767006      8.548 TRIG_00324744

Foreground time interval of the image:
 -2.672  26.720 (delta_t =  29.392 [sec])
Background time interval of the image:
-239.056  -2.672 (delta_t = 236.384 [sec])
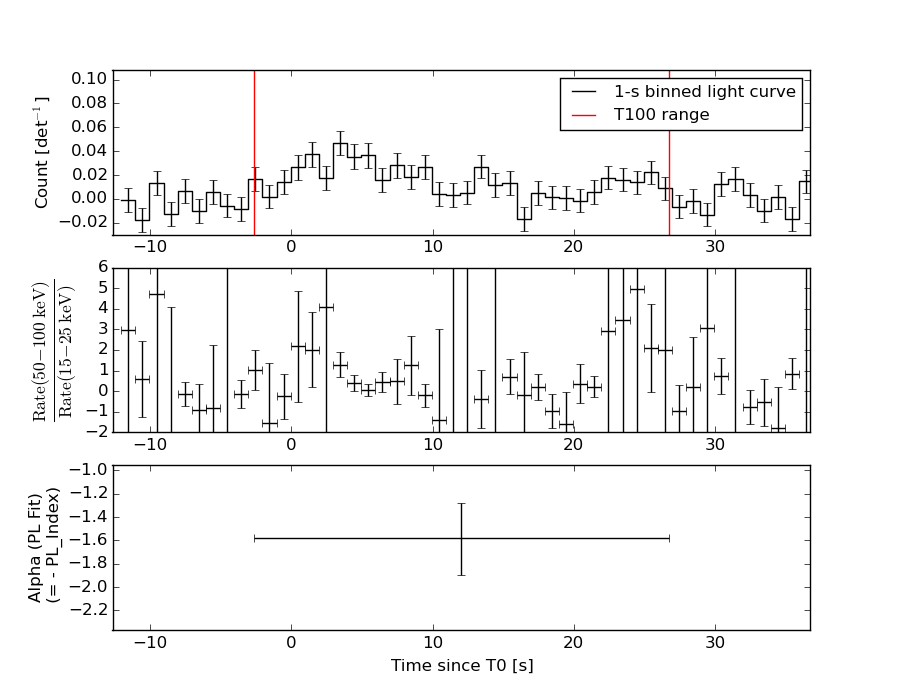
Light Curves
Note: The mask-weighted lightcurves have units of either count/det or counts/sec/det, where a det is 0.4 x 0.4 = 0.16 sq cm.
Full-time range; 1 s binning
Other quick-look light curves:
- 64 ms binning (zoomed)
- 16 ms binning (zoomed)
- 8 ms binning (zoomed)
- 2 ms binning (zoomed)
- SN=5 or 10 s binning (full-time range)
- Raw light curve
Spectra
- 64 ms binning (zoomed)
- 16 ms binning (zoomed)
- 8 ms binning (zoomed)
- 2 ms binning (zoomed)
- SN=5 or 10 s binning (full-time range)
- Raw light curve
Spectra
Notes:
- 1) The fitting includes the systematic errors.
- 2) When the burst includes telescope slew time periods, the fitting uses an average response file made from multiple 5-s response files through out the slew time plus single time preiod for the non-slew times, and weighted by the total counts in the corresponding time period using addrmf. An average response file is needed becuase a spectral fit using the pre-slew DRM will introduce some errors in both a spectral shape and a normalization if the PHA file contains a lot of the slew/post-slew time interval.
- 3) For fits to more complicated models (e.g. a power-law over a cutoff power-law), the BAT team has decided to require a chi-square improvement of more than 6 for each extra dof.
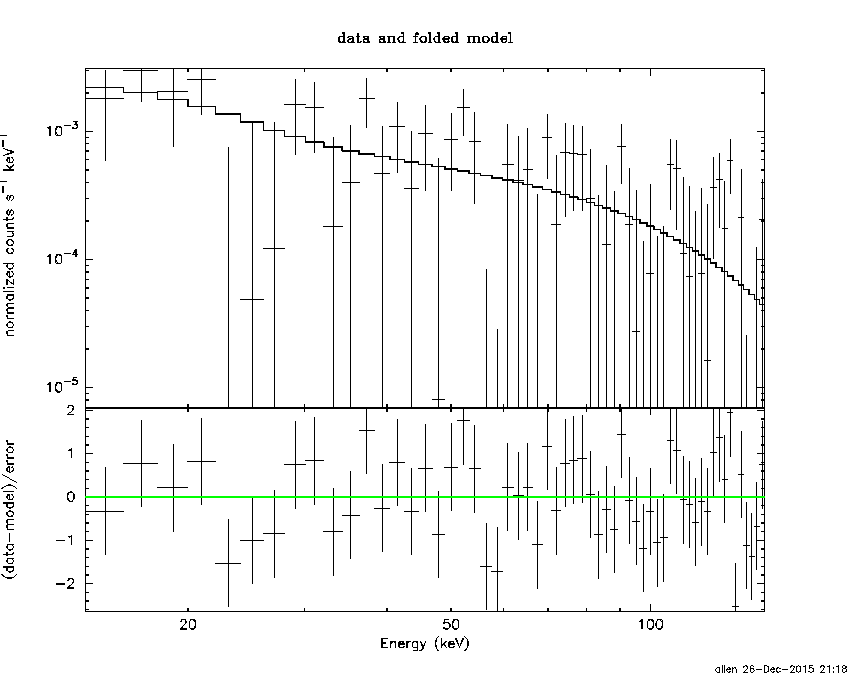
Time averaged spectrum fit using the average DRM
Power-law model
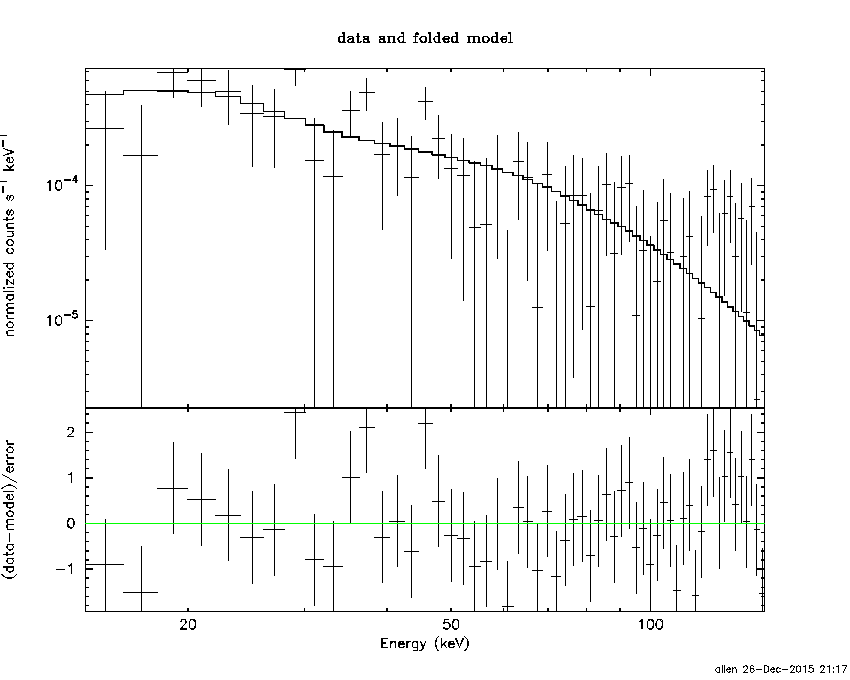
Time interval is from   -2.672 sec. to   26.720 sec.

Spectral model in power-law:
------------------------------------------------------------
Parameters  : value       lower 90%   higher 90%
Photon index: -1.58218     ( -0.311857   0.306052 )
Norm@50keV  : 1.05660E-03    ( -0.000202089   0.000198044 )
------------------------------------------------------------
#Fit statistic : Chi-Squared =          52.62 using 59 PHA bins.
# Reduced chi-squared =         0.9231 for     57 degrees of freedom
# Null hypothesis probability =   6.400448e-01

Photon flux (15-150 keV)    in 29.39 sec: 0.135044 ( -0.023701  0.023715 ) ph/cm2/s
Energy fluence (15-150 keV)             : 2.91112e-07 ( -5.93831e-08  6.10398e-08 ) ergs/cm2
Cutoff power-law model
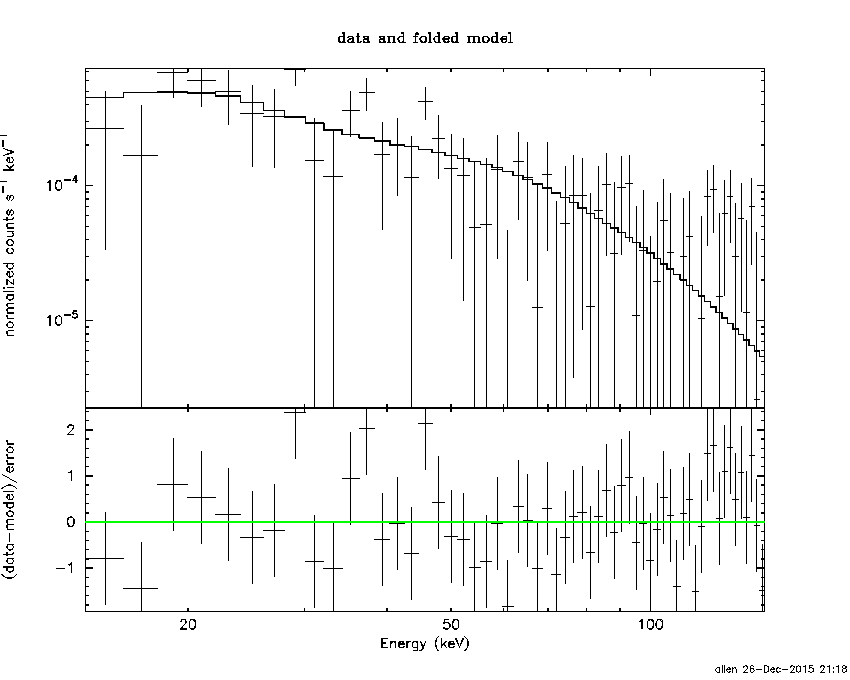
Time interval is from   -2.672 sec. to   26.720 sec.
Spectral model in the cutoff power-law:
------------------------------------------------------------
Parameters  : value       lower 90%   higher 90%
Photon index: -1.28835     ( -0.591006   2.41299 )
Epeak [keV] : 103.087      ( -104.994 -104.994 )
Norm@50keV  : 1.56179E-03    ( -0.000977103   0.043594 )
------------------------------------------------------------
#Fit statistic : Chi-Squared =          52.50 using 59 PHA bins.
# Reduced chi-squared =         0.9376 for     56 degrees of freedom
# Null hypothesis probability =   6.080142e-01

Photon flux (15-150 keV)    in 29.39 sec: 0.133551 ( -0.025491  0.024673 ) ph/cm2/s
Energy fluence (15-150 keV)             : 2.79937e-07 ( -8.72774e-08  7.04196e-08 ) ergs/cm2
1-s peak spectrum fit
Power-law model
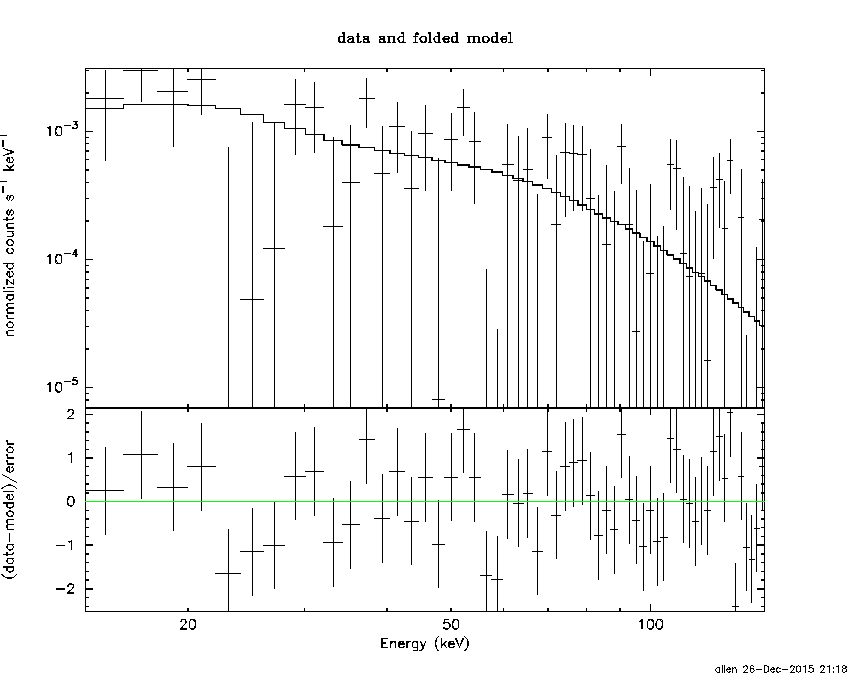
Time interval is from    3.044 sec. to    4.044 sec.

Spectral model in power-law:
------------------------------------------------------------
Parameters  : value       lower 90%   higher 90%
Photon index: -1.48762     ( -0.566544   0.539899 )
Norm@50keV  : 3.71588E-03    ( -0.00112055   0.00106972 )
------------------------------------------------------------
#Fit statistic : Chi-Squared =          55.67 using 59 PHA bins.
# Reduced chi-squared =         0.9766 for     57 degrees of freedom
# Null hypothesis probability =   5.252393e-01

Photon flux (15-150 keV)    in 1 sec: 0.462371 ( -0.128803  0.129275 ) ph/cm2/s
Energy fluence (15-150 keV)             : 3.53281e-08 ( -1.14577e-08  1.18489e-08 ) ergs/cm2
Cutoff power-law model
Time interval is from    3.044 sec. to    4.044 sec.
Spectral model in the cutoff power-law:
------------------------------------------------------------
Parameters  : value       lower 90%   higher 90%
Photon index: -3.25321     ( -0.327119   3.03714 )
Epeak [keV] : 341.311      (   )
Norm@50keV  : 5.00533E-04    (     )
------------------------------------------------------------
#Fit statistic : Chi-Squared =          54.72 using 59 PHA bins.
# Reduced chi-squared =         0.9771 for     56 degrees of freedom
# Null hypothesis probability =   5.234678e-01

Photon flux (15-150 keV)    in 1 sec: 0.463474 (    ) ph/cm2/s
Energy fluence (15-150 keV)             : 3.55558e-08 ( -7.69844e-09  6.46555e-09 ) ergs/cm2
Time-resolved spectra
Distribution
T90 vs. Hardness ratio plot
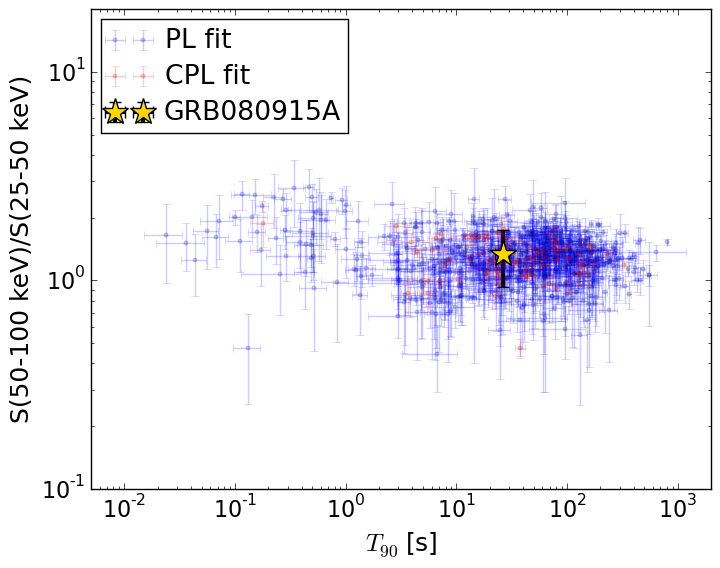
T90                                   = 26.288 sec.
Hardness ratio (energy fluence ratio) = 1.33597979021
S(15-50 keV) vs. S(50-150 keV) plot
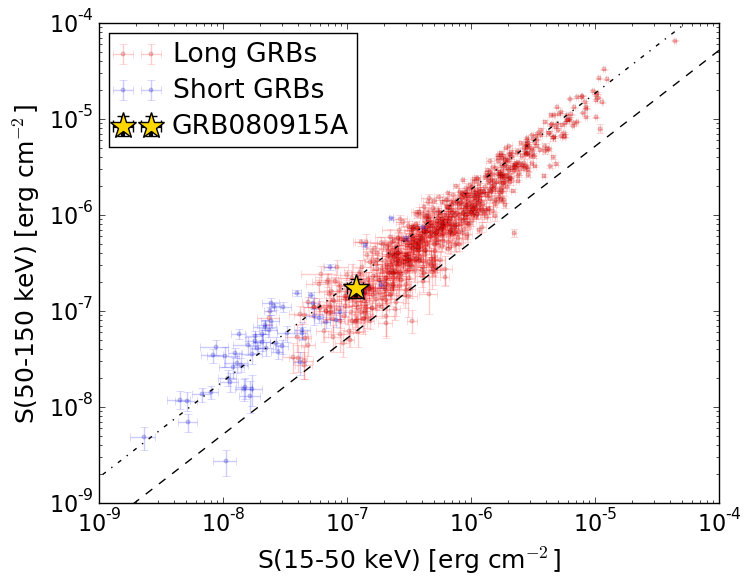
S(15-50 keV)  = 1.1768593e-07
S(50-150 keV) = 1.7342539e-07
The dash-dotted line and the dashed line traces the fluences calculated from the Band function with Epeak = 15 and 150 keV, respectively. Both lines assume a canonical values of alpha = -1 and beta = -2.5.
Mask shadow pattern
IMX = -5.101016289983309E-01, IMY = 8.788627582560590E-02
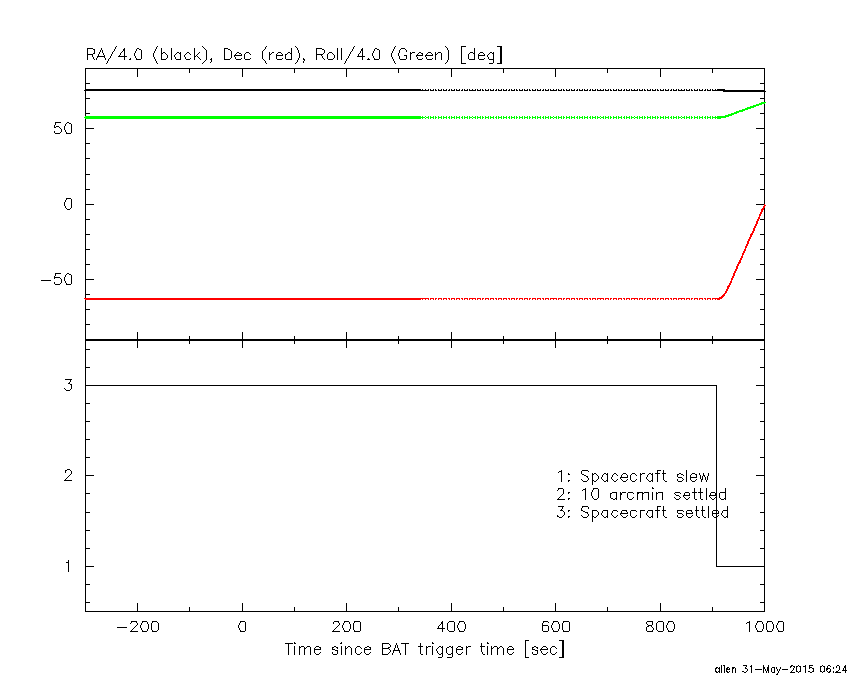
Spacecraft aspect plot
Bright source in the pre-burst/pre-slew/post-slew images
Pre-burst image of 15-350 keV band
Time interval of the image:
-239.056000 -2.672000

# RAcent  DECcent POSerr Theta    Phi  PeakCts   SNR AngSep     Name
#  [deg]    [deg]    ['] [deg]  [deg]                   [']
256.0552 -37.8700    5.8  37.0  -29.5   0.5644   2.0    3.6	4U 1700-377
256.4260 -36.4160   26.7  38.0  -27.8   0.1273   0.4    0.6	GX 349+2
263.1257 -24.7301    4.3  45.7  -11.9   0.9522   2.7    6.4	GX 1+4
264.6800 -44.3862    6.0  27.9  -26.4   0.3978   1.9    4.7	4U 1735-44
270.3978 -25.0392    5.2  42.9   -3.3   0.7618   2.2    6.6	GX 5-1
270.2549 -25.6356    3.9  42.4   -3.8   0.9489   2.9    6.9	GRS 1758-258
273.9867 -14.0274   12.5  52.4    5.6   0.5683   0.9    1.2	GX 17+2
275.9099 -30.3855    4.3  36.2    1.0   0.7152   2.7    1.4	H1820-303
284.9284 -24.8028    9.1  39.4   16.0  -0.4066  -1.3    9.2	HT1900.1-2455
262.9855 -33.8376    2.2  37.6  -18.1   1.3515   5.3    0.3	GX 354-0
292.1667 -18.6176    2.7  44.5   27.4   2.0414   4.2 ------	UNKNOWN
281.0967 -12.1761    2.0  52.5   14.7   4.6759   5.9 ------	UNKNOWN
273.2337 -10.0276    2.5  56.4    6.1   5.4369   4.6 ------	UNKNOWN
Pre-slew background subtracted image of 15-350 keV band
Time interval of the image:
-2.672000 26.720000

# RAcent  DECcent POSerr Theta    Phi  PeakCts   SNR AngSep     Name
#  [deg]    [deg]    ['] [deg]  [deg]                   [']
256.0197 -37.7130    4.7  37.1  -29.3   0.1892   2.5    8.0	4U 1700-377
256.4524 -36.4558   15.0  38.0  -27.8   0.0628   0.8    2.1	GX 349+2
262.9011 -24.8311    7.6  45.7  -12.2  -0.1439  -1.5    7.8	GX 1+4
264.8858 -44.2766    4.1  27.9  -26.0  -0.1717  -2.8   12.1	4U 1735-44
270.1353 -24.9905    6.6  43.1   -3.6  -0.1564  -1.7    9.7	GX 5-1
270.3931 -25.6236   13.2  42.4   -3.6  -0.0755  -0.9    8.7	GRS 1758-258
273.8806 -13.9932    7.7  52.4    5.5   0.2810   1.5    7.7	GX 17+2
276.0659 -30.3460    7.8  36.2    1.2  -0.1066  -1.5    7.4	H1820-303
285.0963 -24.7853   18.3  39.4   16.3   0.0556   0.6    8.8	HT1900.1-2455
262.9986 -33.6872    4.1  37.7  -17.9  -0.2082  -2.8    8.9	GX 354-0
341.0981 -31.8111    2.4  39.6   98.1   1.0078   4.9 ------	UNKNOWN
 17.8850 -76.0444    1.3  27.4 -170.2   0.4774   8.6 ------	UNKNOWN
215.8261 -55.8768    1.9  41.1  -81.3   1.2473   6.1 ------	UNKNOWN
Post-slew image of 15-350 keV band
Time interval of the image: