Analysis Summary
Notes:
- 1) No attempt has been made to eliminate the non-significant decimal places.
- 2) This batgrbproduct analysis is done using the HEASARC data.
- 3) This batgrbproduct analysis is using the flight position for the mask-weighting calculation.
======================================================================
                  BAT GRB EVENT DATA PROCESSING REPORT
    Process Script Ver: batgrbproduct v2.46
    Process Start Time: Sun Jan 19 22:40:37 EST 2014
             Host Name: batevent1
   Current Working Dir: /local/data/batevent/batevent_reproc/trigger324805
======================================================================

  Trigger: 00324805      Segment: 000

  BAT Trigger Time: 243186818.24   [s; MET]
      Trigger Stop: 243186818.368   [s; MET]
               UTC: 2008-09-15T15:53:35.140100    [includes UTCF correction]
       Where From?: TDRSS position message

  BAT
    RA: 213.078560327715   Dec: -11.4732707538459  [deg; J2000]

     Catalogged Source?: NO
     Point Source?:      YES
     GRB Indicated?:     YES    [ by BAT flight software ]
     Image S/N Ratio:    10.57
     Image Trigger?:     NO
     Rate S/N Ratio:     23.473389188611  [ if not an image trigger ]
     Image S/N Ratio:    10.57

  Analysis Position:   [ source = BAT ]
    RA: 213.078560327715   Dec: -11.4732707538459  [deg; J2000]

  Refined Position:   [ source = BAT pre-slew burst ]
    RA: 213.087987204382   Dec: -11.4904661441536  [deg; J2000]
        { 14h 12m 21.1s , -11d 29' 25.7" }
         +/- 0.779382872910783 [arcmin] (estimated 90% radius based on SNR)
         +/- 0.245163071345694 [arcmin] (formal 1-sigma fit error)
    SNR: 43.4270182902908

  Angular difference between the analysis and refined position is 1.171194 arcmin

  Partial Coding Fraction: 0.7421875    [ including projection effects ]

  Duration
     T90: 4.05200001597404 +/- 0.607328571222746
        Measured from: -0.156000018119812
                   to: 3.89599999785423     [s; relative to TRIGTIME]
     T50: 1.07600000500679 +/- 0.101980397051727
        Measured from: 0.412000000476837
                   to: 1.48800000548363     [s; relative to TRIGTIME]


  Fluence
     Peak Flux  (peak 1 second)
        Measured from: 0.175999999046326
                   to: 1.17599999904633     [s; relative to TRIGTIME]
     Total Fluence
        Measured from: -0.532000005245209
                   to: 6.14800000190735     [s; relative to TRIGTIME]

             Band 1     Band 2     Band 3     Band 4
              15-25      25-50     50-100    100-350     keV
 Total     0.652910   0.767040   0.428383   0.045302
           0.019846   0.021759   0.020417   0.021377 [error]
 Peak      0.273363   0.393802   0.244957   0.056357
           0.009807   0.011115   0.010015   0.008859 [error]

     [ fluence units of on-axis counts / fully illuminated detector ]

======================================================================


====== Table of the duration information =============================

        Value   tstart    tstop
T100    6.680   -0.532    6.148
T90     4.052   -0.156    3.896
T50     1.076    0.412    1.488
Peak    1.000    0.176    1.176


====== Spectral Analysis Summary =====================================

Model      : spectral model: simple power-law (PL) and cutoff power-law (CPL)
Ph_index   : photon index: E^{Ph_index}
Ph_90err   : 90% error of the photon index
Epeak      : Epeak in keV
Epeak_90err: 90% error of Epeak
Norm       : normalization at 50 keV in both the PL model and CPL model
Nomr_90err : 90% error of the normalization
chi2       : Chi-Squared
dof        : degree of freedo

=== Time-averaged spectral analysis ===
(Best model with acceptable fit: N/A)

Model Ph_index Ph_90err_low Ph_90err_hi  Epeak  Epeak_90err_low  Epeak_90err_hi  Norm       Nomr_90err_low    Norm_90err_hi    chi2    dof
PL      -1.957    -0.077      0.076       -           -               -         1.78e-02     -7.85e-04          7.80e-04      71.980   57
CPL     -1.439    -0.312      0.338       48.331      -7.594        12.136      3.40e-02     -1.07e-02          1.75e-02      63.500   56


=== 1-s peak spectral analysis ===
(Best model with acceptable fit: CPL)

Model Ph_index Ph_90err_low Ph_90err_hi  Epeak  Epeak_90err_low  Epeak_90err_hi  Norm       Nomr_90err_low    Norm_90err_hi    chi2    dof
PL      -1.728     -0.067     0.067       -           -               -         6.41e-02     -2.48e-03          2.48e-03      73.090   57
CPL     -1.118     -0.288     0.309       69.220      -9.522        20.859      1.33e-01     -3.78e-02          5.82e-02      59.030   56


=== Fluence/Peak Flux Summary ===

              Model    Band1     Band2     Band3     Band4     Band5     Total
                       15-25     25-50    50-100    100-350    15-150    15-350    keV
Fluence         PL   2.34e-07  3.26e-07  3.36e-07  6.33e-07  1.10e-06  1.53e-06   erg/cm2
      90%_error_low -1.46e-08 -1.24e-08 -2.07e-08 -7.83e-08 -4.66e-08 -9.72e-08   erg/cm2
      90%_error_hi   1.49e-08  1.24e-08  2.08e-08  8.57e-08  4.69e-08  1.03e-07   erg/cm2
Peak flux       PL   3.28e+00  2.89e+00  1.75e+00  1.59e+00  8.60e+00  9.51e+00   ph/cm2/s
      90%_error_low -2.06e-01 -1.12e-01 -8.71e-02 -1.56e-01 -3.29e-01 -3.48e-01   ph/cm2/s
      90%_error_hi   2.11e-01  1.12e-01  8.69e-02  1.67e-01  3.30e-01  3.48e-01   ph/cm2/s

Fluence        CPL    N/A      N/A      N/A      N/A      N/A      N/A      erg/cm2
      90%_error_low -1.46e-08 -1.24e-08 -2.07e-08 -7.83e-08 -4.66e-08 -9.72e-08   erg/cm2
      90%_error_hi   1.49e-08  1.24e-08  2.08e-08  8.57e-08  4.69e-08  1.03e-07   erg/cm2
Peak flux      CPL   2.95e+00  3.04e+00  1.80e+00  8.12e-01  8.30e+00  8.60e+00   ph/cm2/s
      90%_error_low -2.50e-01 -1.33e-01 -9.55e-02 -2.10e-01 -3.54e-01 -4.28e-01   ph/cm2/s
      90%_error_hi   2.54e-01  1.35e-01  9.61e-02  2.88e-01  3.55e-01  4.61e-01   ph/cm2/s

======================================================================
Image
Pre-slew 15.0-350.0 keV image (Event data)
#   RAcent    DECcent   POSerr    Theta     Phi              Peak Cts       SNR   Name
  213.0880   -11.4905   0.0044    32.3197   -26.1081         1.9945508     43.427 TRIG_00324805

Foreground time interval of the image:
 -0.532   6.148 (delta_t =   6.680 [sec])
Background time interval of the image:
-60.240  -0.532 (delta_t =  59.708 [sec])
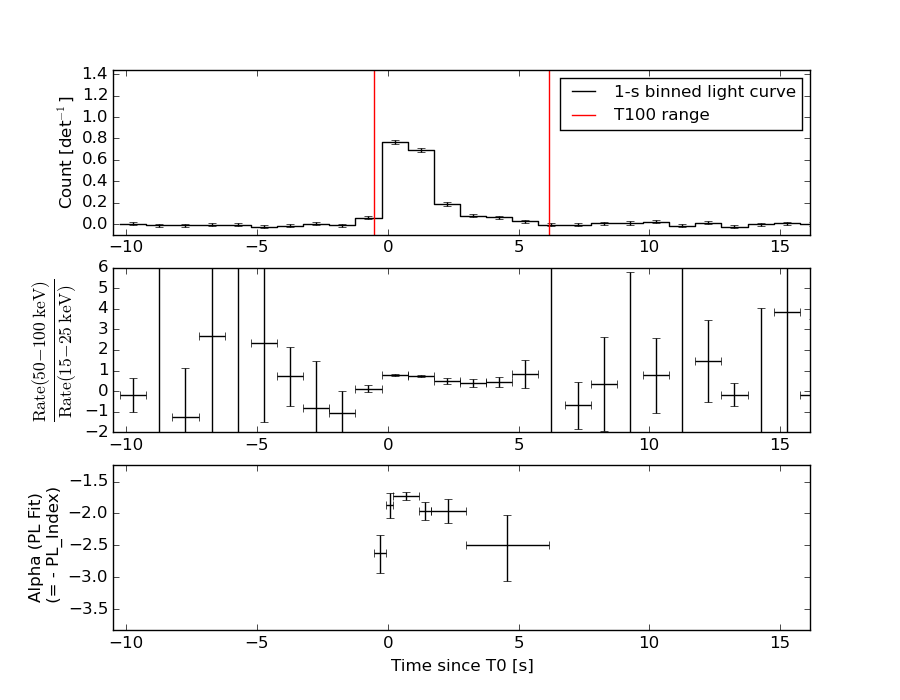
Light Curves
Note: The mask-weighted lightcurves have units of either count/det or counts/sec/det, where a det is 0.4 x 0.4 = 0.16 sq cm.
Full-time range; 1 s binning
Other quick-look light curves:
- 64 ms binning (zoomed)
- 16 ms binning (zoomed)
- 8 ms binning (zoomed)
- 2 ms binning (zoomed)
- SN=5 or 10 s binning (full-time range)
- Raw light curve
Spectra
- 64 ms binning (zoomed)
- 16 ms binning (zoomed)
- 8 ms binning (zoomed)
- 2 ms binning (zoomed)
- SN=5 or 10 s binning (full-time range)
- Raw light curve
Spectra
Notes:
- 1) The fitting includes the systematic errors.
- 2) When the burst includes telescope slew time periods, the fitting uses an average response file made from multiple 5-s response files through out the slew time plus single time preiod for the non-slew times, and weighted by the total counts in the corresponding time period using addrmf. An average response file is needed becuase a spectral fit using the pre-slew DRM will introduce some errors in both a spectral shape and a normalization if the PHA file contains a lot of the slew/post-slew time interval.
- 3) For fits to more complicated models (e.g. a power-law over a cutoff power-law), the BAT team has decided to require a chi-square improvement of more than 6 for each extra dof.
Time averaged spectrum fit using the average DRM
Power-law model
Time interval is from   -0.532 sec. to    6.148 sec.

Spectral model in power-law:
------------------------------------------------------------
Parameters  : value       lower 90%   higher 90%
Photon index: -1.95677     ( -0.0773066   0.0762457 )
Norm@50keV  : 1.78414E-02    ( -0.0007852   0.000779724 )
------------------------------------------------------------
#Fit statistic : Chi-Squared =          71.98 using 59 PHA bins.
# Reduced chi-squared =          1.263 for     57 degrees of freedom
# Null hypothesis probability =   8.740461e-02

Photon flux (15-150 keV)    in 6.68 sec: 2.62458 ( -0.10418  0.10441 ) ph/cm2/s
Energy fluence (15-150 keV)             : 1.0972e-06 ( -4.65814e-08  4.69032e-08 ) ergs/cm2
Cutoff power-law model
Time interval is from   -0.532 sec. to    6.148 sec.
Spectral model in the cutoff power-law:
------------------------------------------------------------
Parameters  : value       lower 90%   higher 90%
Photon index: -1.43893     ( -0.311962   0.338301 )
Epeak [keV] : 48.3311      ( -7.59376 12.136 )
Norm@50keV  : 3.39553E-02    ( -0.0106999   0.0175359 )
------------------------------------------------------------
#Fit statistic : Chi-Squared =          63.50 using 59 PHA bins.
# Reduced chi-squared =          1.134 for     56 degrees of freedom
# Null hypothesis probability =   2.290997e-01

Photon flux (15-150 keV)    in 6.68 sec: 2.53258 ( -0.11635  0.11665 ) ph/cm2/s
Energy fluence (15-150 keV)             : 0 ( 0  0 ) ergs/cm2
1-s peak spectrum fit
Power-law model
Time interval is from    0.176 sec. to    1.176 sec.

Spectral model in power-law:
------------------------------------------------------------
Parameters  : value       lower 90%   higher 90%
Photon index: -1.72755     ( -0.0672488   0.0667085 )
Norm@50keV  : 6.41221E-02    ( -0.00248469   0.00247648 )
------------------------------------------------------------
#Fit statistic : Chi-Squared =          73.09 using 59 PHA bins.
# Reduced chi-squared =          1.282 for     57 degrees of freedom
# Null hypothesis probability =   7.410017e-02

Photon flux (15-150 keV)    in 1 sec: 8.60013 ( -0.32923  0.32977 ) ph/cm2/s
Energy fluence (15-150 keV)             : 5.92598e-07 ( -2.3876e-08  2.39544e-08 ) ergs/cm2
Cutoff power-law model
Time interval is from    0.176 sec. to    1.176 sec.
Spectral model in the cutoff power-law:
------------------------------------------------------------
Parameters  : value       lower 90%   higher 90%
Photon index: -1.11782     ( -0.287999   0.309362 )
Epeak [keV] : 69.2197      ( -9.52155 20.8591 )
Norm@50keV  : 0.132538    ( -0.0377865   0.0581496 )
------------------------------------------------------------
#Fit statistic : Chi-Squared =          59.03 using 59 PHA bins.
# Reduced chi-squared =          1.054 for     56 degrees of freedom
# Null hypothesis probability =   3.653336e-01

Photon flux (15-150 keV)    in 1 sec: 8.30291 ( -0.35435  0.3549 ) ph/cm2/s
Energy fluence (15-150 keV)             : 5.61798e-07 ( -2.76889e-08  2.77511e-08 ) ergs/cm2
Time-resolved spectra
Distribution
T90 vs. Hardness ratio plot
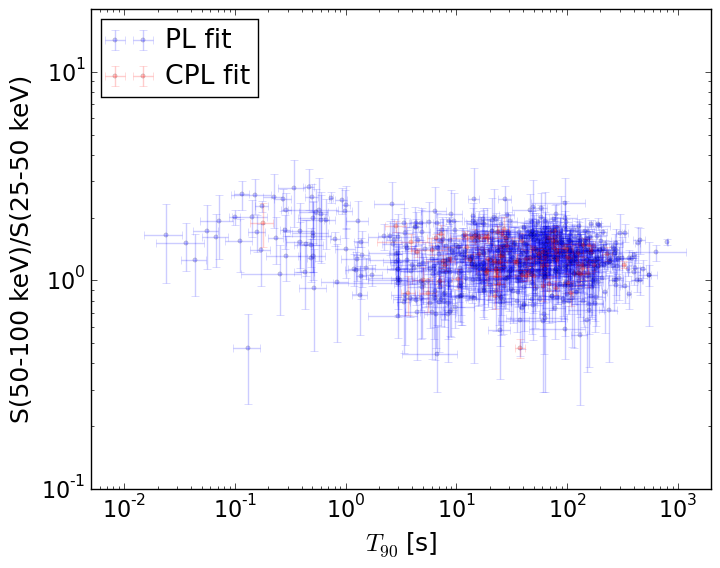
T90                                   = N/A sec.
Hardness ratio (energy fluence ratio) = N/A
S(15-50 keV) vs. S(50-150 keV) plot
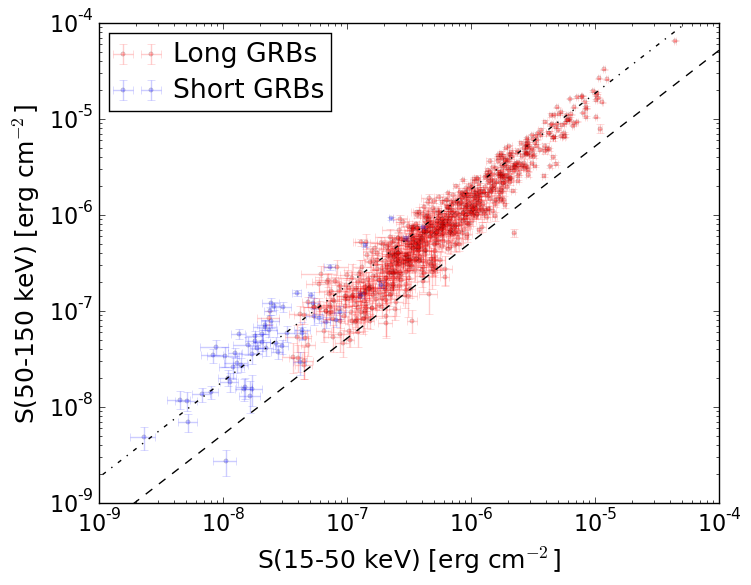
S(15-50 keV)  = N/A
S(50-150 keV) = N/A
The dash-dotted line and the dashed line traces the fluences calculated from the Band function with Epeak = 15 and 150 keV, respectively. Both lines assume a canonical values of alpha = -1 and beta = -2.5.
Mask shadow pattern
IMX = 5.681019625274246E-01, IMY = 2.784099831101502E-01
Spacecraft aspect plot
Bright source in the pre-burst/pre-slew/post-slew images
Pre-burst image of 15-350 keV band
Time interval of the image:
-60.240000 -0.532000

# RAcent  DECcent POSerr Theta    Phi  PeakCts   SNR AngSep     Name
#  [deg]    [deg]    ['] [deg]  [deg]                   [']
135.5550 -40.4964    9.7  45.1 -170.2   0.1432   1.2    3.7	Vela X-1
170.5941 -60.6347    4.8  25.9  149.6  -0.1964  -2.4    8.2	Cen X-3
186.6346 -62.6564    6.9  23.3  131.6   0.1457   1.7    6.9	GX 301-2
245.0368 -15.6376    2.7  49.1   15.8   0.9539   4.3    3.3	Sco X-1
256.0396 -37.8918   12.8  46.0   48.6   0.2982   0.9    3.8	4U 1700-377
229.6159 -17.6900    2.7  36.7    3.4   0.4056   4.3 ------	UNKNOWN
199.3564   6.7896    2.5  46.9  -54.3   1.5655   4.6 ------	UNKNOWN
Pre-slew background subtracted image of 15-350 keV band
Time interval of the image:
-0.532000 6.148000

# RAcent  DECcent POSerr Theta    Phi  PeakCts   SNR AngSep     Name
#  [deg]    [deg]    ['] [deg]  [deg]                   [']
135.5066 -40.5455   16.3  45.1 -170.3   0.0480   0.7    1.1	Vela X-1
170.3148 -60.6247   37.4  26.0  149.8   0.0137   0.3    0.1	Cen X-3
186.7850 -62.9028   12.0  23.6  131.2  -0.0463  -1.0    8.7	GX 301-2
245.0751 -15.6864   15.2  49.1   15.8   0.0893   0.8    6.2	Sco X-1
255.9022 -37.7509    7.3  45.9   48.4   0.2691   1.6    6.9	4U 1700-377
213.0880 -11.4905    0.3  32.3  -26.1   1.9945  43.4 ------	UNKNOWN
147.8453 -19.3603    2.5  45.8 -136.9   0.4129   4.7 ------	UNKNOWN
Post-slew image of 15-350 keV band
Time interval of the image:
185.260600 842.842800

# RAcent  DECcent POSerr Theta    Phi  PeakCts   SNR AngSep     Name
#  [deg]    [deg]    ['] [deg]  [deg]                   [']
244.9817 -15.6333    0.6  41.0  -49.2  21.7045  19.6    0.4	Sco X-1
255.9908 -37.8274    0.6  22.1  -79.8  11.3359  20.0    1.0	4U 1700-377
256.6235 -36.5406    4.1  21.8  -76.2   1.5646   2.8   11.5	GX 349+2
263.1484 -24.5762   14.1  22.2  -40.5   0.3922   0.8   12.7	GX 1+4
264.9394 -44.3573    4.1  15.8 -101.5   1.3326   2.8   10.1	4U 1735-44
268.3285  -1.4575    3.4  39.2   -6.7   2.2951   3.4    2.4	SW J1753.5-0127
270.2395 -25.0279    2.3  17.4  -27.7   2.2791   5.0    3.9	GX 5-1
270.1768 -25.7659    2.5  16.9  -29.4   2.0139   4.6    6.9	GRS 1758-258
274.0050 -14.0569    1.6  25.5   -4.5   4.1784   7.2    1.2	GX 17+2
275.9535 -30.3040    2.5  10.2  -25.2   2.1925   4.7    4.1	H1820-303
285.1531 -25.0423    5.1  12.9   23.0   0.9857   2.3    9.7	HT1900.1-2455
288.8290  10.9700    2.0  49.1   24.9  10.0910   5.8    2.3	GRS 1915+105
263.0240 -33.8319    3.8  17.5  -64.2   1.4885   3.0    1.7	GX 354-0
280.6153 -11.4337    1.6  26.7   11.1   3.6442   7.1 ------	UNKNOWN
270.8837  -5.0162    3.7  35.0   -4.6   1.9382   3.1 ------	UNKNOWN