Analysis Summary
Notes:
- 1) No attempt has been made to eliminate the non-significant decimal places.
- 2) This batgrbproduct analysis is done using the HEASARC data.
- 3) This batgrbproduct analysis is using the flight position for the mask-weighting calculation.
======================================================================
BAT GRB EVENT DATA PROCESSING REPORT
Process Script Ver: batgrbproduct v2.46
Process Start Time: Sun Jan 19 22:31:21 EST 2014
Host Name: batevent1
Current Working Dir: /local/data/batevent/batevent_reproc/trigger324907
======================================================================
Trigger: 00324907 Segment: 000
BAT Trigger Time: 243269090.432 [s; MET]
Trigger Stop: 243269094.528 [s; MET]
UTC: 2008-09-16T14:44:47.329660 [includes UTCF correction]
Where From?: TDRSS position message
BAT
RA: 163.624433225854 Dec: 69.0443697041981 [deg; J2000]
Catalogged Source?: NO
Point Source?: YES
GRB Indicated?: YES [ by BAT flight software ]
Image S/N Ratio: 7.33
Image Trigger?: NO
Rate S/N Ratio: 8.48528137423857 [ if not an image trigger ]
Image S/N Ratio: 7.33
Analysis Position: [ source = BAT ]
RA: 163.624433225854 Dec: 69.0443697041981 [deg; J2000]
Refined Position: [ source = BAT pre-slew burst ]
RA: 163.626367345842 Dec: 69.0638946295065 [deg; J2000]
{ 10h 54m 30.3s , +69d 03' 50.0" }
+/- 2.00134034112659 [arcmin] (estimated 90% radius based on SNR)
+/- 0.773725823375993 [arcmin] (formal 1-sigma fit error)
SNR: 11.2891145706606
Angular difference between the analysis and refined position is 1.172230 arcmin
Partial Coding Fraction: 0.53125 [ including projection effects ]
Duration
T90: 33.5439999997616 +/- 6.96964046465048
Measured from: -0.948000013828278
to: 32.5959999859333 [s; relative to TRIGTIME]
T50: 15.444000005722 +/- 6.16649331210442
Measured from: 2.783999979496
to: 18.227999985218 [s; relative to TRIGTIME]
Fluence
Peak Flux (peak 1 second)
Measured from: 1.391999989748
to: 2.391999989748 [s; relative to TRIGTIME]
Total Fluence
Measured from: -2.59200000762939
to: 35.7360000014305 [s; relative to TRIGTIME]
Band 1 Band 2 Band 3 Band 4
15-25 25-50 50-100 100-350 keV
Total 0.252556 0.345226 0.293743 0.062999
0.040326 0.042572 0.039188 0.039069 [error]
Peak 0.009389 0.027509 0.021936 0.009449
0.006630 0.007023 0.006471 0.006376 [error]
[ fluence units of on-axis counts / fully illuminated detector ]
======================================================================
====== Table of the duration information =============================
Value tstart tstop
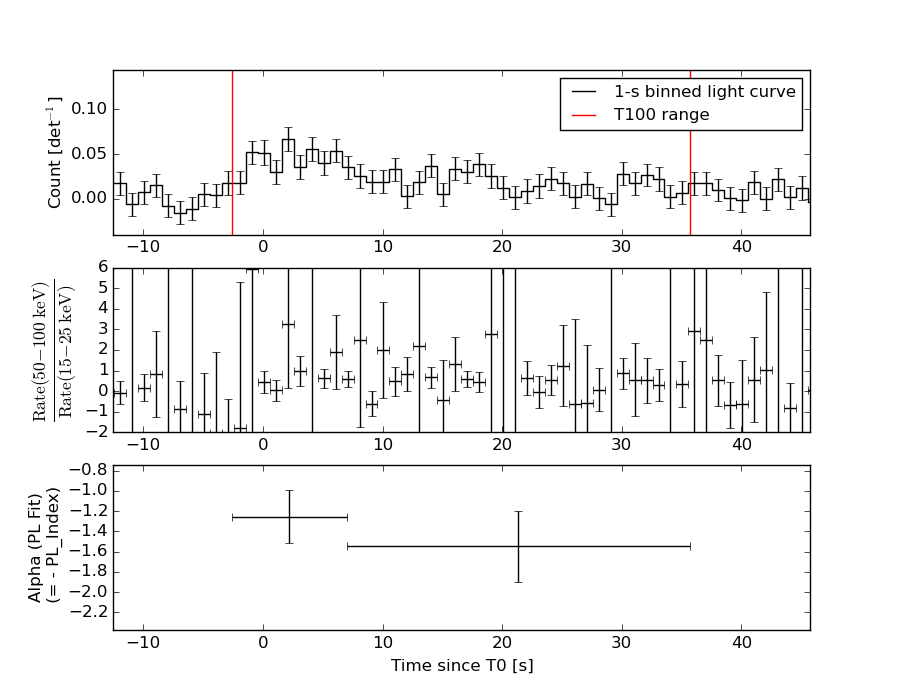
T100 38.328 -2.592 35.736
T90 33.544 -0.948 32.596
T50 15.444 2.784 18.228
Peak 1.000 1.392 2.392
====== Spectral Analysis Summary =====================================
Model : spectral model: simple power-law (PL) and cutoff power-law (CPL)
Ph_index : photon index: E^{Ph_index}
Ph_90err : 90% error of the photon index
Epeak : Epeak in keV
Epeak_90err: 90% error of Epeak
Norm : normalization at 50 keV in both the PL model and CPL model
Nomr_90err : 90% error of the normalization
chi2 : Chi-Squared
dof : degree of freedo
=== Time-averaged spectral analysis ===
(Best model with acceptable fit: PL)
Model Ph_index Ph_90err_low Ph_90err_hi Epeak Epeak_90err_low Epeak_90err_hi Norm Nomr_90err_low Norm_90err_hi chi2 dof
PL -1.428 -0.226 0.225 - - - 1.73e-03 -2.29e-04 2.27e-04 47.130 57
CPL -0.860 -0.813 1.295 96.136 -38.681 -96.136 3.43e-03 -1.88e-03 1.25e-02 46.210 56
=== 1-s peak spectral analysis ===
(Best model with acceptable fit: PL)
Model Ph_index Ph_90err_low Ph_90err_hi Epeak Epeak_90err_low Epeak_90err_hi Norm Nomr_90err_low Norm_90err_hi chi2 dof
PL -0.960 -0.605 0.718 - - - 4.72e-03 -1.55e-03 1.42e-03 61.670 57
CPL -0.985 -0.580 0.848 9999.360 -9999.360 -9999.360 4.77e-03 -1.57e-03 9.46e-03 61.690 56
=== Fluence/Peak Flux Summary ===
Model Band1 Band2 Band3 Band4 Band5 Total
15-25 25-50 50-100 100-350 15-150 15-350 keV
Fluence PL 7.92e-08 1.52e-07 2.26e-07 7.24e-07 6.38e-07 1.18e-06 erg/cm2
90%_error_low -1.67e-08 -2.04e-08 -3.90e-08 -2.34e-07 -9.40e-08 -2.70e-07 erg/cm2
90%_error_hi 1.76e-08 2.02e-08 3.88e-08 3.03e-07 9.56e-08 3.28e-07 erg/cm2
Peak flux PL 1.16e-01 1.61e-01 1.66e-01 3.12e-01 5.42e-01 7.55e-01 ph/cm2/s
90%_error_low -7.36e-02 -7.23e-02 -5.39e-02 -1.84e-01 -1.69e-01 -2.34e-01 ph/cm2/s
90%_error_hi 9.51e-02 6.52e-02 5.11e-02 3.44e-01 1.70e-01 2.79e-01 ph/cm2/s
Fluence CPL 7.29e-08 1.62e-07 2.31e-07 3.04e-07 6.03e-07 7.69e-07 erg/cm2
90%_error_low -2.05e-08 -2.62e-08 -4.24e-08 -2.27e-07 -1.13e-07 -2.55e-07 erg/cm2
90%_error_hi 2.06e-08 2.81e-08 4.26e-08 2.59e-07 1.13e-07 6.93e-07 erg/cm2
Peak flux CPL 6.30e-02 4.95e-02 2.38e-02 2.13e-02 1.42e-01 1.72e-01 ph/cm2/s
90%_error_low -6.30e-02 -4.95e-02 -2.38e-02 -2.13e-02 -1.42e-01 -1.72e-01 ph/cm2/s
90%_error_hi 1.10e-01 8.71e-02 4.35e-02 3.12e-02 1.88e-01 1.64e-01 ph/cm2/s
======================================================================
Image
Pre-slew 15.0-350.0 keV image (Event data)
#   RAcent    DECcent   POSerr    Theta     Phi              Peak Cts       SNR   Name
  163.6264    69.0639   0.0171    30.0425   -58.9416         0.9975319     11.289 TRIG_00324907

Foreground time interval of the image:
 -2.592  35.736 (delta_t =  38.328 [sec])
Background time interval of the image:
-214.731  -2.592 (delta_t = 212.139 [sec])
Light Curves
Note: The mask-weighted lightcurves have units of either count/det or counts/sec/det, where a det is 0.4 x 0.4 = 0.16 sq cm.
Full-time range; 1 s binning
Other quick-look light curves:
- 64 ms binning (zoomed)
- 16 ms binning (zoomed)
- 8 ms binning (zoomed)
- 2 ms binning (zoomed)
- SN=5 or 10 s binning (full-time range)
- Raw light curve
Spectra
- 64 ms binning (zoomed)
- 16 ms binning (zoomed)
- 8 ms binning (zoomed)
- 2 ms binning (zoomed)
- SN=5 or 10 s binning (full-time range)
- Raw light curve
Spectra
Notes:
- 1) The fitting includes the systematic errors.
- 2) When the burst includes telescope slew time periods, the fitting uses an average response file made from multiple 5-s response files through out the slew time plus single time preiod for the non-slew times, and weighted by the total counts in the corresponding time period using addrmf. An average response file is needed becuase a spectral fit using the pre-slew DRM will introduce some errors in both a spectral shape and a normalization if the PHA file contains a lot of the slew/post-slew time interval.
- 3) For fits to more complicated models (e.g. a power-law over a cutoff power-law), the BAT team has decided to require a chi-square improvement of more than 6 for each extra dof.
Time averaged spectrum fit using the average DRM
Power-law model
Time interval is from   -2.592 sec. to   35.736 sec.

Spectral model in power-law:
------------------------------------------------------------
Parameters  : value       lower 90%   higher 90%
Photon index: -1.42791     ( -0.226132   0.224672 )
Norm@50keV  : 1.73155E-03    ( -0.000229229   0.000227493 )
------------------------------------------------------------
#Fit statistic : Chi-Squared =          47.13 using 59 PHA bins.
# Reduced chi-squared =         0.8269 for     57 degrees of freedom
# Null hypothesis probability =   8.212868e-01

Photon flux (15-150 keV)    in 38.33 sec: 0.212249 ( -0.027371  0.0274 ) ph/cm2/s
Energy fluence (15-150 keV)             : 6.3785e-07 ( -9.39622e-08  9.5564e-08 ) ergs/cm2
Cutoff power-law model
Time interval is from   -2.592 sec. to   35.736 sec.
Spectral model in the cutoff power-law:
------------------------------------------------------------
Parameters  : value       lower 90%   higher 90%
Photon index: -0.86044     ( -0.81259   1.29467 )
Epeak [keV] : 96.1359      ( -38.6992 -96.1537 )
Norm@50keV  : 3.42672E-03    ( -0.00187573   0.0125333 )
------------------------------------------------------------
#Fit statistic : Chi-Squared =          46.21 using 59 PHA bins.
# Reduced chi-squared =         0.8252 for     56 degrees of freedom
# Null hypothesis probability =   8.214278e-01

Photon flux (15-150 keV)    in 38.33 sec: 0.206710 ( -0.029544  0.029134 ) ph/cm2/s
Energy fluence (15-150 keV)             : 6.02739e-07 ( -1.12657e-07  1.13188e-07 ) ergs/cm2
1-s peak spectrum fit
Power-law model
Time interval is from    1.392 sec. to    2.392 sec.

Spectral model in power-law:
------------------------------------------------------------
Parameters  : value       lower 90%   higher 90%
Photon index: -0.960132     ( -0.605247   0.717244 )
Norm@50keV  : 4.72059E-03    ( -0.00154517   0.00141923 )
------------------------------------------------------------
#Fit statistic : Chi-Squared =          61.67 using 59 PHA bins.
# Reduced chi-squared =          1.082 for     57 degrees of freedom
# Null hypothesis probability =   3.126218e-01

Photon flux (15-150 keV)    in 1 sec: 0.542481 ( -0.168962  0.169968 ) ph/cm2/s
Energy fluence (15-150 keV)             : 5.17965e-08 ( -1.63625e-08  1.65097e-08 ) ergs/cm2
Cutoff power-law model

Time interval is from    1.392 sec. to    2.392 sec.
Spectral model in the cutoff power-law:
------------------------------------------------------------
Parameters  : value       lower 90%   higher 90%
Photon index: -0.985039     ( -0.581535   0.846318 )
Epeak [keV] : 9999.36      ( -9999.36 -9999.36 )
Norm@50keV  : 4.76906E-03    ( -0.00156332   0.00946723 )
------------------------------------------------------------
#Fit statistic : Chi-Squared =          61.69 using 59 PHA bins.
# Reduced chi-squared =          1.102 for     56 degrees of freedom
# Null hypothesis probability =   2.798408e-01

Photon flux (15-150 keV)    in 1 sec: 0.141675 ( -0.141675  0.18843 ) ph/cm2/s
Energy fluence (15-150 keV)             : 5.15929e-08 ( -1.65016e-08  1.69938e-08 ) ergs/cm2
Time-resolved spectra
Distribution
T90 vs. Hardness ratio plot
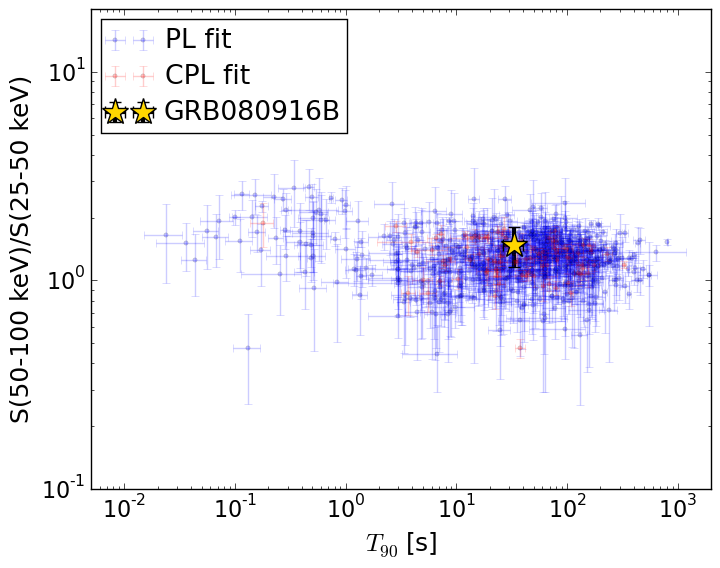
T90                                   = 33.544 sec.
Hardness ratio (energy fluence ratio) = 1.48672275492
S(15-50 keV) vs. S(50-150 keV) plot

S(15-50 keV)  = 2.3133083e-07
S(50-150 keV) = 4.0652e-07
The dash-dotted line and the dashed line traces the fluences calculated from the Band function with Epeak = 15 and 150 keV, respectively. Both lines assume a canonical values of alpha = -1 and beta = -2.5.
Mask shadow pattern
IMX = 2.983725448065760E-01, IMY = 4.954300609552840E-01
Spacecraft aspect plot
Bright source in the pre-burst/pre-slew/post-slew images
Pre-burst image of 15-350 keV band
Time interval of the image:
-214.731400 -2.592000

# RAcent  DECcent POSerr Theta    Phi  PeakCts   SNR AngSep     Name
#  [deg]    [deg]    ['] [deg]  [deg]                   [']
254.4152  35.3414    1.5  40.5 -171.1   2.0124   7.5    2.1	Her X-1
299.5773  35.2094    0.6  41.1  131.6   8.9936  17.8    0.8	Cyg X-1
308.1010  41.0058    3.4  36.8  119.2   1.5672   3.4    3.2	Cyg X-3
258.9515  30.0997    2.5  45.2 -177.6   1.4651   4.6 ------	UNKNOWN
239.1568  19.9465    3.4  57.9 -156.8   3.9803   3.4 ------	UNKNOWN
Pre-slew background subtracted image of 15-350 keV band
Time interval of the image:
-2.592000 35.736000

# RAcent  DECcent POSerr Theta    Phi  PeakCts   SNR AngSep     Name
#  [deg]    [deg]    ['] [deg]  [deg]                   [']
254.5796  35.2397    7.3  40.5 -171.3   0.1534   1.6    8.6	Her X-1
299.5985  35.2347    8.3  41.1  131.5  -0.2758  -1.4    2.0	Cyg X-1
307.9541  40.8857    7.9  36.9  119.5   0.2465   1.5    8.1	Cyg X-3
 59.2889  47.6390    2.3  55.5   11.2   1.7835   5.1 ------	UNKNOWN
163.6264  69.0639    1.0  30.0  -58.9   0.9975  11.3 ------	UNKNOWN
Post-slew image of 15-350 keV band
Time interval of the image:
400.068590 962.683300

# RAcent  DECcent POSerr Theta    Phi  PeakCts   SNR AngSep     Name
#  [deg]    [deg]    ['] [deg]  [deg]                   [']
254.4658  35.2974    4.0  41.1  -66.2   3.6517   2.9    2.7	Her X-1
268.2938  -1.4055    3.4  37.1 -129.7   2.1955   3.4    5.3	SW J1753.5-0127
270.3058 -25.0771    6.4  53.6 -154.2   2.2728   1.8    1.2	GX 5-1
270.3258 -25.7510    4.9  54.1 -154.7   3.0896   2.3    1.3	GRS 1758-258
274.0279 -14.0040    2.8  42.4 -149.7   2.8745   4.1    2.3	GX 17+2
275.9279 -30.5190    5.8  55.8 -162.8  -3.0133  -2.0    9.1	H1820-303
284.9241 -24.9281   15.0  47.7 -169.6   0.6052   0.8    6.1	HT1900.1-2455
288.7881  10.9661    0.6  13.7 -141.5   6.9501  19.9    1.4	GRS 1915+105
299.5976  35.2084    0.1  14.3   -3.0  27.8432  80.7    0.5	Cyg X-1
308.1252  40.9539    1.0  21.6   13.5   4.0170  11.1    0.7	Cyg X-3
326.2381  38.2099    4.0  29.5   41.5   1.4187   2.9    7.4	Cyg X-2
317.9565  18.9386    3.2  18.3   86.3   1.3889   3.6 ------	UNKNOWN
298.7561  43.8189    2.9  22.9   -6.1   1.4534   4.0 ------	UNKNOWN
300.9529  57.2693    3.3  36.4   -4.2   1.8556   3.5 ------	UNKNOWN
253.6559  27.6558    2.6  41.3  -77.9   7.1444   4.4 ------	UNKNOWN
257.7452   2.9571    2.5  43.6 -115.1   8.0535   4.6 ------	UNKNOWN