Analysis Summary
Notes:
- 1) No attempt has been made to eliminate the non-significant decimal places.
- 2) This batgrbproduct analysis is done using the HEASARC data.
- 3) This batgrbproduct analysis is using the flight position for the mask-weighting calculation.
======================================================================
BAT GRB EVENT DATA PROCESSING REPORT
Process Script Ver: batgrbproduct v2.46
Process Start Time: Sun Jan 19 22:13:35 EST 2014
Host Name: batevent1
Current Working Dir: /local/data/batevent/batevent_reproc/trigger330856
======================================================================
Trigger: 00330856 Segment: 000
BAT Trigger Time: 245049835.904 [s; MET]
Trigger Stop: 245049836.928 [s; MET]
UTC: 2008-10-07T05:23:52.748620 [includes UTCF correction]
Where From?: TDRSS position message
BAT
RA: 339.976068527769 Dec: -40.1359411791978 [deg; J2000]
Catalogged Source?: NO
Point Source?: YES
GRB Indicated?: YES [ by BAT flight software ]
Image S/N Ratio: 9.43
Image Trigger?: NO
Rate S/N Ratio: 14.7309198626562 [ if not an image trigger ]
Image S/N Ratio: 9.43
Analysis Position: [ source = BAT ]
RA: 339.976068527769 Dec: -40.1359411791978 [deg; J2000]
Refined Position: [ source = BAT pre-slew burst ]
RA: 339.961059990733 Dec: -40.1464302164674 [deg; J2000]
{ 22h 39m 50.7s , -40d 08' 47.1" }
+/- 1.49604539789256 [arcmin] (estimated 90% radius based on SNR)
+/- 0.624444862624335 [arcmin] (formal 1-sigma fit error)
SNR: 17.1079225864739
Angular difference between the analysis and refined position is 0.932723 arcmin
Partial Coding Fraction: 0.2890625 [ including projection effects ]
Duration
T90: 9.72799998521805 +/- 4.87409476255166
Measured from: -4
to: 5.72799998521805 [s; relative to TRIGTIME]
T50: 2.87999999523163 +/- 0.724077357253429
Measured from: 0.671999990940094
to: 3.55199998617172 [s; relative to TRIGTIME]
Fluence
Peak Flux (peak 1 second)
Measured from: 0.651999980211258
to: 1.65199998021126 [s; relative to TRIGTIME]
Total Fluence
Measured from: -8.67200002074242
to: 6.81599998474121 [s; relative to TRIGTIME]
Band 1 Band 2 Band 3 Band 4
15-25 25-50 50-100 100-350 keV
Total 0.501372 0.600226 0.202319 0.036113
0.041336 0.042711 0.038091 0.036664 [error]
Peak 0.101936 0.110895 0.057007 0.016328
0.011515 0.012305 0.010448 0.009477 [error]
[ fluence units of on-axis counts / fully illuminated detector ]
======================================================================
====== Table of the duration information =============================
Value tstart tstop
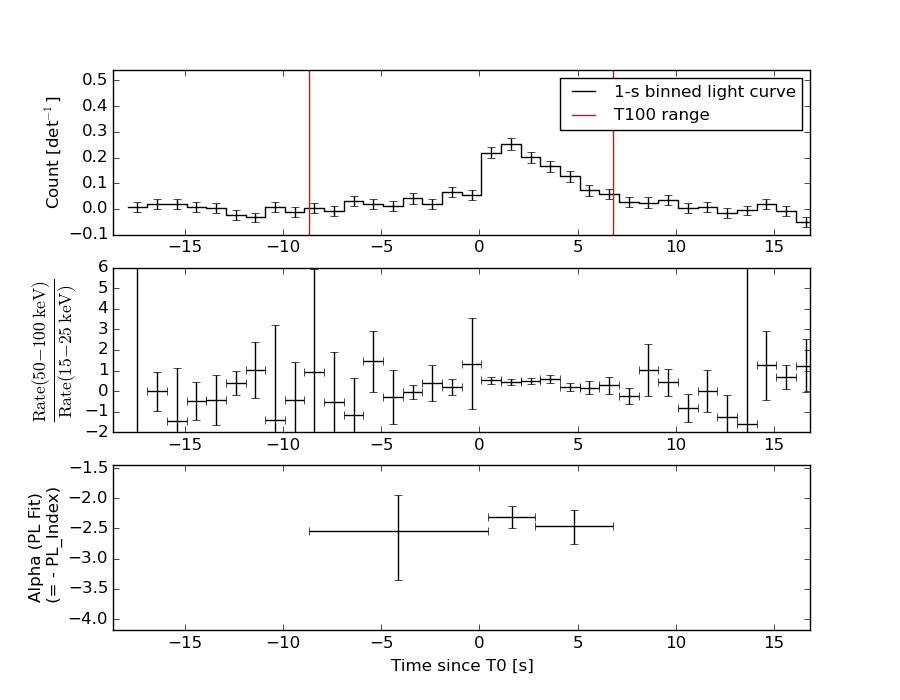
T100 15.488 -8.672 6.816
T90 9.728 -4.000 5.728
T50 2.880 0.672 3.552
Peak 1.000 0.652 1.652
====== Spectral Analysis Summary =====================================
Model : spectral model: simple power-law (PL) and cutoff power-law (CPL)
Ph_index : photon index: E^{Ph_index}
Ph_90err : 90% error of the photon index
Epeak : Epeak in keV
Epeak_90err: 90% error of Epeak
Norm : normalization at 50 keV in both the PL model and CPL model
Nomr_90err : 90% error of the normalization
chi2 : Chi-Squared
dof : degree of freedo
=== Time-averaged spectral analysis ===
(Best model with acceptable fit: PL)
Model Ph_index Ph_90err_low Ph_90err_hi Epeak Epeak_90err_low Epeak_90err_hi Norm Nomr_90err_low Norm_90err_hi chi2 dof
PL -2.426 -0.201 0.188 - - - 5.00e-03 -6.91e-04 6.80e-04 40.960 57
CPL -1.520 -0.661 1.102 20.123 N/A N/A 1.77e-02 N/A N/A 37.360 56
=== 1-s peak spectral analysis ===
(Best model with acceptable fit: PL)
Model Ph_index Ph_90err_low Ph_90err_hi Epeak Epeak_90err_low Epeak_90err_hi Norm Nomr_90err_low Norm_90err_hi chi2 dof
PL -2.204 -0.265 0.241 - - - 1.73e-02 -2.94e-03 2.82e-03 66.670 57
CPL -1.989 N/A N/A 2.467 N/A N/A 2.26e-02 N/A N/A 66.870 56
=== Fluence/Peak Flux Summary ===
Model Band1 Band2 Band3 Band4 Band5 Total
15-25 25-50 50-100 100-350 15-150 15-350 keV
Fluence PL 2.38e-07 2.50e-07 1.86e-07 2.24e-07 7.61e-07 8.99e-07 erg/cm2
90%_error_low -2.92e-08 -2.44e-08 -3.45e-08 -7.10e-08 -8.07e-08 -1.21e-07 erg/cm2
90%_error_hi 2.98e-08 2.42e-08 3.59e-08 9.06e-08 8.24e-08 1.34e-07 erg/cm2
Peak flux PL 1.41e+00 9.38e-01 4.07e-01 2.43e-01 2.87e+00 3.00e+00 ph/cm2/s
90%_error_low -2.51e-01 -1.17e-01 -9.02e-02 -9.01e-02 -3.60e-01 -3.70e-01 ph/cm2/s
90%_error_hi 2.61e-01 1.16e-01 9.09e-02 1.16e-01 3.61e-01 3.70e-01 ph/cm2/s
Fluence CPL N/A N/A N/A N/A N/A N/A erg/cm2
90%_error_low -2.92e-08 -2.44e-08 -3.45e-08 -7.10e-08 -8.07e-08 -1.21e-07 erg/cm2
90%_error_hi 2.98e-08 2.42e-08 3.59e-08 9.06e-08 8.24e-08 1.34e-07 erg/cm2
Peak flux CPL 1.41e+00 9.33e-01 4.07e-01 2.63e-01 2.88e+00 3.01e+00 ph/cm2/s
90%_error_low -2.66e-01 N/A -8.97e-02 -1.09e-01 -3.63e-01 -3.85e-01 ph/cm2/s
90%_error_hi 2.68e-01 N/A 9.12e-02 6.57e-02 3.63e-01 3.86e-01 ph/cm2/s
======================================================================
Image
Pre-slew 15.0-350.0 keV image (Event data)
#   RAcent    DECcent   POSerr    Theta     Phi              Peak Cts       SNR   Name
  339.9611   -40.1464   0.0113    49.2996  -164.5106         1.4683001     17.108 TRIG_00330856

Foreground time interval of the image:
 -8.672   6.816 (delta_t =  15.488 [sec])
Background time interval of the image:
-204.403 -198.624 (delta_t =   5.779 [sec])
-197.904  -8.672 (delta_t = 189.232 [sec])
Light Curves
Note: The mask-weighted lightcurves have units of either count/det or counts/sec/det, where a det is 0.4 x 0.4 = 0.16 sq cm.
Full-time range; 1 s binning
Other quick-look light curves:
- 64 ms binning (zoomed)
- 16 ms binning (zoomed)
- 8 ms binning (zoomed)
- 2 ms binning (zoomed)
- SN=5 or 10 s binning (full-time range)
- Raw light curve
Spectra
- 64 ms binning (zoomed)
- 16 ms binning (zoomed)
- 8 ms binning (zoomed)
- 2 ms binning (zoomed)
- SN=5 or 10 s binning (full-time range)
- Raw light curve
Spectra
Notes:
- 1) The fitting includes the systematic errors.
- 2) When the burst includes telescope slew time periods, the fitting uses an average response file made from multiple 5-s response files through out the slew time plus single time preiod for the non-slew times, and weighted by the total counts in the corresponding time period using addrmf. An average response file is needed becuase a spectral fit using the pre-slew DRM will introduce some errors in both a spectral shape and a normalization if the PHA file contains a lot of the slew/post-slew time interval.
- 3) For fits to more complicated models (e.g. a power-law over a cutoff power-law), the BAT team has decided to require a chi-square improvement of more than 6 for each extra dof.
Time averaged spectrum fit using the average DRM
Power-law model
Time interval is from   -8.672 sec. to    6.816 sec.

Spectral model in power-law:
------------------------------------------------------------
Parameters  : value       lower 90%   higher 90%
Photon index: -2.42622     ( -0.201096   0.187765 )
Norm@50keV  : 5.00489E-03    ( -0.000690974   0.000679807 )
------------------------------------------------------------
#Fit statistic : Chi-Squared =          40.96 using 59 PHA bins.
# Reduced chi-squared =         0.7186 for     57 degrees of freedom
# Null hypothesis probability =   9.460893e-01

Photon flux (15-150 keV)    in 15.49 sec: 0.940561 ( -0.087041  0.087109 ) ph/cm2/s
Energy fluence (15-150 keV)             : 7.61047e-07 ( -8.07141e-08  8.23877e-08 ) ergs/cm2
Cutoff power-law model
Time interval is from   -8.672 sec. to    6.816 sec.
Spectral model in the cutoff power-law:
------------------------------------------------------------
Parameters  : value       lower 90%   higher 90%
Photon index: -1.52043     ( -0.661644   1.10123 )
Epeak [keV] : 20.1229      (   )
Norm@50keV  : 1.77485E-02    (     )
------------------------------------------------------------
#Fit statistic : Chi-Squared =          37.36 using 59 PHA bins.
# Reduced chi-squared =         0.6672 for     56 degrees of freedom
# Null hypothesis probability =   9.738823e-01

Photon flux (15-150 keV)    in 15.49 sec: 0.940592 ( -0.087046  0.086478 ) ph/cm2/s
Energy fluence (15-150 keV)             : 0 ( 0  0 ) ergs/cm2
1-s peak spectrum fit
Power-law model
Time interval is from    0.652 sec. to    1.652 sec.

Spectral model in power-law:
------------------------------------------------------------
Parameters  : value       lower 90%   higher 90%
Photon index: -2.20364     ( -0.265146   0.241434 )
Norm@50keV  : 1.73202E-02    ( -0.00293752   0.00281943 )
------------------------------------------------------------
#Fit statistic : Chi-Squared =          66.67 using 59 PHA bins.
# Reduced chi-squared =          1.170 for     57 degrees of freedom
# Null hypothesis probability =   1.786188e-01

Photon flux (15-150 keV)    in 1 sec: 2.87320 ( -0.36033  0.36087 ) ph/cm2/s
Energy fluence (15-150 keV)             : 1.62963e-07 ( -2.33487e-08  2.37179e-08 ) ergs/cm2
Cutoff power-law model
Time interval is from    0.652 sec. to    1.652 sec.
Spectral model in the cutoff power-law:
------------------------------------------------------------
Parameters  : value       lower 90%   higher 90%
Photon index: -1.98867     (       )
Epeak [keV] : 2.46665      (   )
Norm@50keV  : 2.25585E-02    (     )
------------------------------------------------------------
#Fit statistic : Chi-Squared =          66.87 using 59 PHA bins.
# Reduced chi-squared =          1.194 for     56 degrees of freedom
# Null hypothesis probability =   1.515639e-01

Photon flux (15-150 keV)    in 1 sec: 2.87746 ( -0.3632  0.36341 ) ph/cm2/s
Energy fluence (15-150 keV)             : 0 ( 0  0 ) ergs/cm2
Time-resolved spectra
Distribution
T90 vs. Hardness ratio plot
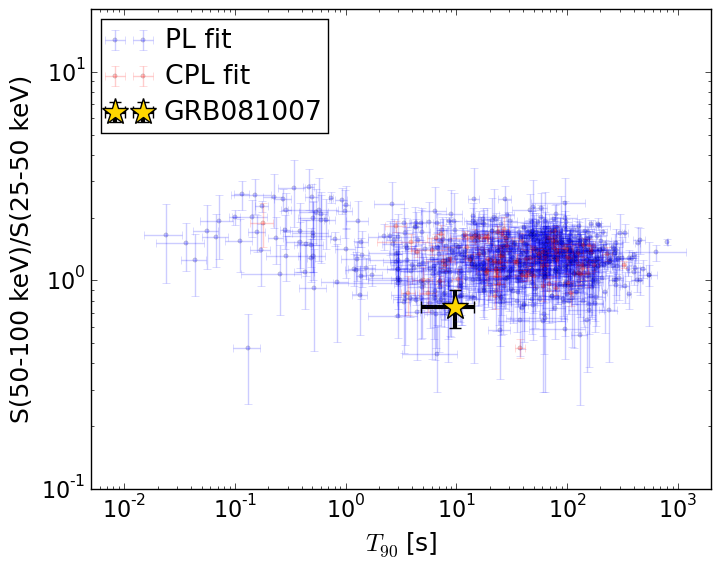
T90                                   = 9.728 sec.
Hardness ratio (energy fluence ratio) = 0.744252119679
S(15-50 keV) vs. S(50-150 keV) plot
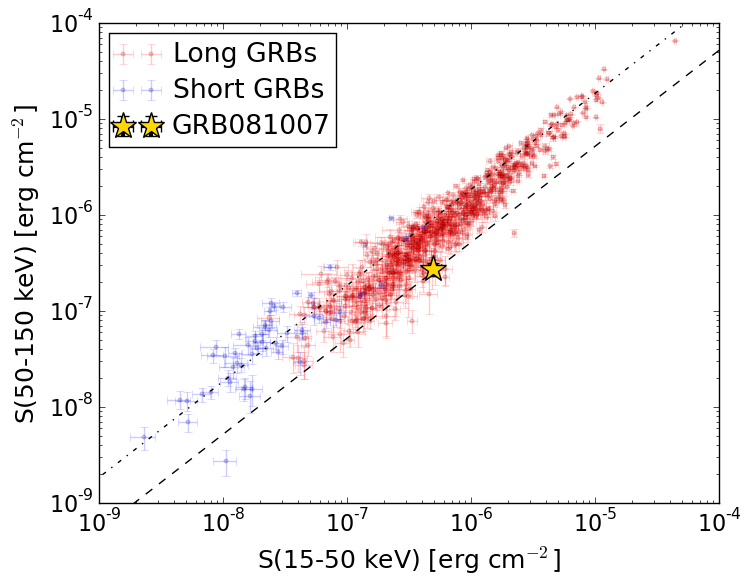
S(15-50 keV)  = 4.886049e-07
S(50-150 keV) = 2.7244289e-07
The dash-dotted line and the dashed line traces the fluences calculated from the Band function with Epeak = 15 and 150 keV, respectively. Both lines assume a canonical values of alpha = -1 and beta = -2.5.
Mask shadow pattern
IMX = -1.120363818542023E+00, IMY = 3.104811782056601E-01
Spacecraft aspect plot
Bright source in the pre-burst/pre-slew/post-slew images
Pre-burst image of 15-350 keV band
Time interval of the image:
-204.403400 -198.624100
-197.904000 -8.672000

# RAcent  DECcent POSerr Theta    Phi  PeakCts   SNR AngSep     Name
#  [deg]    [deg]    ['] [deg]  [deg]                   [']
299.5884  35.1993    1.1  49.6  -41.1   6.9985  10.7    0.2	Cyg X-1
308.2395  41.0346    4.0  46.2  -29.9   0.9518   2.9    7.6	Cyg X-3
326.0271  38.2538    4.5  34.3  -18.4   0.4569   2.6    7.9	Cyg X-2
 25.3825  -0.0702    2.0  40.4  110.3   3.2867   5.7 ------	UNKNOWN
  2.7588  39.6345    2.4  34.3   33.2   0.9805   4.9 ------	UNKNOWN
Pre-slew background subtracted image of 15-350 keV band
Time interval of the image:
-8.672000 6.816000

# RAcent  DECcent POSerr Theta    Phi  PeakCts   SNR AngSep     Name
#  [deg]    [deg]    ['] [deg]  [deg]                   [']
299.5741  35.2181    7.0  49.6  -41.1  -0.2487  -1.6    1.3	Cyg X-1
308.2714  40.9547    5.3  46.1  -30.0  -0.1829  -2.2    7.3	Cyg X-3
326.0207  38.2735    4.8  34.4  -18.4  -0.1136  -2.4    7.7	Cyg X-2
 21.5633 -22.6317    2.2  47.1  142.2   0.8246   5.3 ------	UNKNOWN
 11.8276  -8.1490    2.8  31.0  132.1   0.2286   4.0 ------	UNKNOWN
339.9611 -40.1464    0.7  49.3 -164.5   1.4683  17.1 ------	UNKNOWN
Post-slew image of 15-350 keV band
Time interval of the image:
87.596590 962.124100

# RAcent  DECcent POSerr Theta    Phi  PeakCts   SNR AngSep     Name
#  [deg]    [deg]    ['] [deg]  [deg]                   [']
284.9661 -25.0707   12.0  47.9  -40.7   1.6641   1.0    9.8	HT1900.1-2455
 52.8020 -77.2770    3.3  47.3 -148.1   3.4553   3.5 ------	UNKNOWN