Analysis Summary
Notes:
- 1) No attempt has been made to eliminate the non-significant decimal places.
- 2) This batgrbproduct analysis is done using the HEASARC data.
- 3) This batgrbproduct analysis is using the flight position for the mask-weighting calculation.
======================================================================
BAT GRB EVENT DATA PROCESSING REPORT
Process Script Ver: batgrbproduct v2.46
Process Start Time: Sun Jan 19 22:08:14 EST 2014
Host Name: batevent1
Current Working Dir: /local/data/batevent/batevent_reproc/trigger331093
======================================================================
Trigger: 00331093 Segment: 000
BAT Trigger Time: 245188692.544 [s; MET]
Trigger Stop: 245188694.592 [s; MET]
UTC: 2008-10-08T19:58:09.384500 [includes UTCF correction]
Where From?: TDRSS position message
BAT
RA: 279.987257236876 Dec: -57.4643799585525 [deg; J2000]
Catalogged Source?: NO
Point Source?: YES
GRB Indicated?: YES [ by BAT flight software ]
Image S/N Ratio: 10
Image Trigger?: NO
Rate S/N Ratio: 19.7737199332852 [ if not an image trigger ]
Image S/N Ratio: 10
Analysis Position: [ source = BAT ]
RA: 279.987257236876 Dec: -57.4643799585525 [deg; J2000]
Refined Position: [ source = BAT pre-slew burst ]
RA: 279.96819305153 Dec: -57.4375697162417 [deg; J2000]
{ 18h 39m 52.4s , -57d 26' 15.3" }
+/- 1.00331538982712 [arcmin] (estimated 90% radius based on SNR)
+/- 0.366707801772723 [arcmin] (formal 1-sigma fit error)
SNR: 30.2736541930644
Angular difference between the analysis and refined position is 1.722317 arcmin
Partial Coding Fraction: 0.8125 [ including projection effects ]
Duration
T90: 187.824000030756 +/- 38.2284553731243
Measured from: -43.3720000088215
to: 144.452000021935 [s; relative to TRIGTIME]
T50: 111.108000010252 +/- 1.9575658398699
Measured from: 1.50799998641014
to: 112.615999996662 [s; relative to TRIGTIME]
Fluence
Peak Flux (peak 1 second)
Measured from: 7.52399998903275
to: 8.52399998903275 [s; relative to TRIGTIME]
Total Fluence
Measured from: -65.8880000114441
to: 195.912000000477 [s; relative to TRIGTIME]
Band 1 Band 2 Band 3 Band 4
15-25 25-50 50-100 100-350 keV
Total 2.109706 2.870847 1.815992 0.425950
0.088334 0.085187 0.072912 0.063513 [error]
Peak 0.039011 0.057280 0.056434 0.007094
0.006321 0.006272 0.005615 0.004457 [error]
[ fluence units of on-axis counts / fully illuminated detector ]
======================================================================
====== Table of the duration information =============================
Value tstart tstop
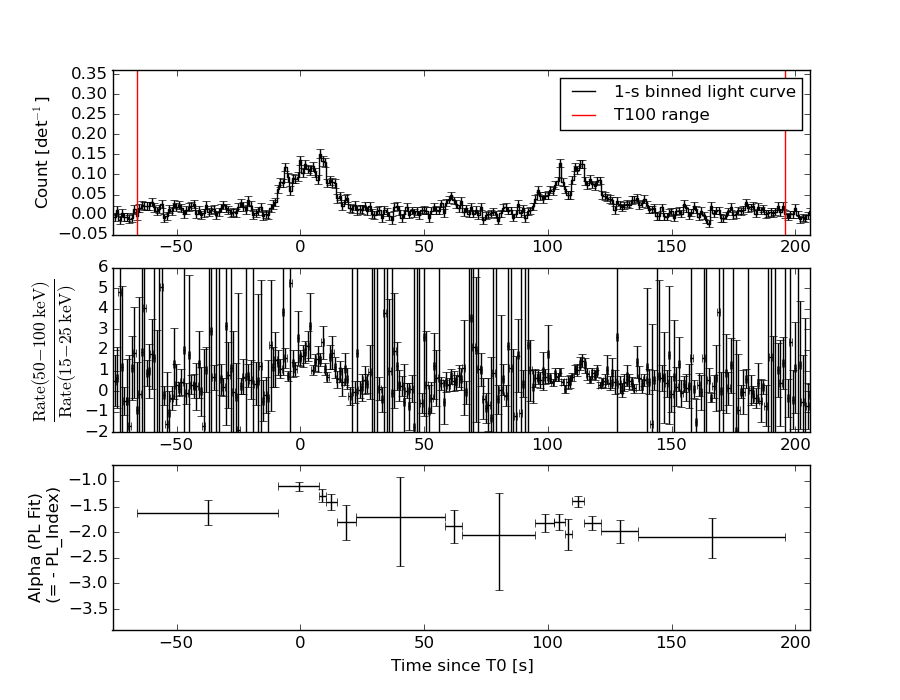
T100 261.800 -65.888 195.912
T90 187.824 -43.372 144.452
T50 111.108 1.508 112.616
Peak 1.000 7.524 8.524
====== Spectral Analysis Summary =====================================
Model : spectral model: simple power-law (PL) and cutoff power-law (CPL)
Ph_index : photon index: E^{Ph_index}
Ph_90err : 90% error of the photon index
Epeak : Epeak in keV
Epeak_90err: 90% error of Epeak
Norm : normalization at 50 keV in both the PL model and CPL model
Nomr_90err : 90% error of the normalization
chi2 : Chi-Squared
dof : degree of freedo
=== Time-averaged spectral analysis ===
(Best model with acceptable fit: PL)
Model Ph_index Ph_90err_low Ph_90err_hi Epeak Epeak_90err_low Epeak_90err_hi Norm Nomr_90err_low Norm_90err_hi chi2 dof
PL -1.623 -0.071 0.071 - - - 1.74e-03 -6.70e-05 6.69e-05 49.250 57
CPL -1.349 -0.274 0.294 118.169 -37.230 1905.991 2.39e-03 -6.24e-04 9.34e-04 46.330 56
=== 1-s peak spectral analysis ===
(Best model with acceptable fit: PL)
Model Ph_index Ph_90err_low Ph_90err_hi Epeak Epeak_90err_low Epeak_90err_hi Norm Nomr_90err_low Norm_90err_hi chi2 dof
PL -1.343 -0.203 0.203 - - - 1.07e-02 -1.22e-03 1.22e-03 54.410 57
CPL -0.989 -0.458 0.844 152.830 -152.830 -152.830 1.58e-02 N/A N/A 53.730 56
=== Fluence/Peak Flux Summary ===
Model Band1 Band2 Band3 Band4 Band5 Total
15-25 25-50 50-100 100-350 15-150 15-350 keV
Fluence PL 6.54e-07 1.11e-06 1.45e-06 3.80e-06 4.25e-06 7.01e-06 erg/cm2
90%_error_low -4.46e-08 -4.48e-08 -7.37e-08 -4.11e-07 -1.74e-07 -4.64e-07 erg/cm2
90%_error_hi 4.56e-08 4.47e-08 7.36e-08 4.45e-07 1.75e-07 4.91e-07 erg/cm2
Peak flux PL 3.79e-01 4.19e-01 3.30e-01 4.29e-01 1.29e+00 1.56e+00 ph/cm2/s
90%_error_low -7.72e-02 -5.36e-02 -4.64e-02 -1.15e-01 -1.49e-01 -1.82e-01 ph/cm2/s
90%_error_hi 8.24e-02 5.29e-02 4.58e-02 1.39e-01 1.50e-01 1.85e-01 ph/cm2/s
Fluence CPL 6.21e-07 1.14e-06 1.46e-06 2.50e-06 4.15e-06 5.72e-06 erg/cm2
90%_error_low -5.43e-08 -5.17e-08 -7.73e-08 -8.13e-07 -2.04e-07 -8.38e-07 erg/cm2
90%_error_hi 5.53e-08 5.24e-08 7.80e-08 1.29e-06 2.03e-07 1.30e-06 erg/cm2
Peak flux CPL 3.50e-01 4.29e-01 3.42e-01 2.96e-01 1.26e+00 1.42e+00 ph/cm2/s
90%_error_low -9.61e-02 -5.81e-02 -5.20e-02 -1.55e-01 -1.57e-01 -2.35e-01 ph/cm2/s
90%_error_hi 9.96e-02 5.97e-02 5.38e-02 1.76e-01 1.57e-01 1.41e-01 ph/cm2/s
======================================================================
Image
Pre-slew 15.0-350.0 keV image (Event data)
#   RAcent    DECcent   POSerr    Theta     Phi              Peak Cts       SNR   Name
  279.9682   -57.4376   0.0063    21.4334   143.6024         3.8264819     30.274 TRIG_00331093

Foreground time interval of the image:
-65.888  31.157 (delta_t =  97.045 [sec])
Background time interval of the image:
-755.343 -657.490 (delta_t =  97.854 [sec])
-239.544 -65.888 (delta_t = 173.656 [sec])
Light Curves
Note: The mask-weighted lightcurves have units of either count/det or counts/sec/det, where a det is 0.4 x 0.4 = 0.16 sq cm.
Full-time range; 1 s binning
Other quick-look light curves:
- 64 ms binning (zoomed)
- 16 ms binning (zoomed)
- 8 ms binning (zoomed)
- 2 ms binning (zoomed)
- SN=5 or 10 s binning (full-time range)
- Raw light curve
Spectra
- 64 ms binning (zoomed)
- 16 ms binning (zoomed)
- 8 ms binning (zoomed)
- 2 ms binning (zoomed)
- SN=5 or 10 s binning (full-time range)
- Raw light curve
Spectra
Notes:
- 1) The fitting includes the systematic errors.
- 2) When the burst includes telescope slew time periods, the fitting uses an average response file made from multiple 5-s response files through out the slew time plus single time preiod for the non-slew times, and weighted by the total counts in the corresponding time period using addrmf. An average response file is needed becuase a spectral fit using the pre-slew DRM will introduce some errors in both a spectral shape and a normalization if the PHA file contains a lot of the slew/post-slew time interval.
- 3) For fits to more complicated models (e.g. a power-law over a cutoff power-law), the BAT team has decided to require a chi-square improvement of more than 6 for each extra dof.
Time averaged spectrum fit using the average DRM
Power-law model
Time interval is from  -65.888 sec. to  195.912 sec.

Spectral model in power-law:
------------------------------------------------------------
Parameters  : value       lower 90%   higher 90%
Photon index: -1.62337     ( -0.0712831   0.0710292 )
Norm@50keV  : 1.74187E-03    ( -6.69985e-05   6.68685e-05 )
------------------------------------------------------------
#Fit statistic : Chi-Squared =          49.25 using 59 PHA bins.
# Reduced chi-squared =         0.8640 for     57 degrees of freedom
# Null hypothesis probability =   7.575742e-01

Photon flux (15-150 keV)    in 261.8 sec: 0.225497 ( -0.008976  0.008998 ) ph/cm2/s
Energy fluence (15-150 keV)             : 4.25373e-06 ( -1.73919e-07  1.74702e-07 ) ergs/cm2
Cutoff power-law model
Time interval is from  -65.888 sec. to  195.912 sec.
Spectral model in the cutoff power-law:
------------------------------------------------------------
Parameters  : value       lower 90%   higher 90%
Photon index: -1.34871     ( -0.274027   0.293756 )
Epeak [keV] : 118.169      ( -37.2308 1905.99 )
Norm@50keV  : 2.38835E-03    ( -0.000623873   0.000934056 )
------------------------------------------------------------
#Fit statistic : Chi-Squared =          46.33 using 59 PHA bins.
# Reduced chi-squared =         0.8273 for     56 degrees of freedom
# Null hypothesis probability =   8.181732e-01

Photon flux (15-150 keV)    in 261.8 sec: 0.221337 ( -0.009836  0.009852 ) ph/cm2/s
Energy fluence (15-150 keV)             : 4.14733e-06 ( -2.03851e-07  2.03374e-07 ) ergs/cm2
1-s peak spectrum fit
Power-law model
Time interval is from    7.524 sec. to    8.524 sec.

Spectral model in power-law:
------------------------------------------------------------
Parameters  : value       lower 90%   higher 90%
Photon index: -1.34307     ( -0.203346   0.202893 )
Norm@50keV  : 1.06988E-02    ( -0.00122181   0.0012194 )
------------------------------------------------------------
#Fit statistic : Chi-Squared =          54.41 using 59 PHA bins.
# Reduced chi-squared =         0.9546 for     57 degrees of freedom
# Null hypothesis probability =   5.727679e-01

Photon flux (15-150 keV)    in 1 sec: 1.28709 ( -0.1493  0.14962 ) ph/cm2/s
Energy fluence (15-150 keV)             : 1.04669e-07 ( -1.3346e-08  1.34909e-08 ) ergs/cm2
Cutoff power-law model
Time interval is from    7.524 sec. to    8.524 sec.
Spectral model in the cutoff power-law:
------------------------------------------------------------
Parameters  : value       lower 90%   higher 90%
Photon index: -0.989291     ( -0.458049   0.843846 )
Epeak [keV] : 152.830      ( -152.828 -152.828 )
Norm@50keV  : 1.57587E-02    (     )
------------------------------------------------------------
#Fit statistic : Chi-Squared =          53.73 using 59 PHA bins.
# Reduced chi-squared =         0.9595 for     56 degrees of freedom
# Null hypothesis probability =   5.612349e-01

Photon flux (15-150 keV)    in 1 sec: 1.26415 ( -0.15686  0.15663 ) ph/cm2/s
Energy fluence (15-150 keV)             : 1.02296e-07 ( -1.43431e-08  1.43393e-08 ) ergs/cm2
Time-resolved spectra
Distribution
T90 vs. Hardness ratio plot
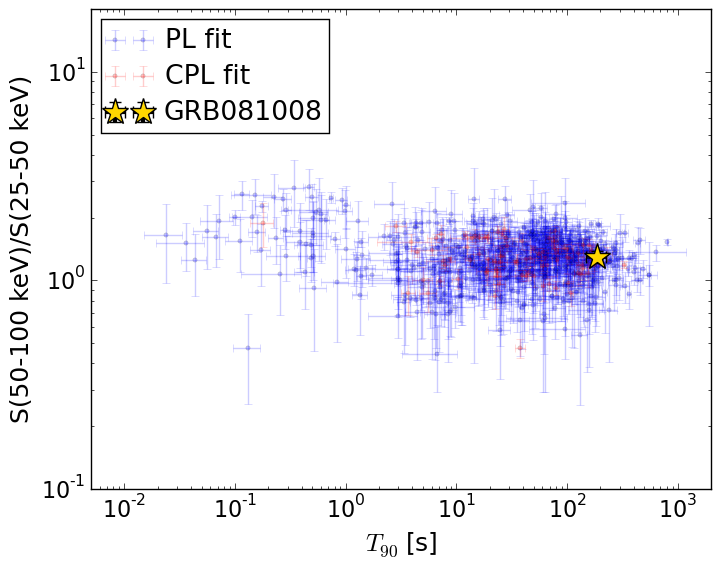
T90                                   = 187.824 sec.
Hardness ratio (energy fluence ratio) = 1.29834454945
S(15-50 keV) vs. S(50-150 keV) plot
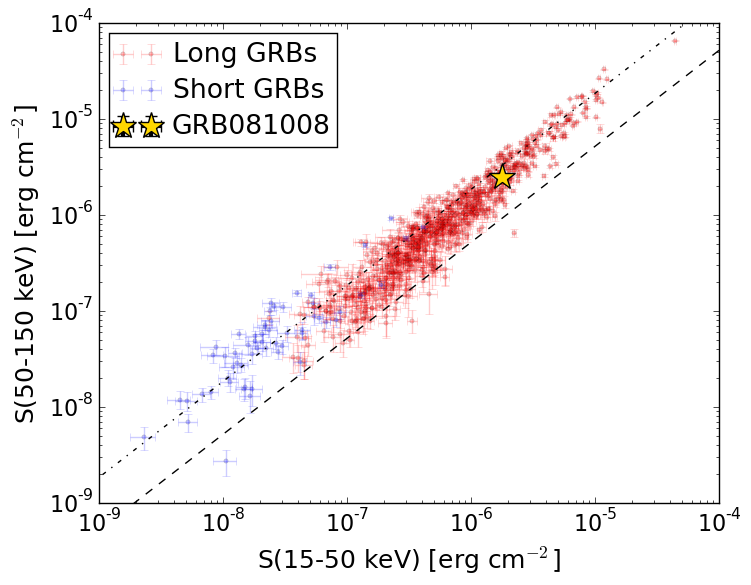
S(15-50 keV)  = 1.7681412e-06
S(50-150 keV) = 2.485612e-06
The dash-dotted line and the dashed line traces the fluences calculated from the Band function with Epeak = 15 and 150 keV, respectively. Both lines assume a canonical values of alpha = -1 and beta = -2.5.
Mask shadow pattern
IMX = -3.159848729512354E-01, IMY = -2.329440581907557E-01
Spacecraft aspect plot
Bright source in the pre-burst/pre-slew/post-slew images
Pre-burst image of 15-350 keV band
Time interval of the image:
-755.343390 -657.489800
-239.544000 -65.888000

# RAcent  DECcent POSerr Theta    Phi  PeakCts   SNR AngSep     Name
#  [deg]    [deg]    ['] [deg]  [deg]                   [']
170.3510 -60.6936    8.6  55.2 -148.9   1.7832   1.3    4.4	Cen X-3
186.6547 -62.8185    3.4  47.2 -149.0   1.5613   3.4    2.9	GX 301-2
244.9681 -15.6470    0.3  27.9  -36.8   8.0932  34.3    0.8	Sco X-1
255.7891 -37.8772   15.6   3.9  -55.3   0.1448   0.7    9.6	4U 1700-377
256.3535 -36.4654    3.5   4.7  -38.8   0.6446   3.3    4.7	GX 349+2
263.0046 -24.7157    7.1  16.0    5.8   0.3064   1.6    1.8	GX 1+4
264.8713 -44.4471   15.1   5.6  131.7   0.1402   0.8    5.5	4U 1735-44
268.3888  -1.4294    2.0  39.9    8.3   1.7836   5.9    1.9	SW J1753.5-0127
270.3367 -25.1308    1.9  17.8   28.1   1.1789   6.0    4.2	GX 5-1
270.3492 -25.7614    4.2  17.2   29.1   0.5394   2.8    2.8	GRS 1758-258
274.0554 -14.0934    5.3  29.3   24.2   0.5064   2.2    4.5	GX 17+2
275.8608 -30.3355    2.5  16.7   52.1   0.9488   4.5    3.8	H1820-303
285.1104 -24.7739    9.1  26.5   55.9  -0.3282  -1.3    9.7	HT1900.1-2455
263.0306 -33.8266    1.6   7.2   18.0   1.4528   7.4    2.1	GX 354-0
266.5530 -32.2155    1.2  10.0   30.8   2.0379   9.6 ------	UNKNOWN
255.1979 -41.6370    1.7   3.5 -116.3   1.2260   6.7 ------	UNKNOWN
226.7241  -3.8793    4.4  47.0  -53.2   2.4941   2.6 ------	UNKNOWN
215.4734 -22.6366    2.5  41.1  -83.5   4.3952   4.6 ------	UNKNOWN
Pre-slew background subtracted image of 15-350 keV band
Time interval of the image:
-65.888000 31.156620

# RAcent  DECcent POSerr Theta    Phi  PeakCts   SNR AngSep     Name
#  [deg]    [deg]    ['] [deg]  [deg]                   [']
170.2942 -60.7450    5.3  55.2 -149.0  -1.1862  -2.2    7.3	Cen X-3
186.5951 -62.9191   16.6  47.2 -149.1   0.1626   0.7    9.1	GX 301-2
244.8286 -15.6417   24.5  27.9  -37.1  -0.0621  -0.5    8.7	Sco X-1
255.9212 -37.8348   14.2   3.9  -53.8   0.0869   0.8    3.1	4U 1700-377
256.2481 -36.4209    6.3   4.8  -39.3  -0.1911  -1.9    9.0	GX 349+2
262.8980 -24.8881  175.4  15.8    5.6   0.0074   0.1   10.5	GX 1+4
264.5339 -44.4359   31.3   5.4  133.4   0.0385   0.4    9.0	4U 1735-44
268.4840  -1.4506  614.6  39.9    8.4  -0.0033  -0.0    7.0	SW J1753.5-0127
270.4383 -25.1271    6.4  17.8   28.3  -0.2107  -1.8    8.9	GX 5-1
270.3454 -25.8034    7.5  17.2   29.2  -0.1806  -1.5    4.3	GRS 1758-258
273.8608 -13.9534    5.3  29.3   23.7   0.2998   2.2    9.8	GX 17+2
275.7508 -30.3439    7.5  16.6   51.9  -0.1779  -1.5    9.1	H1820-303
285.1815 -24.8402    6.2  26.5   56.1   0.2954   1.9    9.3	HT1900.1-2455
262.9148 -33.9810    7.1   7.0   17.7   0.1688   1.6    9.5	GX 354-0
306.6726 -28.7465    2.5  40.0   82.5   2.1223   4.6 ------	UNKNOWN
 15.8339 -79.8626    2.3  54.6  163.3   3.4156   5.1 ------	UNKNOWN
298.7740 -69.2083    3.1  35.3  151.6   0.6374   3.8 ------	UNKNOWN
 23.3104 -83.0223    2.0  53.6  167.3   3.0121   5.9 ------	UNKNOWN
279.9682 -57.4376    0.4  21.4  143.6   3.8262  30.3 ------	UNKNOWN
275.0389 -53.7486    1.9  16.9  141.6   0.6823   6.2 ------	UNKNOWN
217.1420 -54.6138    2.1  31.3 -136.8   0.7388   5.4 ------	UNKNOWN
	UNKNOWN
Post-slew image of 15-350 keV band
Time interval of the image:
75.956590 962.513000

# RAcent  DECcent POSerr Theta    Phi  PeakCts   SNR AngSep     Name
#  [deg]    [deg]    ['] [deg]  [deg]                   [']
170.3137 -60.6238   82.0  49.8 -143.1   0.2027   0.1    0.1	Cen X-3
186.6047 -62.7380    1.8  42.7 -138.0   5.9816   6.3    2.4	GX 301-2
244.9676 -15.6290    0.9  49.3  -47.1  26.9011  12.2    1.0	Sco X-1
255.7440 -37.9376    0.0  25.2  -50.0   0.3486   0.7   12.8	4U 1700-377
256.2931 -36.3989    2.9  26.3  -47.3   2.0820   4.0    7.0	GX 349+2
262.9972 -24.8899    9.8  34.8  -28.0   0.6480   1.2    8.7	GX 1+4
264.9549 -44.3296   14.2  16.1  -42.3  -0.3472  -0.8   11.6	4U 1735-44
268.2859  -1.4597   14.1  56.8  -14.4   1.5859   0.8    4.9	SW J1753.5-0127
270.3187 -25.0675    1.4  33.1  -16.5   4.2378   8.1    2.0	GX 5-1
270.3160 -25.7864    3.7  32.4  -16.7   1.5998   3.1    2.7	GRS 1758-258
273.9052 -14.0244    5.7  43.7   -8.9   1.5002   2.0    5.9	GX 17+2
275.9167 -30.3446    2.7  27.3   -8.0   1.9743   4.3    1.4	H1820-303
285.1812 -24.9754   10.2  32.7    8.4   0.6012   1.1    8.6	HT1900.1-2455
262.9727 -33.8359    1.1  26.3  -33.6   4.6075  10.4    0.8	GX 354-0
279.9916 -57.4523    1.4   0.0  106.5   4.2476   8.4 ------	UNKNOWN
278.9050  -5.9766    2.3  51.5   -1.7   5.2591   5.0 ------	UNKNOWN
277.3173 -23.7466    2.2  33.8   -4.7   3.5071   5.3 ------	UNKNOWN
276.4749 -31.5710    2.6  26.0   -7.2   1.9459   4.5 ------	UNKNOWN
266.5416 -32.2277    0.7  26.8  -26.2   7.4664  16.5 ------	UNKNOWN
257.3179 -44.1057    2.3  19.4  -56.7   2.3599   5.1 ------	UNKNOWN
255.1558 -41.6521    1.4  22.3  -56.0   4.3738   8.3 ------	UNKNOWN