Analysis Summary
Notes:
- 1) No attempt has been made to eliminate the non-significant decimal places.
- 2) This batgrbproduct analysis is done using the HEASARC data.
- 3) This batgrbproduct analysis is using the flight position for the mask-weighting calculation.
======================================================================
BAT GRB EVENT DATA PROCESSING REPORT
Process Script Ver: batgrbproduct v2.46
Process Start Time: Wed May 6 17:20:05 EDT 2015
Host Name: bat1
Current Working Dir: /local/data/bat1/alien/Swift_3rdBATcatalog/event/batevent_reproc/trigger331332
======================================================================
Trigger: 00331332 Segment: 000
BAT Trigger Time: 245377733.632 [s; MET]
Trigger Stop: 245377737.728 [s; MET]
UTC: 2008-10-11T00:28:50.466880 [includes UTCF correction]
Where From?: TDRSS position message
BAT
RA: 220.360725648565 Dec: 33.6074738964866 [deg; J2000]
Catalogged Source?: NO
Point Source?: YES
GRB Indicated?: YES [ by BAT flight software ]
Image S/N Ratio: 7.49
Image Trigger?: NO
Rate S/N Ratio: 10.9087121146357 [ if not an image trigger ]
Image S/N Ratio: 7.49
Analysis Position: [ source = BAT ]
RA: 220.360725648565 Dec: 33.6074738964866 [deg; J2000]
Refined Position: [ source = BAT pre-slew burst ]
RA: 220.362510504791 Dec: 33.5613723471907 [deg; J2000]
{ 14h 41m 27.0s , +33d 33' 40.9" }
+/- 2.12885854413827 [arcmin] (estimated 90% radius based on SNR)
+/- 1.05054307268918 [arcmin] (formal 1-sigma fit error)
SNR: 10.3356365748531
Angular difference between the analysis and refined position is 2.767531 arcmin
Partial Coding Fraction: 1.015625 [ including projection effects ]
Duration
T90: 17.0879999995232 +/- 2.81381732604774
Measured from: 1.10400000214577
to: 18.1920000016689 [s; relative to TRIGTIME]
T50: 7.93599998950958 +/- 5.78731302841808
Measured from: 2.64000001549721
to: 10.5760000050068 [s; relative to TRIGTIME]
Fluence
Peak Flux (peak 1 second)
Measured from: 1.08399999141693
to: 2.08399999141693 [s; relative to TRIGTIME]
Total Fluence
Measured from: 0.84799998998642
to: 19.0879999995232 [s; relative to TRIGTIME]
Band 1 Band 2 Band 3 Band 4
15-25 25-50 50-100 100-350 keV
Total 0.095880 0.133727 0.091764 0.006508
0.018658 0.019603 0.017656 0.016202 [error]
Peak 0.012157 0.016679 0.019483 0.000511
0.004454 0.004702 0.004189 0.003970 [error]
[ fluence units of on-axis counts / fully illuminated detector ]
======================================================================
====== Table of the duration information =============================
Value tstart tstop
T100 18.240 0.848 19.088
T90 17.088 1.104 18.192
T50 7.936 2.640 10.576
Peak 1.000 1.084 2.084
====== Spectral Analysis Summary =====================================
Model : spectral model: simple power-law (PL) and cutoff power-law (CPL)
Ph_index : photon index: E^{Ph_index}
Ph_90err : 90% error of the photon index
Epeak : Epeak in keV
Epeak_90err: 90% error of Epeak
Norm : normalization at 50 keV in both the PL model and CPL model
Nomr_90err : 90% error of the normalization
chi2 : Chi-Squared
dof : degree of freedo
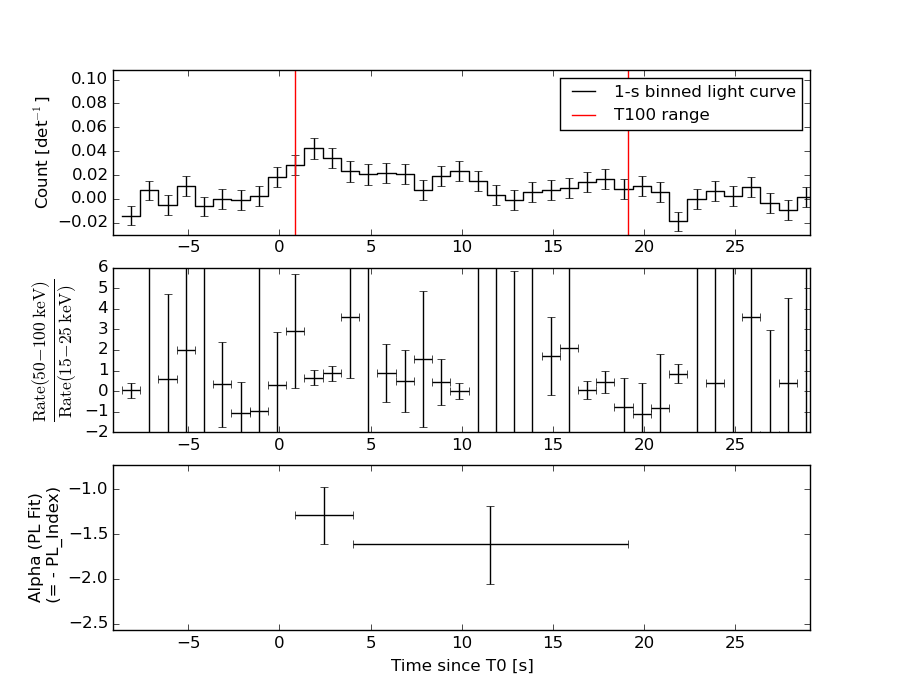
=== Time-averaged spectral analysis ===
(Best model with acceptable fit: PL)
Model Ph_index Ph_90err_low Ph_90err_hi Epeak Epeak_90err_low Epeak_90err_hi Norm Nomr_90err_low Norm_90err_hi chi2 dof
PL -1.498 -0.299 0.292 - - - 1.19e-03 -2.10e-04 2.05e-04 70.450 57
CPL -1.333 -1.421 1.220 186.075 -186.075 -186.075 1.46e-03 -4.80e-04 5.12e-03 70.510 56
=== 1-s peak spectral analysis ===
(Best model with acceptable fit: PL)
Model Ph_index Ph_90err_low Ph_90err_hi Epeak Epeak_90err_low Epeak_90err_hi Norm Nomr_90err_low Norm_90err_hi chi2 dof
PL -1.129 -0.466 0.482 - - - 3.28e-03 -8.60e-04 8.60e-04 59.180 57
CPL -0.383 -1.664 2.901 119.691 -119.691 -119.691 7.22e-03 -7.22e-03 1.12e-01 58.740 56
=== Fluence/Peak Flux Summary ===
Model Band1 Band2 Band3 Band4 Band5 Total
15-25 25-50 50-100 100-350 15-150 15-350 keV
Fluence PL 2.76e-08 5.07e-08 7.19e-08 2.14e-07 2.05e-07 3.64e-07 erg/cm2
90%_error_low -6.99e-09 -8.29e-09 -1.70e-08 -8.97e-08 -4.00e-08 -1.07e-07 erg/cm2
90%_error_hi 7.34e-09 8.24e-09 1.70e-08 1.27e-07 4.12e-08 1.39e-07 erg/cm2
Peak flux PL 9.48e-02 1.19e-01 1.09e-01 1.74e-01 3.82e-01 4.96e-01 ph/cm2/s
90%_error_low -4.37e-02 -3.73e-02 -3.37e-02 -9.14e-02 -1.02e-01 -1.38e-01 ph/cm2/s
90%_error_hi 5.15e-02 3.61e-02 3.29e-02 1.42e-01 1.02e-01 1.50e-01 ph/cm2/s
Fluence CPL 2.75e-08 5.07e-08 7.19e-08 2.13e-07 2.05e-07 3.63e-07 erg/cm2
90%_error_low -7.91e-09 -8.19e-09 -1.71e-08 -1.56e-07 -2.77e-08 -1.95e-07 erg/cm2
90%_error_hi 6.58e-09 1.15e-08 1.74e-08 6.92e-08 3.34e-08 7.11e-08 erg/cm2
Peak flux CPL 7.90e-02 1.24e-01 1.17e-01 8.69e-02 3.69e-01 4.07e-01 ph/cm2/s
90%_error_low -5.51e-02 -4.13e-02 -3.88e-02 -8.69e-02 -1.09e-01 -1.41e-01 ph/cm2/s
90%_error_hi 6.22e-02 4.28e-02 4.21e-02 1.21e-01 1.07e-01 1.79e-01 ph/cm2/s
======================================================================
Image
Pre-slew 15.0-350.0 keV image (Event data)
#   RAcent    DECcent   POSerr    Theta     Phi              Peak Cts       SNR   Name
  220.3625    33.5614   0.0187     7.7433  -132.8796         0.3969034     10.336 TRIG_00331332

Foreground time interval of the image:
  0.848  19.088 (delta_t =  18.240 [sec])
Background time interval of the image:
-147.731   0.848 (delta_t = 148.579 [sec])
Light Curves
Note: The mask-weighted lightcurves have units of either count/det or counts/sec/det, where a det is 0.4 x 0.4 = 0.16 sq cm.
Full-time range; 1 s binning
Other quick-look light curves:
- 64 ms binning (zoomed)
- 16 ms binning (zoomed)
- 8 ms binning (zoomed)
- 2 ms binning (zoomed)
- SN=5 or 10 s binning (full-time range)
- Raw light curve
Spectra
- 64 ms binning (zoomed)
- 16 ms binning (zoomed)
- 8 ms binning (zoomed)
- 2 ms binning (zoomed)
- SN=5 or 10 s binning (full-time range)
- Raw light curve
Spectra
Notes:
- 1) The fitting includes the systematic errors.
- 2) When the burst includes telescope slew time periods, the fitting uses an average response file made from multiple 5-s response files through out the slew time plus single time preiod for the non-slew times, and weighted by the total counts in the corresponding time period using addrmf. An average response file is needed becuase a spectral fit using the pre-slew DRM will introduce some errors in both a spectral shape and a normalization if the PHA file contains a lot of the slew/post-slew time interval.
- 3) For fits to more complicated models (e.g. a power-law over a cutoff power-law), the BAT team has decided to require a chi-square improvement of more than 6 for each extra dof.
Time averaged spectrum fit using the average DRM
Power-law model
Time interval is from    0.848 sec. to   19.088 sec.

Spectral model in power-law:
------------------------------------------------------------
Parameters  : value       lower 90%   higher 90%
Photon index: -1.49753     ( -0.299445   0.291676 )
Norm@50keV  : 1.18604E-03    ( -0.000209614   0.00020488 )
------------------------------------------------------------
#Fit statistic : Chi-Squared =          70.45 using 59 PHA bins.
# Reduced chi-squared =          1.236 for     57 degrees of freedom
# Null hypothesis probability =   1.086410e-01

Photon flux (15-150 keV)    in 18.24 sec: 0.147970 ( -0.023808  0.023813 ) ph/cm2/s
Energy fluence (15-150 keV)             : 2.05331e-07 ( -3.99886e-08  4.11675e-08 ) ergs/cm2
Cutoff power-law model

Time interval is from    0.848 sec. to   19.088 sec.
Spectral model in the cutoff power-law:
------------------------------------------------------------
Parameters  : value       lower 90%   higher 90%
Photon index: -1.47282     ( -1.41034   1.23067 )
Epeak [keV] : 986.132      ( -993.689 -993.689 )
Norm@50keV  : 1.22348E-03    ( -0.000244699   0.00535958 )
------------------------------------------------------------
#Fit statistic : Chi-Squared =          70.45 using 59 PHA bins.
# Reduced chi-squared =          1.258 for     56 degrees of freedom
# Null hypothesis probability =   9.259950e-02

Photon flux (15-150 keV)    in 18.24 sec: 0.147943 ( -0.024928  0.023822 ) ph/cm2/s
Energy fluence (15-150 keV)             : 2.05266e-07 ( -2.7669e-08  3.34467e-08 ) ergs/cm2
1-s peak spectrum fit
Power-law model
Time interval is from    1.084 sec. to    2.084 sec.

Spectral model in power-law:
------------------------------------------------------------
Parameters  : value       lower 90%   higher 90%
Photon index: -1.1293     ( -0.465805   0.481891 )
Norm@50keV  : 3.28364E-03    ( -0.000860125   0.000860124 )
------------------------------------------------------------
#Fit statistic : Chi-Squared =          59.18 using 59 PHA bins.
# Reduced chi-squared =          1.038 for     57 degrees of freedom
# Null hypothesis probability =   3.960246e-01

Photon flux (15-150 keV)    in 1 sec: 0.382036 ( -0.101654  0.102002 ) ph/cm2/s
Energy fluence (15-150 keV)             : 3.40204e-08 ( -9.97843e-09  1.02415e-08 ) ergs/cm2
Cutoff power-law model
Time interval is from    1.084 sec. to    2.084 sec.
Spectral model in the cutoff power-law:
------------------------------------------------------------
Parameters  : value       lower 90%   higher 90%
Photon index: -0.383304     ( -1.66411   2.90079 )
Epeak [keV] : 119.691      ( -119.692 -119.692 )
Norm@50keV  : 7.21849E-03    ( -0.00721852   0.112075 )
------------------------------------------------------------
#Fit statistic : Chi-Squared =          58.74 using 59 PHA bins.
# Reduced chi-squared =          1.049 for     56 degrees of freedom
# Null hypothesis probability =   3.753234e-01

Photon flux (15-150 keV)    in 1 sec: 0.368770 ( -0.108772  0.107437 ) ph/cm2/s
Energy fluence (15-150 keV)             : 3.2499e-08 ( -1.06108e-08  1.0942e-08 ) ergs/cm2
Time-resolved spectra
Distribution
T90 vs. Hardness ratio plot
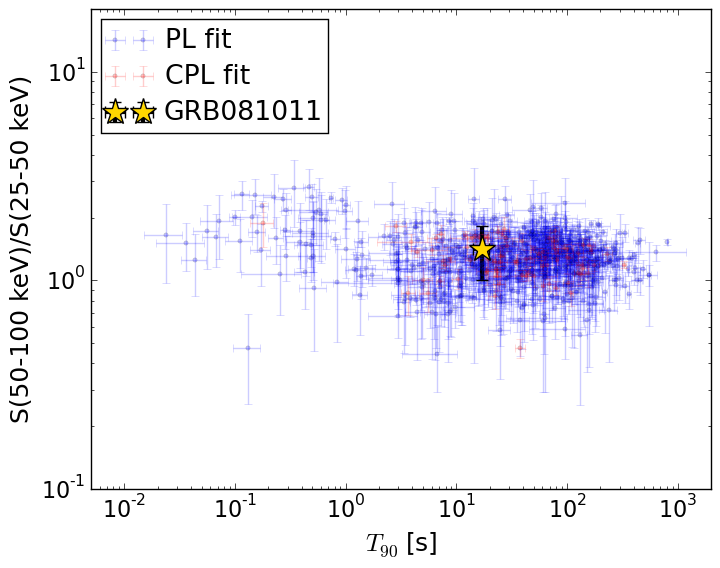
T90                                   = 17.088 sec.
Hardness ratio (energy fluence ratio) = 1.4166745698
S(15-50 keV) vs. S(50-150 keV) plot
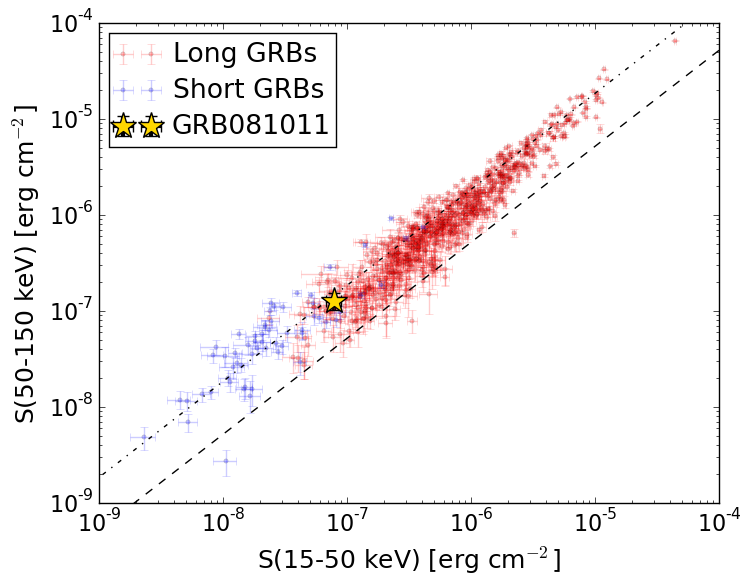
S(15-50 keV)  = 7.827804e-08
S(50-150 keV) = 1.2705716e-07
The dash-dotted line and the dashed line traces the fluences calculated from the Band function with Epeak = 15 and 150 keV, respectively. Both lines assume a canonical values of alpha = -1 and beta = -2.5.
Mask shadow pattern
IMX = -9.252584379668545E-02, IMY = 9.964078974462079E-02
Spacecraft aspect plot
Bright source in the pre-burst/pre-slew/post-slew images
Pre-burst image of 15-350 keV band
Time interval of the image:
-147.731400 0.848000

# RAcent  DECcent POSerr Theta    Phi  PeakCts   SNR AngSep     Name
#  [deg]    [deg]    ['] [deg]  [deg]                   [']
254.5372  35.4109    7.6  30.8  163.8  -0.2252  -1.5    5.7	Her X-1
267.6986  31.1746    2.1  42.5  162.7   1.2569   5.4 ------	UNKNOWN
260.7128   4.6594    2.8  53.9 -163.6   1.4910   4.1 ------	UNKNOWN
216.1872  10.4138    2.4  29.9 -103.7   0.8248   4.8 ------	UNKNOWN
Pre-slew background subtracted image of 15-350 keV band
Time interval of the image:
0.848000 19.088000

# RAcent  DECcent POSerr Theta    Phi  PeakCts   SNR AngSep     Name
#  [deg]    [deg]    ['] [deg]  [deg]                   [']
254.3447  35.4701   12.2  30.6  163.8  -0.0467  -1.0    9.4	Her X-1
255.8568  40.7120    2.4  30.2  153.2   0.2500   4.9 ------	UNKNOWN
145.2535  30.1438    2.2  56.9    0.7   1.2571   5.3 ------	UNKNOWN
255.0211  20.1441    2.4  39.1 -173.5   0.2732   4.9 ------	UNKNOWN
220.3625  33.5614    1.1   7.7 -132.9   0.3970  10.3 ------	UNKNOWN
Post-slew image of 15-350 keV band
Time interval of the image:
76.268590 962.419800

# RAcent  DECcent POSerr Theta    Phi  PeakCts   SNR AngSep     Name
#  [deg]    [deg]    ['] [deg]  [deg]                   [']
244.9754 -15.6348    0.6  54.6 -152.7  36.0096  18.2    0.4	Sco X-1
254.6867  35.3171    0.0  28.2  133.6  -0.3380  -0.7   11.3	Her X-1
245.4124  62.1043    3.6  32.6   78.4   2.4160   3.2 ------	UNKNOWN
272.3667  10.6461    2.7  52.7  160.0   9.2078   4.2 ------	UNKNOWN
257.2819   1.6739    2.9  47.0 -178.3   3.0647   4.1 ------	UNKNOWN
169.1687  12.9542    3.0  50.7  -44.4   9.6967   3.8 ------	UNKNOWN