Analysis Summary
Notes:
- 1) No attempt has been made to eliminate the non-significant decimal places.
- 2) This batgrbproduct analysis is done using the HEASARC data.
- 3) This batgrbproduct analysis is using the flight position for the mask-weighting calculation.
======================================================================
BAT GRB EVENT DATA PROCESSING REPORT
Process Script Ver: batgrbproduct v2.46
Process Start Time: Sun Jan 19 21:46:17 EST 2014
Host Name: batevent1
Current Working Dir: /local/data/batevent/batevent_reproc/trigger331475
======================================================================
Trigger: 00331475 Segment: 000
BAT Trigger Time: 245509827.072 [s; MET]
Trigger Stop: 245509829.12 [s; MET]
UTC: 2008-10-12T13:10:23.902940 [includes UTCF correction]
Where From?: TDRSS position message
BAT
RA: 30.2174055107331 Dec: -17.6414535051542 [deg; J2000]
Catalogged Source?: NO
Point Source?: YES
GRB Indicated?: YES [ by BAT flight software ]
Image S/N Ratio: 7.78
Image Trigger?: NO
Rate S/N Ratio: 17.606816861659 [ if not an image trigger ]
Image S/N Ratio: 7.78
Analysis Position: [ source = BAT ]
RA: 30.2174055107331 Dec: -17.6414535051542 [deg; J2000]
Refined Position: [ source = BAT pre-slew burst ]
RA: 30.1859159943555 Dec: -17.6295771472817 [deg; J2000]
{ 02h 00m 44.6s , -17d 37' 46.5" }
+/- 1.65649603543404 [arcmin] (estimated 90% radius based on SNR)
+/- 0.710847033993027 [arcmin] (formal 1-sigma fit error)
SNR: 14.790717288235
Angular difference between the analysis and refined position is 1.936452 arcmin
Partial Coding Fraction: 0.2617188 [ including projection effects ]
Duration
T90: 28.972000002861 +/- 4.52475237177407
Measured from: -21.0839999914169
to: 7.88800001144409 [s; relative to TRIGTIME]
T50: 9.97200000286102 +/- 6.14550504651901
Measured from: -7.0959999859333
to: 2.87600001692772 [s; relative to TRIGTIME]
Fluence
Peak Flux (peak 1 second)
Measured from: 0.464000016450882
to: 1.46400001645088 [s; relative to TRIGTIME]
Total Fluence
Measured from: -23.4600000083447
to: 9.31999999284744 [s; relative to TRIGTIME]
Band 1 Band 2 Band 3 Band 4
15-25 25-50 50-100 100-350 keV
Total 0.168633 0.535643 0.550150 0.232582
0.050627 0.054299 0.050148 0.043944 [error]
Peak 0.026922 0.042084 0.070951 0.016936
0.009072 0.010147 0.010309 0.008341 [error]
[ fluence units of on-axis counts / fully illuminated detector ]
======================================================================
====== Table of the duration information =============================
Value tstart tstop
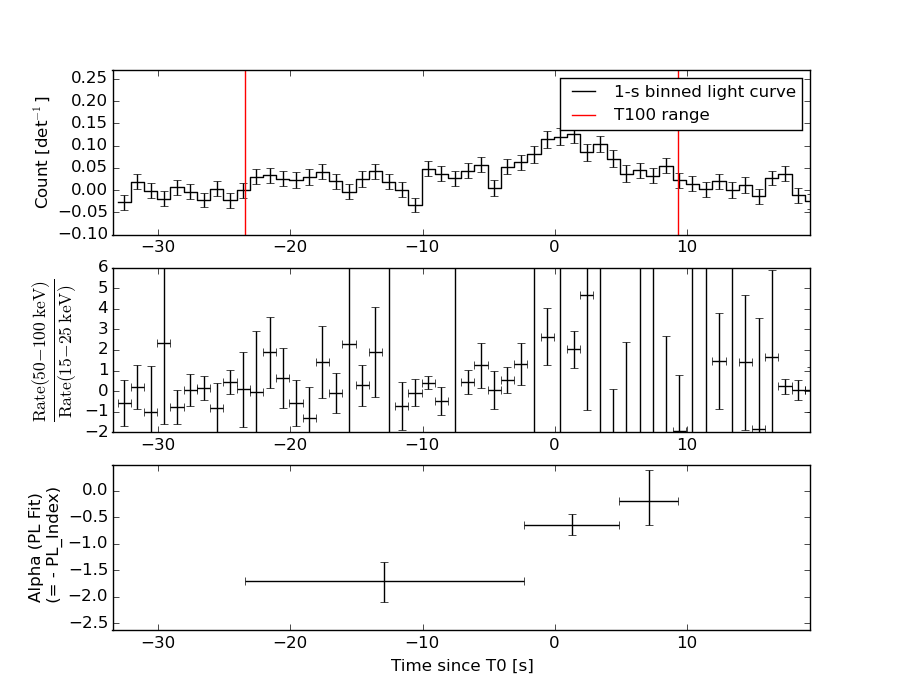
T100 32.780 -23.460 9.320
T90 28.972 -21.084 7.888
T50 9.972 -7.096 2.876
Peak 1.000 0.464 1.464
====== Spectral Analysis Summary =====================================
Model : spectral model: simple power-law (PL) and cutoff power-law (CPL)
Ph_index : photon index: E^{Ph_index}
Ph_90err : 90% error of the photon index
Epeak : Epeak in keV
Epeak_90err: 90% error of Epeak
Norm : normalization at 50 keV in both the PL model and CPL model
Nomr_90err : 90% error of the normalization
chi2 : Chi-Squared
dof : degree of freedo
=== Time-averaged spectral analysis ===
(Best model with acceptable fit: PL)
Model Ph_index Ph_90err_low Ph_90err_hi Epeak Epeak_90err_low Epeak_90err_hi Norm Nomr_90err_low Norm_90err_hi chi2 dof
PL -0.958 -0.180 0.188 - - - 3.12e-03 -3.39e-04 3.36e-04 59.630 57
CPL -0.412 -0.686 0.886 170.655 N/A N/A 5.39e-03 N/A N/A 58.050 56
=== 1-s peak spectral analysis ===
(Best model with acceptable fit: PL)
Model Ph_index Ph_90err_low Ph_90err_hi Epeak Epeak_90err_low Epeak_90err_hi Norm Nomr_90err_low Norm_90err_hi chi2 dof
PL -0.805 -0.330 0.359 - - - 1.04e-02 -2.16e-03 2.11e-03 55.290 57
CPL -0.248 -0.841 2.021 189.456 -189.456 -189.456 1.80e-02 -9.35e-03 9.51e-02 54.860 56
=== Fluence/Peak Flux Summary ===
Model Band1 Band2 Band3 Band4 Band5 Total
15-25 25-50 50-100 100-350 15-150 15-350 keV
Fluence PL 7.89e-08 2.02e-07 4.17e-07 2.18e-06 1.12e-06 2.88e-06 erg/cm2
90%_error_low -1.71e-08 -2.76e-08 -4.64e-08 -5.09e-07 -1.23e-07 -5.35e-07 erg/cm2
90%_error_hi 1.85e-08 2.72e-08 4.61e-08 6.17e-07 1.24e-07 6.28e-07 erg/cm2
Peak flux PL 2.22e-01 3.39e-01 3.88e-01 8.48e-01 1.20e+00 1.80e+00 ph/cm2/s
90%_error_low -8.80e-02 -9.10e-02 -7.68e-02 -3.15e-01 -2.40e-01 -3.79e-01 ph/cm2/s
90%_error_hi 1.04e-01 8.92e-02 7.62e-02 4.25e-01 2.41e-01 4.15e-01 ph/cm2/s
Fluence CPL 6.83e-08 2.09e-07 4.42e-07 1.13e-06 1.10e-06 1.85e-06 erg/cm2
90%_error_low -2.14e-08 -3.01e-08 -5.73e-08 -6.16e-07 -1.32e-07 -6.19e-07 erg/cm2
90%_error_hi 2.30e-08 3.06e-08 5.87e-08 1.23e-06 1.30e-07 1.23e-06 erg/cm2
Peak flux CPL 1.89e-01 3.45e-01 4.15e-01 5.15e-01 1.18e+00 1.46e+00 ph/cm2/s
90%_error_low -1.11e-01 -9.81e-02 -9.74e-02 -5.15e-01 -2.48e-01 -4.59e-01 ph/cm2/s
90%_error_hi 1.27e-01 9.90e-02 1.07e-01 4.48e-01 2.47e-01 5.32e-01 ph/cm2/s
======================================================================
Image
Pre-slew 15.0-350.0 keV image (Event data)
#   RAcent    DECcent   POSerr    Theta     Phi              Peak Cts       SNR   Name
   30.1859   -17.6296   0.0129    33.5823    69.7306         1.6088931     14.791 TRIG_00331475

Foreground time interval of the image:
-23.460   9.320 (delta_t =  32.780 [sec])
Background time interval of the image:
-263.771 -23.460 (delta_t = 240.311 [sec])
Light Curves
Note: The mask-weighted lightcurves have units of either count/det or counts/sec/det, where a det is 0.4 x 0.4 = 0.16 sq cm.
Full-time range; 1 s binning
Other quick-look light curves:
- 64 ms binning (zoomed)
- 16 ms binning (zoomed)
- 8 ms binning (zoomed)
- 2 ms binning (zoomed)
- SN=5 or 10 s binning (full-time range)
- Raw light curve
Spectra
- 64 ms binning (zoomed)
- 16 ms binning (zoomed)
- 8 ms binning (zoomed)
- 2 ms binning (zoomed)
- SN=5 or 10 s binning (full-time range)
- Raw light curve
Spectra
Notes:
- 1) The fitting includes the systematic errors.
- 2) When the burst includes telescope slew time periods, the fitting uses an average response file made from multiple 5-s response files through out the slew time plus single time preiod for the non-slew times, and weighted by the total counts in the corresponding time period using addrmf. An average response file is needed becuase a spectral fit using the pre-slew DRM will introduce some errors in both a spectral shape and a normalization if the PHA file contains a lot of the slew/post-slew time interval.
- 3) For fits to more complicated models (e.g. a power-law over a cutoff power-law), the BAT team has decided to require a chi-square improvement of more than 6 for each extra dof.
Time averaged spectrum fit using the average DRM
Power-law model
Time interval is from  -23.460 sec. to    9.320 sec.

Spectral model in power-law:
------------------------------------------------------------
Parameters  : value       lower 90%   higher 90%
Photon index: -0.957979     ( -0.180399   0.188244 )
Norm@50keV  : 3.12414E-03    ( -0.000339357   0.000336501 )
------------------------------------------------------------
#Fit statistic : Chi-Squared =          59.63 using 59 PHA bins.
# Reduced chi-squared =          1.046 for     57 degrees of freedom
# Null hypothesis probability =   3.800906e-01

Photon flux (15-150 keV)    in 32.78 sec: 0.359022 ( -0.039413  0.039597 ) ph/cm2/s
Energy fluence (15-150 keV)             : 1.12447e-06 ( -1.23115e-07  1.23598e-07 ) ergs/cm2
Cutoff power-law model
Time interval is from  -23.460 sec. to    9.320 sec.
Spectral model in the cutoff power-law:
------------------------------------------------------------
Parameters  : value       lower 90%   higher 90%
Photon index: -0.412156     ( -0.686354   0.885794 )
Epeak [keV] : 170.655      (   )
Norm@50keV  : 5.39144E-03    (     )
------------------------------------------------------------
#Fit statistic : Chi-Squared =          58.05 using 59 PHA bins.
# Reduced chi-squared =          1.037 for     56 degrees of freedom
# Null hypothesis probability =   3.995280e-01

Photon flux (15-150 keV)    in 32.78 sec: 0.350910 ( -0.04098  0.041075 ) ph/cm2/s
Energy fluence (15-150 keV)             : 1.09759e-06 ( -1.32116e-07  1.30274e-07 ) ergs/cm2
1-s peak spectrum fit
Power-law model
Time interval is from    0.464 sec. to    1.464 sec.

Spectral model in power-law:
------------------------------------------------------------
Parameters  : value       lower 90%   higher 90%
Photon index: -0.804901     ( -0.33017   0.35923 )
Norm@50keV  : 1.04434E-02    ( -0.00216126   0.00211217 )
------------------------------------------------------------
#Fit statistic : Chi-Squared =          55.29 using 59 PHA bins.
# Reduced chi-squared =         0.9700 for     57 degrees of freedom
# Null hypothesis probability =   5.393908e-01

Photon flux (15-150 keV)    in 1 sec: 1.20007 ( -0.239532  0.24095 ) ph/cm2/s
Energy fluence (15-150 keV)             : 1.21801e-07 ( -2.47031e-08  2.48415e-08 ) ergs/cm2
Cutoff power-law model
Time interval is from    0.464 sec. to    1.464 sec.
Spectral model in the cutoff power-law:
------------------------------------------------------------
Parameters  : value       lower 90%   higher 90%
Photon index: -0.248227     ( -0.841166   2.02143 )
Epeak [keV] : 189.456      ( -189.47 -189.47 )
Norm@50keV  : 1.79841E-02    ( -0.00935279   0.0950933 )
------------------------------------------------------------
#Fit statistic : Chi-Squared =          54.86 using 59 PHA bins.
# Reduced chi-squared =         0.9797 for     56 degrees of freedom
# Null hypothesis probability =   5.180004e-01

Photon flux (15-150 keV)    in 1 sec: 1.17788 ( -0.248002  0.24728 ) ph/cm2/s
Energy fluence (15-150 keV)             : 1.19391e-07 ( -2.69297e-08  2.58569e-08 ) ergs/cm2
Time-resolved spectra
Distribution
T90 vs. Hardness ratio plot
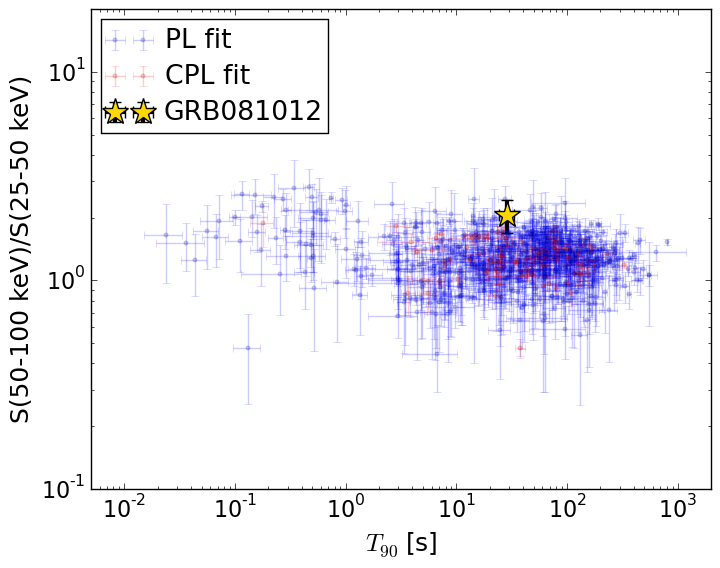
T90                                   = 28.972 sec.
Hardness ratio (energy fluence ratio) = 2.05915873601
S(15-50 keV) vs. S(50-150 keV) plot
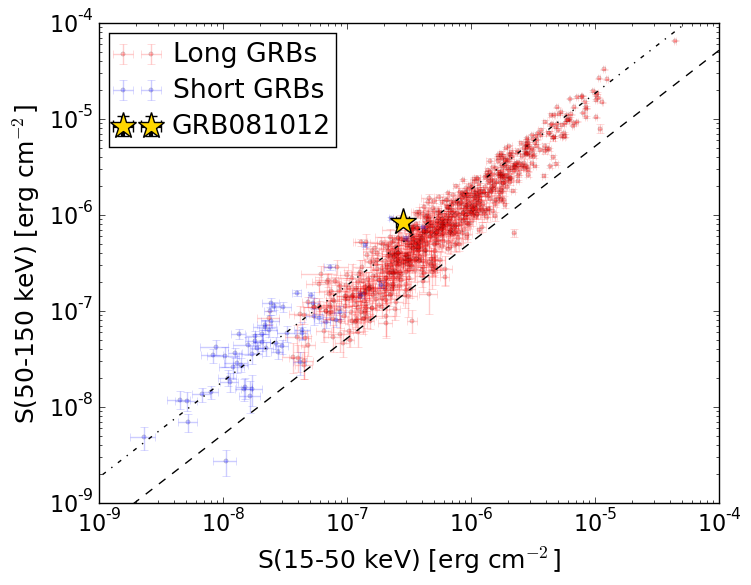
S(15-50 keV)  = 2.8138333e-07
S(50-150 keV) = 8.43102e-07
The dash-dotted line and the dashed line traces the fluences calculated from the Band function with Epeak = 15 and 150 keV, respectively. Both lines assume a canonical values of alpha = -1 and beta = -2.5.
Mask shadow pattern
IMX = 2.300166331368824E-01, IMY = -6.228385430983757E-01
Spacecraft aspect plot
Bright source in the pre-burst/pre-slew/post-slew images
Pre-burst image of 15-350 keV band
Time interval of the image:
-263.771410 -23.460000

# RAcent  DECcent POSerr Theta    Phi  PeakCts   SNR AngSep     Name
#  [deg]    [deg]    ['] [deg]  [deg]                   [']
 59.6711 -27.1443    2.7  10.2  124.5   0.5925   4.3 ------	UNKNOWN
321.6138 -72.5157    3.7  57.5  -26.9   3.2219   3.2 ------	UNKNOWN
Pre-slew background subtracted image of 15-350 keV band
Time interval of the image:
-23.460000 9.320000

# RAcent  DECcent POSerr Theta    Phi  PeakCts   SNR AngSep     Name
#  [deg]    [deg]    ['] [deg]  [deg]                   [']
 30.1859 -17.6296    0.8  33.6   69.7   1.6083  14.8 ------	UNKNOWN
 22.1163 -60.9765    2.2  34.1  -14.3   0.3300   5.3 ------	UNKNOWN
Post-slew image of 15-350 keV band
Time interval of the image:
301.828600 633.628600

# RAcent  DECcent POSerr Theta    Phi  PeakCts   SNR AngSep     Name
#  [deg]    [deg]    ['] [deg]  [deg]                   [']
179.7047  52.6458    3.6  40.6 -172.9   0.9833   3.2 ------	UNKNOWN
212.2769  53.7468    4.0  57.4 -160.1   3.6691   2.9 ------	UNKNOWN
178.2131 -27.6402    3.9  50.7  -44.5   3.1873   3.0 ------	UNKNOWN