Analysis Summary
Notes:
- 1) No attempt has been made to eliminate the non-significant decimal places.
- 2) This batgrbproduct analysis is done using the HEASARC data.
- 3) This batgrbproduct analysis is using the flight position for the mask-weighting calculation.
======================================================================
BAT GRB EVENT DATA PROCESSING REPORT
Process Script Ver: batgrbproduct v2.46
Process Start Time: Sun Jan 19 21:41:27 EST 2014
Host Name: batevent1
Current Working Dir: /local/data/batevent/batevent_reproc/trigger331856
======================================================================
Trigger: 00331856 Segment: 000
BAT Trigger Time: 245879237.696 [s; MET]
Trigger Stop: 245879239.744 [s; MET]
UTC: 2008-10-16T19:47:14.515960 [includes UTCF correction]
Where From?: TDRSS position message
BAT
RA: 14.6151239564649 Dec: -43.5430521619781 [deg; J2000]
Catalogged Source?: NO
Point Source?: YES
GRB Indicated?: YES [ by BAT flight software ]
Image S/N Ratio: 7.48
Image Trigger?: NO
Rate S/N Ratio: 19.6977156035922 [ if not an image trigger ]
Image S/N Ratio: 7.48
Analysis Position: [ source = BAT ]
RA: 14.6151239564649 Dec: -43.5430521619781 [deg; J2000]
Refined Position: [ source = BAT pre-slew burst ]
RA: 14.5889026488615 Dec: -43.5373558434781 [deg; J2000]
{ 00h 58m 21.3s , -43d 32' 14.5" }
+/- 2.25186570369933 [arcmin] (estimated 90% radius based on SNR)
+/- 0.911745631391313 [arcmin] (formal 1-sigma fit error)
SNR: 9.53863556340353
Angular difference between the analysis and refined position is 1.190568 arcmin
Partial Coding Fraction: 0.984375 [ including projection effects ]
Duration
T90: 2.61599999666214 +/- 0.792706748977127
Measured from: 0.23199999332428
to: 2.84799998998642 [s; relative to TRIGTIME]
T50: 1.17200002074242 +/- 0.311589493590561
Measured from: 0.787999987602234
to: 1.96000000834465 [s; relative to TRIGTIME]
Fluence
Peak Flux (peak 1 second)
Measured from: 0.503999978303909
to: 1.50399997830391 [s; relative to TRIGTIME]
Total Fluence
Measured from: -0.0200000107288361
to: 2.95600000023842 [s; relative to TRIGTIME]
Band 1 Band 2 Band 3 Band 4
15-25 25-50 50-100 100-350 keV
Total 0.022154 0.044121 0.049977 0.030735
0.007569 0.008158 0.007336 0.006451 [error]
Peak 0.011400 0.016071 0.029818 0.016023
0.004412 0.004821 0.004412 0.003918 [error]
[ fluence units of on-axis counts / fully illuminated detector ]
======================================================================
====== Table of the duration information =============================
Value tstart tstop
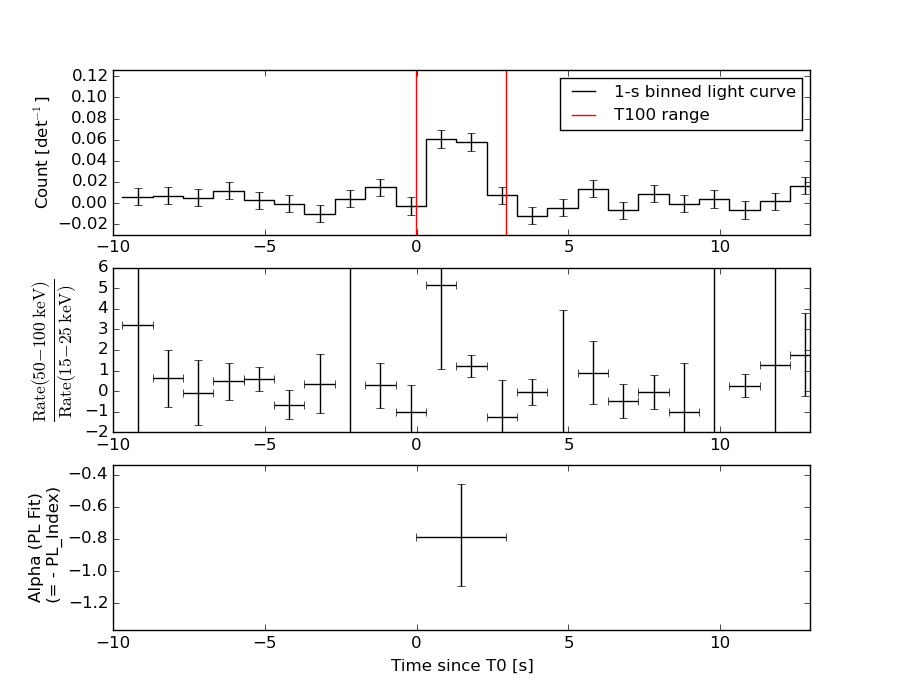
T100 2.976 -0.020 2.956
T90 2.616 0.232 2.848
T50 1.172 0.788 1.960
Peak 1.000 0.504 1.504
====== Spectral Analysis Summary =====================================
Model : spectral model: simple power-law (PL) and cutoff power-law (CPL)
Ph_index : photon index: E^{Ph_index}
Ph_90err : 90% error of the photon index
Epeak : Epeak in keV
Epeak_90err: 90% error of Epeak
Norm : normalization at 50 keV in both the PL model and CPL model
Nomr_90err : 90% error of the normalization
chi2 : Chi-Squared
dof : degree of freedo
=== Time-averaged spectral analysis ===
(Best model with acceptable fit: PL)
Model Ph_index Ph_90err_low Ph_90err_hi Epeak Epeak_90err_low Epeak_90err_hi Norm Nomr_90err_low Norm_90err_hi chi2 dof
PL -0.789 -0.304 0.334 - - - 3.10e-03 -5.55e-04 5.37e-04 44.500 57
CPL -0.708 -0.385 1.068 959.360 -959.360 -959.360 3.36e-03 -7.94e-04 -3.36e-03 44.620 56
=== 1-s peak spectral analysis ===
(Best model with acceptable fit: PL)
Model Ph_index Ph_90err_low Ph_90err_hi Epeak Epeak_90err_low Epeak_90err_hi Norm Nomr_90err_low Norm_90err_hi chi2 dof
PL -0.527 -0.379 0.434 - - - 4.53e-03 -1.09e-03 1.01e-03 41.940 57
CPL -0.421 -0.490 1.323 998.253 -998.253 -998.253 4.96e-03 -1.49e-03 -4.96e-03 42.120 56
=== Fluence/Peak Flux Summary ===
Model Band1 Band2 Band3 Band4 Band5 Total
15-25 25-50 50-100 100-350 15-150 15-350 keV
Fluence PL 6.08e-09 1.73e-08 4.01e-08 2.52e-07 1.08e-07 3.15e-07 erg/cm2
90%_error_low -2.22e-09 -4.06e-09 -6.81e-09 -9.04e-08 -1.85e-08 -9.36e-08 erg/cm2
90%_error_hi 2.56e-09 3.92e-09 6.73e-09 1.28e-07 1.86e-08 1.27e-07 erg/cm2
Peak flux PL 7.41e-02 1.34e-01 1.86e-01 5.37e-01 5.34e-01 9.31e-01 ph/cm2/s
90%_error_low -3.51e-02 -4.34e-02 -3.37e-02 -2.02e-01 -1.05e-01 -2.05e-01 ph/cm2/s
90%_error_hi 4.51e-02 4.33e-02 3.36e-02 2.93e-01 1.06e-01 2.54e-01 ph/cm2/s
Fluence CPL 6.07e-09 1.73e-08 3.93e-08 2.68e-07 1.09e-07 3.12e-07 erg/cm2
90%_error_low N/A N/A -8.70e-09 -1.93e-07 -1.95e-08 -1.73e-07 erg/cm2
90%_error_hi N/A N/A 1.20e-08 4.07e-08 1.77e-08 5.56e-08 erg/cm2
Peak flux CPL 7.40e-02 1.35e-01 1.86e-01 5.31e-01 5.42e-01 9.60e-01 ph/cm2/s
90%_error_low N/A N/A N/A N/A N/A -3.98e-01 ph/cm2/s
90%_error_hi N/A N/A N/A N/A N/A 2.50e-01 ph/cm2/s
======================================================================
Image
Pre-slew 15.0-350.0 keV image (Event data)
#   RAcent    DECcent   POSerr    Theta     Phi              Peak Cts       SNR   Name
   14.5889   -43.5374   0.0203    17.2807    13.0352         0.1537437      9.539 TRIG_00331856

Foreground time interval of the image:
 -0.020   2.956 (delta_t =   2.976 [sec])
Background time interval of the image:
-239.696  -0.020 (delta_t = 239.676 [sec])
Light Curves
Note: The mask-weighted lightcurves have units of either count/det or counts/sec/det, where a det is 0.4 x 0.4 = 0.16 sq cm.
Full-time range; 1 s binning
Other quick-look light curves:
- 64 ms binning (zoomed)
- 16 ms binning (zoomed)
- 8 ms binning (zoomed)
- 2 ms binning (zoomed)
- SN=5 or 10 s binning (full-time range)
- Raw light curve
Spectra
- 64 ms binning (zoomed)
- 16 ms binning (zoomed)
- 8 ms binning (zoomed)
- 2 ms binning (zoomed)
- SN=5 or 10 s binning (full-time range)
- Raw light curve
Spectra
Notes:
- 1) The fitting includes the systematic errors.
- 2) When the burst includes telescope slew time periods, the fitting uses an average response file made from multiple 5-s response files through out the slew time plus single time preiod for the non-slew times, and weighted by the total counts in the corresponding time period using addrmf. An average response file is needed becuase a spectral fit using the pre-slew DRM will introduce some errors in both a spectral shape and a normalization if the PHA file contains a lot of the slew/post-slew time interval.
- 3) For fits to more complicated models (e.g. a power-law over a cutoff power-law), the BAT team has decided to require a chi-square improvement of more than 6 for each extra dof.
Time averaged spectrum fit using the average DRM
Power-law model
Time interval is from   -0.020 sec. to    2.956 sec.

Spectral model in power-law:
------------------------------------------------------------
Parameters  : value       lower 90%   higher 90%
Photon index: -0.788878     ( -0.304357   0.333927 )
Norm@50keV  : 3.10088E-03    ( -0.000555197   0.000537287 )
------------------------------------------------------------
#Fit statistic : Chi-Squared =          44.50 using 59 PHA bins.
# Reduced chi-squared =         0.7808 for     57 degrees of freedom
# Null hypothesis probability =   8.858992e-01

Photon flux (15-150 keV)    in 2.976 sec: 0.356536 ( -0.060619  0.061008 ) ph/cm2/s
Energy fluence (15-150 keV)             : 1.08359e-07 ( -1.85324e-08  1.86354e-08 ) ergs/cm2
Cutoff power-law model
Time interval is from   -0.020 sec. to    2.956 sec.
Spectral model in the cutoff power-law:
------------------------------------------------------------
Parameters  : value       lower 90%   higher 90%
Photon index: -0.781617     ( -0.382729   1.07028 )
Epeak [keV] : 1.00000E+04      ( -10000 -10000 )
Norm@50keV  : 3.12305E-03    ( -0.000556881   -0.0031232 )
------------------------------------------------------------
#Fit statistic : Chi-Squared =          44.51 using 59 PHA bins.
# Reduced chi-squared =         0.7949 for     56 degrees of freedom
# Null hypothesis probability =   8.655589e-01

Photon flux (15-150 keV)    in 2.976 sec: 0.358239 (    ) ph/cm2/s
Energy fluence (15-150 keV)             : 1.0918e-07 ( -1.94612e-08  1.77059e-08 ) ergs/cm2
1-s peak spectrum fit
Power-law model

Time interval is from    0.504 sec. to    1.504 sec.

Spectral model in power-law:
------------------------------------------------------------
Parameters  : value       lower 90%   higher 90%
Photon index: -0.52736     ( -0.379199   0.434258 )
Norm@50keV  : 4.52933E-03    ( -0.00108671   0.00100731 )
------------------------------------------------------------
#Fit statistic : Chi-Squared =          41.94 using 59 PHA bins.
# Reduced chi-squared =         0.7357 for     57 degrees of freedom
# Null hypothesis probability =   9.325174e-01

Photon flux (15-150 keV)    in 1 sec: 0.534104 ( -0.105094  0.106327 ) ph/cm2/s
Energy fluence (15-150 keV)             : 6.00247e-08 ( -1.13907e-08  1.14184e-08 ) ergs/cm2
Cutoff power-law model
Time interval is from    0.504 sec. to    1.504 sec.
Spectral model in the cutoff power-law:
------------------------------------------------------------
Parameters  : value       lower 90%   higher 90%
Photon index: -0.516865     ( -0.489563   1.32312 )
Epeak [keV] : 1.00000E+04      ( -10000 -10000 )
Norm@50keV  : 4.56582E-03    ( -0.00109102   -0.00456661 )
------------------------------------------------------------
#Fit statistic : Chi-Squared =          41.95 using 59 PHA bins.
# Reduced chi-squared =         0.7491 for     56 degrees of freedom
# Null hypothesis probability =   9.182996e-01

Photon flux (15-150 keV)    in 1 sec: 0.541876 (    ) ph/cm2/s
Energy fluence (15-150 keV)             : 6.00772e-08 ( -1.47854e-08  1.47036e-08 ) ergs/cm2
Time-resolved spectra
Distribution
T90 vs. Hardness ratio plot
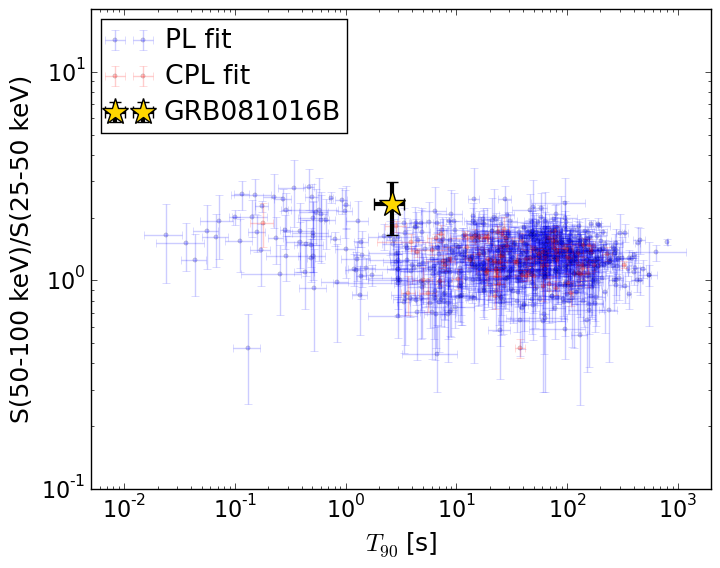
T90                                   = 2.616 sec.
Hardness ratio (energy fluence ratio) = 2.31520693363
S(15-50 keV) vs. S(50-150 keV) plot
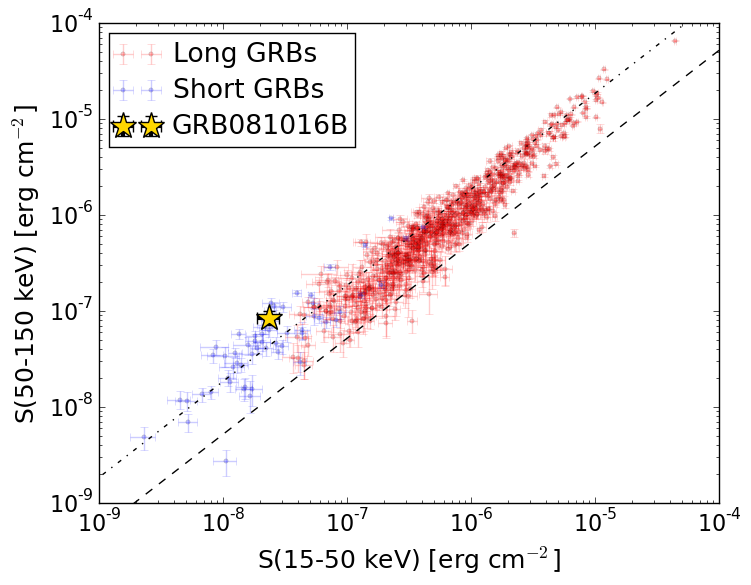
S(15-50 keV)  = 2.341863e-08
S(50-150 keV) = 8.493915e-08
The dash-dotted line and the dashed line traces the fluences calculated from the Band function with Epeak = 15 and 150 keV, respectively. Both lines assume a canonical values of alpha = -1 and beta = -2.5.
Mask shadow pattern
IMX = 3.030787575824515E-01, IMY = -7.016731303969656E-02
Spacecraft aspect plot
Bright source in the pre-burst/pre-slew/post-slew images
Pre-burst image of 15-350 keV band
Time interval of the image:
-239.696000 -0.020000

# RAcent  DECcent POSerr Theta    Phi  PeakCts   SNR AngSep     Name
#  [deg]    [deg]    ['] [deg]  [deg]                   [']
Pre-slew background subtracted image of 15-350 keV band
Time interval of the image:
-0.020000 2.956000

# RAcent  DECcent POSerr Theta    Phi  PeakCts   SNR AngSep     Name
#  [deg]    [deg]    ['] [deg]  [deg]                   [']
  2.4511 -13.6646    2.0  43.1   53.6   0.3689   5.8 ------	UNKNOWN
 52.0033 -11.7026    2.1  34.1  134.5   0.1415   5.4 ------	UNKNOWN
 14.5889 -43.5374    1.2  17.3   13.0   0.1538   9.6 ------	UNKNOWN
Post-slew image of 15-350 keV band
Time interval of the image:
74.604590 286.204610

# RAcent  DECcent POSerr Theta    Phi  PeakCts   SNR AngSep     Name
#  [deg]    [deg]    ['] [deg]  [deg]                   [']
318.7803 -14.6497    2.3  55.4    4.4   3.0664   5.0 ------	UNKNOWN