Analysis Summary
Notes:
- 1) No attempt has been made to eliminate the non-significant decimal places.
- 2) This batgrbproduct analysis is done using the HEASARC data.
- 3) This batgrbproduct analysis is using the flight position for the mask-weighting calculation.
======================================================================
                  BAT GRB EVENT DATA PROCESSING REPORT
    Process Script Ver: batgrbproduct v2.46
    Process Start Time: Sun Jan 19 21:36:29 EST 2014
             Host Name: batevent1
   Current Working Dir: /local/data/batevent/batevent_reproc/trigger331964
======================================================================

  Trigger: 00331964      Segment: 000

  BAT Trigger Time: 245979496   [s; MET]
      Trigger Stop: 245979816   [s; MET]
               UTC: 2008-10-17T23:38:12.816960    [includes UTCF correction]
       Where From?: TDRSS position message

  BAT
    RA: 230.179956090345   Dec: -32.815165184944  [deg; J2000]

     Catalogged Source?: NO
     Point Source?:      YES
     GRB Indicated?:     NO    [ by BAT flight software ]
     Image S/N Ratio:    8.34
     Image Trigger?:     YES
     Rate S/N Ratio:     0  [ if not an image trigger ]
     Image S/N Ratio:    8.34

  Analysis Position:   [ source = BAT ]
    RA: 230.179956090345   Dec: -32.815165184944  [deg; J2000]

  Refined Position:   [ source = BAT pre-slew burst ]
    RA: 230.220914430587   Dec: -32.7839166418828  [deg; J2000]
        { 15h 20m 53.0s , -32d 47' 02.1" }
         +/- 2.31295734090389 [arcmin] (estimated 90% radius based on SNR)
         +/- 1.418653260676 [arcmin] (formal 1-sigma fit error)
    SNR: 9.18076600983296

  Angular difference between the analysis and refined position is 2.789700 arcmin

  Partial Coding Fraction: 0.8046875    [ including projection effects ]

  Duration
     T90: N/A +/- N/A
        Measured from: N/A
                   to: N/A     [s; relative to TRIGTIME]
     T50: N/A +/- N/A
        Measured from: N/A
                   to: N/A     [s; relative to TRIGTIME]

    WARNING: battblocks failed.  Used TDRSS fore/background intervals

======================================================================


====== Table of the duration information =============================

        Value   tstart    tstop
T100     N/A      N/A      N/A
T90      N/A      N/A      N/A
T50      N/A      N/A      N/A
Peak     N/A      N/A      N/A


====== Spectral Analysis Summary =====================================

Model      : spectral model: simple power-law (PL) and cutoff power-law (CPL)
Ph_index   : photon index: E^{Ph_index}
Ph_90err   : 90% error of the photon index
Epeak      : Epeak in keV
Epeak_90err: 90% error of Epeak
Norm       : normalization at 50 keV in both the PL model and CPL model
Nomr_90err : 90% error of the normalization
chi2       : Chi-Squared
dof        : degree of freedo

=== Time-averaged spectral analysis ===
(Best model with acceptable fit: PL)

Model Ph_index Ph_90err_low Ph_90err_hi  Epeak  Epeak_90err_low  Epeak_90err_hi  Norm       Nomr_90err_low    Norm_90err_hi    chi2    dof
PL      -1.627    -0.238      0.234       -           -               -         4.80e-04     -6.54e-05          6.43e-05      40.910   57
CPL     -1.514    -0.352      0.842      201.712    -201.712      -201.712      5.51e-04     -1.36e-04          9.39e-04      40.950   56


=== 1-s peak spectral analysis ===
(Best model with acceptable fit: N/A)

Model Ph_index Ph_90err_low Ph_90err_hi  Epeak  Epeak_90err_low  Epeak_90err_hi  Norm       Nomr_90err_low    Norm_90err_hi    chi2    dof
PL      N/A         N/A       N/A          -           -               -           N/A           N/A               N/A         N/A        N/A
CPL     N/A         N/A       N/A          N/A         N/A           N/A           N/A           N/A               N/A         N/A        N/A


=== Fluence/Peak Flux Summary ===

              Model    Band1     Band2     Band3     Band4     Band5     Total
                       15-25     25-50    50-100    100-350    15-150    15-350    keV
Fluence         PL   2.20e-07  3.74e-07  4.84e-07  1.27e-06  1.43e-06  2.34e-06   erg/cm2
      90%_error_low -4.50e-08 -4.78e-08 -8.92e-08 -4.33e-07 -2.07e-07 -5.18e-07   erg/cm2
      90%_error_hi   4.71e-08  4.75e-08  8.94e-08  5.72e-07  2.11e-07  6.32e-07   erg/cm2
Peak flux       PL     N/A      N/A      N/A      N/A      N/A      N/A     ph/cm2/s
Image
Pre-slew 15.0-350.0 keV image (Event data)
#   RAcent    DECcent   POSerr    Theta     Phi              Peak Cts       SNR   Name
  230.2209   -32.7839   0.0210    22.1224   -50.3668         2.3946705      9.181 TRIG_00331964

Foreground time interval of the image:
  0.000 135.424 (delta_t = 135.424 [sec])
137.000 320.000 (delta_t = 183.000 [sec])
Background time interval of the image:
Light Curves
Note: The mask-weighted lightcurves have units of either count/det or counts/sec/det, where a det is 0.4 x 0.4 = 0.16 sq cm.
Full-time range; 1 s binning
Other quick-look light curves:
- 64 ms binning (zoomed)
- 16 ms binning (zoomed)
- 8 ms binning (zoomed)
- 2 ms binning (zoomed)
- SN=5 or 10 s binning (full-time range)
- Raw light curve
Spectra
- 64 ms binning (zoomed)
- 16 ms binning (zoomed)
- 8 ms binning (zoomed)
- 2 ms binning (zoomed)
- SN=5 or 10 s binning (full-time range)
- Raw light curve
Spectra
Notes:
- 1) The fitting includes the systematic errors.
- 2) When the burst includes telescope slew time periods, the fitting uses an average response file made from multiple 5-s response files through out the slew time plus single time preiod for the non-slew times, and weighted by the total counts in the corresponding time period using addrmf. An average response file is needed becuase a spectral fit using the pre-slew DRM will introduce some errors in both a spectral shape and a normalization if the PHA file contains a lot of the slew/post-slew time interval.
- 3) For fits to more complicated models (e.g. a power-law over a cutoff power-law), the BAT team has decided to require a chi-square improvement of more than 6 for each extra dof.
Time averaged spectrum fit using the average DRM
Power-law model

Multiple GTIs in the spectrum
tstart tstop
0.000000 135.424500
137.000000 320.000000

Spectral model in power-law:
------------------------------------------------------------
Parameters  : value       lower 90%   higher 90%
Photon index: -1.62725     ( -0.238161   0.233976 )
Norm@50keV  : 4.80027E-04    ( -6.54499e-05   6.43279e-05 )
------------------------------------------------------------
#Fit statistic : Chi-Squared =          40.91 using 59 PHA bins.
# Reduced chi-squared =         0.7176 for     57 degrees of freedom
# Null hypothesis probability =   9.467851e-01

Photon flux (15-150 keV)    in 318.4 sec: 6.22200E-02 ( -0.0078881  0.0079046 ) ph/cm2/s
Energy fluence (15-150 keV)             : 1.42509e-06 ( -2.06935e-07  2.11058e-07 ) ergs/cm2
Cutoff power-law model

Multiple GTIs in the spectrum
tstart tstop
0.000000 135.424500
137.000000 320.000000
Spectral model in the cutoff power-law:
------------------------------------------------------------
Parameters  : value       lower 90%   higher 90%
Photon index: -1.62549     ( -0.344061   0.850315 )
Epeak [keV] : 9912.74      ( -9896.49 -9896.49 )
Norm@50keV  : 4.81099E-04    ( -6.58883e-05   0.00100877 )
------------------------------------------------------------
#Fit statistic : Chi-Squared =          40.90 using 59 PHA bins.
# Reduced chi-squared =         0.7304 for     56 degrees of freedom
# Null hypothesis probability =   9.350942e-01

Photon flux (15-150 keV)    in 318.4 sec: 6.21905E-02 ( -0.0080956  0.0078907 ) ph/cm2/s
Energy fluence (15-150 keV)             : 1.42391e-06 ( -2.42086e-07  2.0983e-07 ) ergs/cm2
1-s peak spectrum fit
1-s peak spectrum unavailable, likely because there are no event data in the 1-s peak range.
Time-resolved spectra

Distribution
T90 vs. Hardness ratio plot
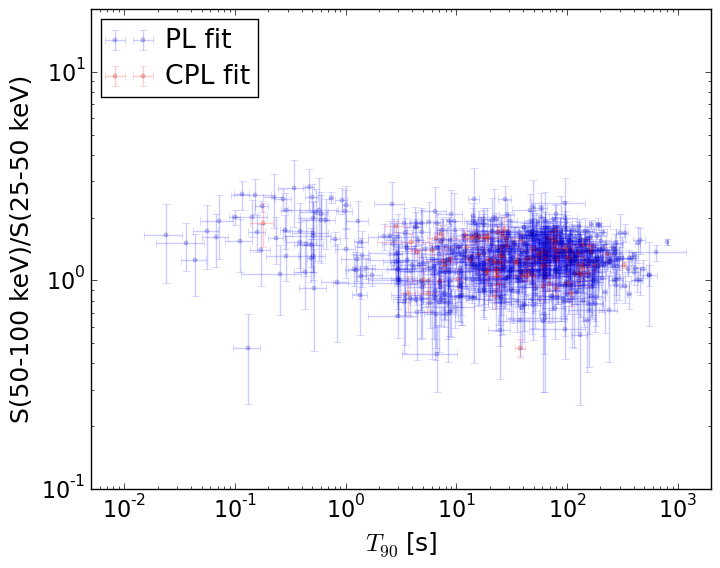
T90                                   = N/A sec.
Hardness ratio (energy fluence ratio) = N/A
S(15-50 keV) vs. S(50-150 keV) plot
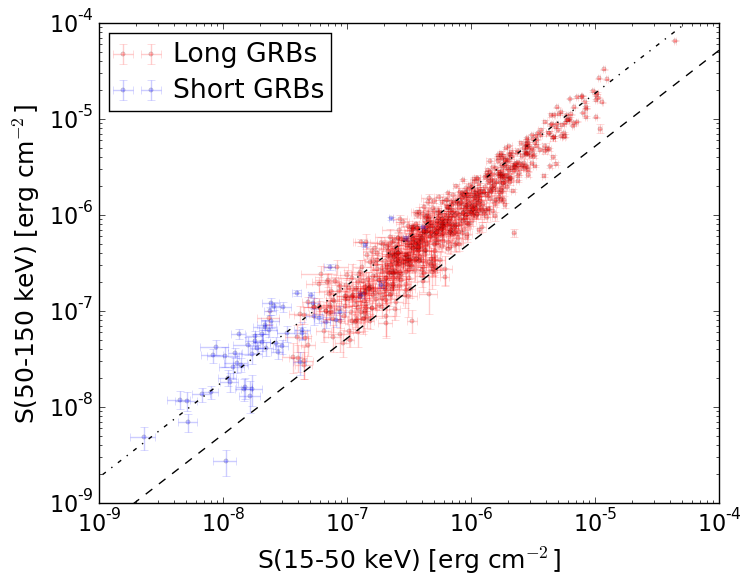
S(15-50 keV)  = N/A
S(50-150 keV) = N/A
The dash-dotted line and the dashed line traces the fluences calculated from the Band function with Epeak = 15 and 150 keV, respectively. Both lines assume a canonical values of alpha = -1 and beta = -2.5.
Mask shadow pattern
IMX = 2.593034808704709E-01, IMY = 3.130741359772135E-01
Spacecraft aspect plot
Bright source in the pre-burst/pre-slew/post-slew images
Pre-burst image of 15-350 keV band
Time interval of the image:
Pre-slew background subtracted image of 15-350 keV band
Time interval of the image:
0.000000 135.424500
137.000000 320.000000

# RAcent  DECcent POSerr Theta    Phi  PeakCts   SNR AngSep     Name
#  [deg]    [deg]    ['] [deg]  [deg]                   [']
170.2005 -60.4988    9.9  35.3 -161.5   0.3716   1.2    8.2	Cen X-3
186.4921 -62.9282   12.1  27.2 -162.6   0.2524   1.0   10.5	GX 301-2
244.9782 -15.6396    0.2  39.0  -22.3  15.8179  47.3    0.1	Sco X-1
255.9819 -37.8453    0.7  20.6   11.2   3.7343  16.4    0.2	4U 1700-377
256.5379 -36.4328    3.8  22.1   10.3   0.7493   3.0    5.0	GX 349+2
262.9671 -24.6901    4.7  35.0    9.0   0.7876   2.4    4.0	GX 1+4
264.8444 -44.6007    8.4  19.9   38.7   0.3675   1.4   10.0	4U 1735-44
270.3428 -25.1333    2.4  37.8   19.3   1.8962   4.8    4.6	GX 5-1
270.3419 -25.7472    4.7  37.3   19.8   0.9494   2.5    2.1	GRS 1758-258
273.9935 -14.0341  915.9  49.2   15.9  -0.0082  -0.0    0.7	GX 17+2
275.8880 -30.3619    4.0  36.3   31.0   1.1113   2.9    1.9	H1820-303
284.9840 -24.8789    5.0  45.5   35.7   1.7865   2.3    3.8	HT1900.1-2455
263.0314 -33.8069    3.3  27.1   17.8   0.9175   3.5    2.7	GX 354-0
336.5473 -77.8667    2.7  39.2  127.3   2.9531   4.2 ------	UNKNOWN
288.1010 -40.2132    3.0  36.1   54.8   2.0755   3.9 ------	UNKNOWN
266.5762 -32.2531    1.5  30.0   21.2   2.2293   7.5 ------	UNKNOWN
263.2537 -45.2892    2.5  18.6   38.3   1.2144   4.7 ------	UNKNOWN
257.5276 -48.0809    2.7  13.8   38.1   0.9596   4.3 ------	UNKNOWN
230.2209 -32.7839    1.3  22.1  -50.4   2.3949   9.2 ------	UNKNOWN
215.5795 -33.4441    4.6  26.0  -79.3   0.8721   2.5 ------	UNKNOWN
Post-slew image of 15-350 keV band
Time interval of the image:
452.500630 963.101600

# RAcent  DECcent POSerr Theta    Phi  PeakCts   SNR AngSep     Name
#  [deg]    [deg]    ['] [deg]  [deg]                   [']
170.2494 -60.6840   15.4  49.8 -139.7   1.0703   0.8    4.1	Cen X-3
186.4222 -62.9396   11.3  42.7 -134.7  -0.6611  -1.0   12.0	GX 301-2
244.9686 -15.6452    0.7  49.3  -43.5  19.7997  16.0    0.7	Sco X-1
255.9965 -37.8645    1.0  25.1  -45.9   3.7212  11.5    1.3	4U 1700-377
256.5165 -36.5179    3.6  26.0  -43.5   1.0540   3.2    6.9	GX 349+2
263.0494 -24.6850    4.8  34.9  -24.3   0.8904   2.4    4.2	GX 1+4
264.7622 -44.4355   13.0  16.1  -39.4   0.2607   0.9    1.2	4U 1735-44
268.2492  -1.6039    0.0  56.6  -10.9  -1.3846  -1.2   11.5	SW J1753.5-0127
270.2584 -25.0840    2.0  33.1  -13.0   2.1888   5.9    1.4	GX 5-1
270.3126 -25.7843    4.6  32.4  -13.2   0.9058   2.5    2.5	GRS 1758-258
273.9945 -14.0165    4.8  43.6   -5.2   1.4103   2.4    1.4	GX 17+2
275.9455 -30.3110    5.1  27.2   -4.4   0.7703   2.3    3.5	H1820-303
285.1616 -24.8258    3.5  32.8   12.0   1.1587   3.3    8.9	HT1900.1-2455
262.9533 -33.8024    1.6  26.3  -30.1   2.1150   7.1    2.6	GX 354-0
296.9727 -70.5795    3.1  15.0  161.1   1.0310   3.7 ------	UNKNOWN
266.5703 -32.1985    1.2  26.8  -22.5   3.2954   9.8 ------	UNKNOWN
255.1519 -41.6693    1.8  22.3  -52.5   2.0510   6.6 ------	UNKNOWN
150.3102 -72.5379    3.0  45.5 -157.9   2.4291   3.8 ------	UNKNOWN
186.9835 -58.2486    3.1  45.4 -129.3   4.2996   3.7 ------	UNKNOWN
220.8136 -40.4414    3.4  40.8  -88.6   5.3390   3.4 ------	UNKNOWN
213.7570 -45.2666    4.4  41.3  -99.3   4.9061   2.6 ------	UNKNOWN