Analysis Summary
Notes:
- 1) No attempt has been made to eliminate the non-significant decimal places.
- 2) This batgrbproduct analysis is done using the HEASARC data.
- 3) This batgrbproduct analysis is using the flight position for the mask-weighting calculation.
======================================================================
                  BAT GRB EVENT DATA PROCESSING REPORT
    Process Script Ver: batgrbproduct v2.46
    Process Start Time: Thu Sep 11 13:01:22 EDT 2014
             Host Name: batevent1
   Current Working Dir: /local/data/batevent/batevent_reproc/trigger332399
======================================================================

  Trigger: 00332399      Segment: 000

  BAT Trigger Time: 246378232   [s; MET]
      Trigger Stop: 246378296   [s; MET]
               UTC: 2008-10-22T14:23:48.804900    [includes UTCF correction]
       Where From?: TDRSS position message

  BAT
    RA: 226.618689631337   Dec: 12.4160839741371  [deg; J2000]

     Catalogged Source?: NO
     Point Source?:      YES
     GRB Indicated?:     YES    [ by BAT flight software ]
     Image S/N Ratio:    14.84
     Image Trigger?:     YES
     Rate S/N Ratio:     0  [ if not an image trigger ]
     Image S/N Ratio:    14.84

  Analysis Position:   [ source = BAT ]
    RA: 226.618689631337   Dec: 12.4160839741371  [deg; J2000]

  Refined Position:   [ source = BAT pre-slew burst ]
    RA: 226.581519842759   Dec: 12.4092449267054  [deg; J2000]
        { 15h 06m 19.6s , +12d 24' 33.3" }
         +/- 1.40617389679695 [arcmin] (estimated 90% radius based on SNR)
         +/- 0.543495283891171 [arcmin] (formal 1-sigma fit error)
    SNR: 18.6910650488041

  Angular difference between the analysis and refined position is 2.216373 arcmin

  Partial Coding Fraction: 0.6484375    [ including projection effects ]

  Duration
     T90: 157.580000013113 +/- 41.8824727554893
        Measured from: 11.4880000054836
                   to: 169.068000018597     [s; relative to TRIGTIME]
     T50: 59.5679999887943 +/- 8.23259083705847
        Measured from: 39.4040000140667
                   to: 98.972000002861     [s; relative to TRIGTIME]


  Fluence
     Peak Flux  (peak 1 second)
        Measured from: 57.1759999990463
                   to: 58.1759999990463     [s; relative to TRIGTIME]
     Total Fluence
        Measured from: -4.92800000309944
                   to: 213.819999992847     [s; relative to TRIGTIME]

             Band 1     Band 2     Band 3     Band 4
              15-25      25-50     50-100    100-350     keV
 Total     1.288665   1.634069   1.128120   0.318785
           0.085315   0.087420   0.077443   0.068146 [error]
 Peak      0.027263   0.024102   0.020305   0.007837
           0.005889   0.006391   0.005577   0.004784 [error]

     [ fluence units of on-axis counts / fully illuminated detector ]

======================================================================


====== Table of the duration information =============================

        Value   tstart    tstop
T100  218.748   -4.928  213.820
T90   157.580   11.488  169.068
T50    59.568   39.404   98.972
Peak    1.000   57.176   58.176


====== Spectral Analysis Summary =====================================

Model      : spectral model: simple power-law (PL) and cutoff power-law (CPL)
Ph_index   : photon index: E^{Ph_index}
Ph_90err   : 90% error of the photon index
Epeak      : Epeak in keV
Epeak_90err: 90% error of Epeak
Norm       : normalization at 50 keV in both the PL model and CPL model
Nomr_90err : 90% error of the normalization
chi2       : Chi-Squared
dof        : degree of freedo

=== Time-averaged spectral analysis ===
(Best model with acceptable fit: PL)

Model Ph_index Ph_90err_low Ph_90err_hi  Epeak  Epeak_90err_low  Epeak_90err_hi  Norm       Nomr_90err_low    Norm_90err_hi    chi2    dof
PL      -1.615    -0.113      0.112       -           -               -         1.27e-03     -8.18e-05          8.13e-05      47.090   57
CPL     -1.306    -0.362      0.494      108.295     -40.166      -108.295      1.83e-03     -6.18e-04          1.43e-03      45.700   56


=== 1-s peak spectral analysis ===
(Best model with acceptable fit: PL)

Model Ph_index Ph_90err_low Ph_90err_hi  Epeak  Epeak_90err_low  Epeak_90err_hi  Norm       Nomr_90err_low    Norm_90err_hi    chi2    dof
PL      -1.649     -0.492     0.456       -           -               -         4.66e-03     -1.34e-03          1.25e-03      48.390   57
CPL     -1.667     -0.676     0.928     9999.360      N/A           N/A         4.61e-03        N/A               N/A         48.400   56


=== Fluence/Peak Flux Summary ===

              Model    Band1     Band2     Band3     Band4     Band5     Total
                       15-25     25-50    50-100    100-350    15-150    15-350    keV
Fluence         PL   3.94e-07  6.75e-07  8.81e-07  2.33e-06  2.59e-06  4.28e-06   erg/cm2
      90%_error_low -4.04e-08 -4.25e-08 -7.62e-08 -4.04e-07 -1.79e-07 -4.71e-07   erg/cm2
      90%_error_hi   4.16e-08  4.24e-08  7.63e-08  4.60e-07  1.81e-07  5.15e-07   erg/cm2
Peak flux       PL   2.21e-01  2.04e-01  1.30e-01  1.28e-01  6.09e-01  6.83e-01   ph/cm2/s
      90%_error_low -8.26e-02 -4.98e-02 -4.81e-02 -7.43e-02 -1.46e-01 -1.70e-01   ph/cm2/s
      90%_error_hi   8.83e-02  4.94e-02  4.74e-02  1.19e-01  1.46e-01  1.74e-01   ph/cm2/s

Fluence        CPL   3.75e-07  6.96e-07  8.91e-07  1.43e-06  2.51e-06  3.39e-06   erg/cm2
      90%_error_low -4.86e-08 -5.21e-08 -8.00e-08 -6.84e-07 -2.09e-07 -7.16e-07   erg/cm2
      90%_error_hi   4.91e-08  5.34e-08  8.09e-08  1.03e-06  2.09e-07  1.08e-06   erg/cm2
Peak flux      CPL   2.05e-01  1.52e-01  7.82e-02  6.86e-02  4.63e-01  5.03e-01   ph/cm2/s
      90%_error_low     N/A   -7.76e-02 -3.77e-02 -3.41e-02 -2.33e-01 -2.49e-01   ph/cm2/s
      90%_error_hi      N/A    7.36e-02  2.33e-02  2.79e-02  1.07e+00  1.67e-01   ph/cm2/s

======================================================================
Image
Pre-slew 15.0-350.0 keV image (Event data)

#   RAcent    DECcent   POSerr    Theta     Phi              Peak Cts       SNR   Name
  226.5815    12.4092   0.0103    23.1248   -85.8716         4.0107209     18.691 TRIG_00332399

Foreground time interval of the image:
 -4.928 213.820 (delta_t = 218.748 [sec])
Background time interval of the image:
-239.000  -4.928 (delta_t = 234.072 [sec])
Light Curves
Note: The mask-weighted lightcurves have units of either count/det or counts/sec/det, where a det is 0.4 x 0.4 = 0.16 sq cm.
Full-time range; 1 s binning
Other quick-look light curves:
- 64 ms binning (zoomed)
- 16 ms binning (zoomed)
- 8 ms binning (zoomed)
- 2 ms binning (zoomed)
- SN=5 or 10 s binning (full-time range)
- Raw light curve
Spectra
- 64 ms binning (zoomed)
- 16 ms binning (zoomed)
- 8 ms binning (zoomed)
- 2 ms binning (zoomed)
- SN=5 or 10 s binning (full-time range)
- Raw light curve
Spectra
Notes:
- 1) The fitting includes the systematic errors.
- 2) When the burst includes telescope slew time periods, the fitting uses an average response file made from multiple 5-s response files through out the slew time plus single time preiod for the non-slew times, and weighted by the total counts in the corresponding time period using addrmf. An average response file is needed becuase a spectral fit using the pre-slew DRM will introduce some errors in both a spectral shape and a normalization if the PHA file contains a lot of the slew/post-slew time interval.
- 3) For fits to more complicated models (e.g. a power-law over a cutoff power-law), the BAT team has decided to require a chi-square improvement of more than 6 for each extra dof.
Time averaged spectrum fit using the average DRM
Power-law model

Time interval is from   -4.928 sec. to  213.820 sec.

Spectral model in power-law:
------------------------------------------------------------
Parameters  : value       lower 90%   higher 90%
Photon index: -1.61526     ( -0.11299   0.1118 )
Norm@50keV  : 1.26644E-03    ( -8.18131e-05   8.13239e-05 )
------------------------------------------------------------
#Fit statistic : Chi-Squared =          47.09 using 59 PHA bins.
# Reduced chi-squared =         0.8262 for     57 degrees of freedom
# Null hypothesis probability =   8.224058e-01

Photon flux (15-150 keV)    in 218.7 sec: 0.163528 ( -0.010214  0.010228 ) ph/cm2/s
Energy fluence (15-150 keV)             : 2.58595e-06 ( -1.79325e-07  1.80918e-07 ) ergs/cm2
Cutoff power-law model

Time interval is from   -4.928 sec. to  213.820 sec.
Spectral model in the cutoff power-law:
------------------------------------------------------------
Parameters  : value       lower 90%   higher 90%
Photon index: -1.30648     ( -0.361638   0.494011 )
Epeak [keV] : 108.295      ( -40.1689 -108.298 )
Norm@50keV  : 1.82967E-03    ( -0.00061789   0.00142592 )
------------------------------------------------------------
#Fit statistic : Chi-Squared =          45.70 using 59 PHA bins.
# Reduced chi-squared =         0.8161 for     56 degrees of freedom
# Null hypothesis probability =   8.354259e-01

Photon flux (15-150 keV)    in 218.7 sec: 0.160783 ( -0.010981  0.010928 ) ph/cm2/s
Energy fluence (15-150 keV)             : 2.51205e-06 ( -2.08763e-07  2.0876e-07 ) ergs/cm2
1-s peak spectrum fit
Power-law model

Time interval is from   57.176 sec. to   58.176 sec.

Spectral model in power-law:
------------------------------------------------------------
Parameters  : value       lower 90%   higher 90%
Photon index: -1.64854     ( -0.492075   0.456172 )
Norm@50keV  : 4.66442E-03    ( -0.00134078   0.00125408 )
------------------------------------------------------------
#Fit statistic : Chi-Squared =          48.39 using 59 PHA bins.
# Reduced chi-squared =         0.8490 for     57 degrees of freedom
# Null hypothesis probability =   7.844843e-01

Photon flux (15-150 keV)    in 1 sec: 0.608789 ( -0.14645  0.146477 ) ph/cm2/s
Energy fluence (15-150 keV)             : 4.3393e-08 ( -1.27614e-08  1.31905e-08 ) ergs/cm2
Cutoff power-law model

Time interval is from   57.176 sec. to   58.176 sec.
Spectral model in the cutoff power-law:
------------------------------------------------------------
Parameters  : value       lower 90%   higher 90%
Photon index: -2.30456     ( -0.0387897   1.56492 )
Epeak [keV] : 110.504      (   )
Norm@50keV  : 2.11661E-03    (     )
------------------------------------------------------------
#Fit statistic : Chi-Squared =          48.03 using 59 PHA bins.
# Reduced chi-squared =         0.8576 for     56 degrees of freedom
# Null hypothesis probability =   7.668452e-01

Photon flux (15-150 keV)    in 1 sec: 0.463380 ( -0.233356  1.07236 ) ph/cm2/s
Energy fluence (15-150 keV)             : 2.837e-08 ( -1.41598e-08  1.39728e-08 ) ergs/cm2
Time-resolved spectra

Distribution
T90 vs. Hardness ratio plot

T90                                   = 157.58 sec.
Hardness ratio (energy fluence ratio) = 1.30565973611
S(15-50 keV) vs. S(50-150 keV) plot
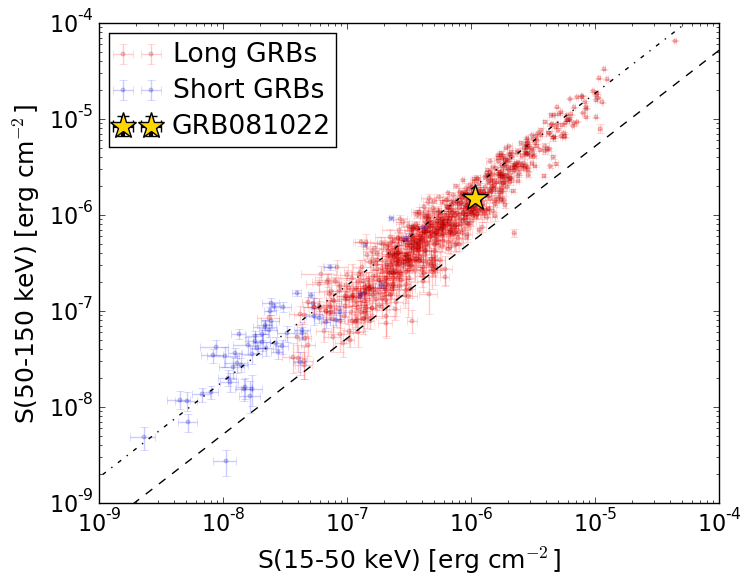
S(15-50 keV)  = 1.0690697e-06
S(50-150 keV) = 1.5168677e-06
The dash-dotted line and the dashed line traces the fluences calculated from the Band function with Epeak = 15 and 150 keV, respectively. Both lines assume a canonical values of alpha = -1 and beta = -2.5.
Mask shadow pattern

IMX = 3.074378814217653E-02, IMY = 4.259403152872967E-01
Spacecraft aspect plot

Bright source in the pre-burst/pre-slew/post-slew images
Pre-burst image of 15-350 keV band
Time interval of the image:
-239.000000 -4.928000

# RAcent  DECcent POSerr Theta    Phi  PeakCts   SNR AngSep     Name
#  [deg]    [deg]    ['] [deg]  [deg]                   [']
254.4365  35.3311    0.8  13.3  137.0   2.4235  14.4    1.2	Her X-1
268.3318  -1.5032    2.7  44.2 -162.5   1.3661   4.3    3.7	SW J1753.5-0127
274.1685 -13.9936    8.1  57.7 -159.1  -1.6262  -1.4    9.8	GX 17+2
288.7442  10.8634   70.3  50.8  166.3  -0.0989  -0.2    5.9	GRS 1915+105
284.7051  21.8525    2.1  42.0  155.7   1.9466   5.4 ------	UNKNOWN
270.6245  11.5894    2.2  36.1 -178.9   1.1152   5.2 ------	UNKNOWN
189.8893  20.0957    3.3  45.1  -30.9   1.0917   3.5 ------	UNKNOWN
Pre-slew background subtracted image of 15-350 keV band
Time interval of the image:
-4.928000 213.820000

# RAcent  DECcent POSerr Theta    Phi  PeakCts   SNR AngSep     Name
#  [deg]    [deg]    ['] [deg]  [deg]                   [']
254.2635  35.3752    9.6  13.2  136.7  -0.2186  -1.2    9.7	Her X-1
268.3361  -1.4648    7.4  44.2 -162.5  -0.5018  -1.5    2.0	SW J1753.5-0127
274.0313 -14.0164    7.7  57.7 -158.9   1.2994   1.5    1.9	GX 17+2
288.9270  10.9295   76.7  50.9  166.1   0.0910   0.1    7.6	GRS 1915+105
175.3205  64.6947    2.5  49.5   32.5   4.0203   4.6 ------	UNKNOWN
171.5065  63.3478    2.1  51.0   30.6   4.9131   5.4 ------	UNKNOWN
278.2835  -7.0579    1.7  54.8 -168.0   3.9482   6.9 ------	UNKNOWN
226.5815  12.4093    0.6  23.1  -85.9   4.0104  18.7 ------	UNKNOWN
191.9718  12.2390    2.4  47.3  -41.8   2.5460   4.8 ------	UNKNOWN
Post-slew image of 15-350 keV band
Time interval of the image:
387.200600 663.150000

# RAcent  DECcent POSerr Theta    Phi  PeakCts   SNR AngSep     Name
#  [deg]    [deg]    ['] [deg]  [deg]                   [']
244.9598 -15.6413    1.6  15.2 -124.5   6.6373   7.2    1.1	Sco X-1
254.3117  35.3435    5.9  40.3    8.7   2.5369   1.9    7.1	Her X-1
256.1691 -37.9051    7.8  32.9 -169.4  -1.4952  -1.5    9.4	4U 1700-377
256.5696 -36.3170    3.9  31.4 -170.0   2.8727   3.0    9.1	GX 349+2
263.1728 -24.8599   76.6  21.1  172.5   0.1356   0.2   11.3	GX 1+4
264.5339 -44.3370    7.0  40.1 -178.6   2.3245   1.7   11.2	4U 1735-44
268.2153  -1.4550    3.7  12.7   85.2   2.9489   3.1    9.2	SW J1753.5-0127
270.4344 -25.0524    4.6  24.4  157.8  -2.5066  -2.5    8.3	GX 5-1
270.2513 -25.7073   11.4  24.8  159.0   1.0471   1.0    3.5	GRS 1758-258
274.1200 -13.8552    0.0  19.9  128.6  -0.5582  -0.5   12.7	GX 17+2
275.8169 -30.5404    9.4  31.7  157.1   1.6433   1.2   11.8	H1820-303
285.0896 -24.9747  236.5  34.3  139.5   0.0824   0.0    4.4	HT1900.1-2455
288.7296  10.9669    5.8  36.3   74.7   5.4057   2.0    4.2	GRS 1915+105
262.9912 -33.8735    5.5  29.6  179.1   2.2347   2.1    2.3	GX 354-0
276.6422 -35.4850    2.8  36.0  161.6   5.8438   4.1 ------	UNKNOWN
245.9007  29.4777    3.3  35.8   -4.3   3.9302   3.5 ------	UNKNOWN
236.0319  47.4988    3.0  55.3   -5.4  11.6016   3.9 ------	UNKNOWN
215.7814 -16.8579    2.9  41.1  -99.2  14.6637   3.9 ------	UNKNOWN