Analysis Summary
Notes:
- 1) No attempt has been made to eliminate the non-significant decimal places.
- 2) This batgrbproduct analysis is done using the HEASARC data.
- 3) This batgrbproduct analysis is using the flight position for the mask-weighting calculation.
==========================================================================
           BAT GROUND-DETECTED GRB DATA PROCESSING REPORT
            (This burst occurred during telescope slew)
    Process Script Ver: batgrbproduct v2.46
    Process Start Time: Tue Nov 11 10:53:32 EST 2014
             Host Name: bat1
   Current Working Dir: /local/data/bat1/alien/Swift_3rdBATcatalog/event/batevent_reproc/GRB081025
======================================================================

  Trigger: 00035650      Segment: 186

  BAT Trigger Time: 246615786.152
               UTC: 2008-10-25T08:23:02.950   [includes UTCF correction]
       Where From?: Ground analysis (best_duration.txt)
  NOTE: BAT trigger time for ground-detected burst during slew is the T100 start time.

  Refined Position:   [ source = BAT mosaic image ]
    RA: 245.296295991584   Dec: 60.4546109105949  [deg; J2000]
        { 16h 21m 11.1s , +60d 27' 16.6" }
        +/- 0.857492708679 [arcmin] (estimated 90% radius based on SNR)
    SNR: 37.8931133745


  Angular difference between the analysis and refined position is Usage: arcmin

  Partial Coding Fraction: Unavailable because the burst occurred during slew.

  Duration
     T90: 22.7600000202656 +/- 1.02964071782397
        Measured from: 1.848
                   to: 24.608     [s; relative to TRIGTIME]
     T50: 16.5399999916553 +/- 0.625664446951632
        Measured from: 4.452
                   to: 20.992     [s; relative to TRIGTIME]


====== Table of the duration information =============================

        Value   tstart    tstop
T100   25.172    0.000   25.172
T90    22.760    1.848   24.608
T50    16.540    4.452   20.992
Peak    1.000    3.340    4.340


====== Spectral Analysis Summary =====================================

Model      : spectral model: simple power-law (PL) and cutoff power-law (CPL)
Ph_index   : photon index: E^{Ph_index}
Ph_90err   : 90% error of the photon index
Epeak      : Epeak in keV
Epeak_90err: 90% error of Epeak
Norm       : normalization at 50 keV in both the PL model and CPL model
Nomr_90err : 90% error of the normalization
chi2       : Chi-Squared
dof        : degree of freedo

=== Time-averaged spectral analysis ===
(Best model with acceptable fit: PL)

Model Ph_index Ph_90err_low Ph_90err_hi  Epeak  Epeak_90err_low  Epeak_90err_hi  Norm       Nomr_90err_low    Norm_90err_hi    chi2    dof
PL      -1.029    -0.075      0.076       -           -               -         6.99e-03     -2.91e-04          2.90e-04      43.240   57
CPL     -0.922    -0.140      0.268      553.740    -334.563      -553.740      7.77e-03     -9.89e-04          2.16e-03      43.310   56


=== 1-s peak spectral analysis ===
(Best model with acceptable fit: PL)

Model Ph_index Ph_90err_low Ph_90err_hi  Epeak  Epeak_90err_low  Epeak_90err_hi  Norm       Nomr_90err_low    Norm_90err_hi    chi2    dof
PL      -0.806     -0.141     0.145       -           -               -         1.84e-02     -1.49e-03          1.48e-03      66.770   57
CPL     -0.805     -0.136     0.179     9999.360    -9999.360      -9999.360      1.85e-02     -1.54e-03          1.07e-02      66.790   56


=== Fluence/Peak Flux Summary ===

              Model    Band1     Band2     Band3     Band4     Band5     Total
                       15-25     25-50    50-100    100-350    15-150    15-350    keV
Fluence         PL   1.45e-07  3.55e-07  6.97e-07  3.38e-06  1.88e-06  4.57e-06   erg/cm2
      90%_error_low -1.27e-08 -1.86e-08 -3.14e-08 -3.49e-07 -8.22e-08 -3.64e-07   erg/cm2
      90%_error_hi   1.32e-08  1.85e-08  3.12e-08  3.79e-07  8.23e-08  3.89e-07   erg/cm2
Peak flux       PL   3.91e-01  5.96e-01  6.82e-01  1.49e+00  2.11e+00  3.16e+00   ph/cm2/s
      90%_error_low -6.62e-02 -6.30e-02 -5.64e-02 -2.60e-01 -1.68e-01 -2.90e-01   ph/cm2/s
      90%_error_hi   7.05e-02  6.21e-02  5.60e-02  2.96e-01  1.68e-01  3.04e-01   ph/cm2/s

Fluence        CPL   1.42e-07  3.57e-07  7.01e-07  3.31e-06  1.88e-06  4.30e-06   erg/cm2
      90%_error_low -1.65e-08 -1.91e-08 -3.50e-08 -1.21e-06 -8.64e-08 -9.58e-07   erg/cm2
      90%_error_hi   1.32e-08  1.94e-08  3.80e-08  2.79e-07  8.32e-08  3.00e-07   erg/cm2
Peak flux      CPL   3.90e-01  5.97e-01  6.80e-01  1.48e+00  2.12e+00  3.22e+00   ph/cm2/s
      90%_error_low     N/A       N/A       N/A       N/A       N/A   -7.44e-01   ph/cm2/s
      90%_error_hi      N/A       N/A       N/A       N/A       N/A    2.87e-01   ph/cm2/s

======================================================================
Image
Note1: The mosaic image is made with timebin = 0.10 s; energybin = 15-350 keV
Note2: The mosaic image uses Galactic coordinate.
#RAcent DECcent POSerr Theta  Phi  Peak_Cts  SNR Name
245.296 60.455 0.002 35.410 -88.420 0.084 37.893 UNKNOWN

Image time interval: 0.000 to 25.172 [sec]
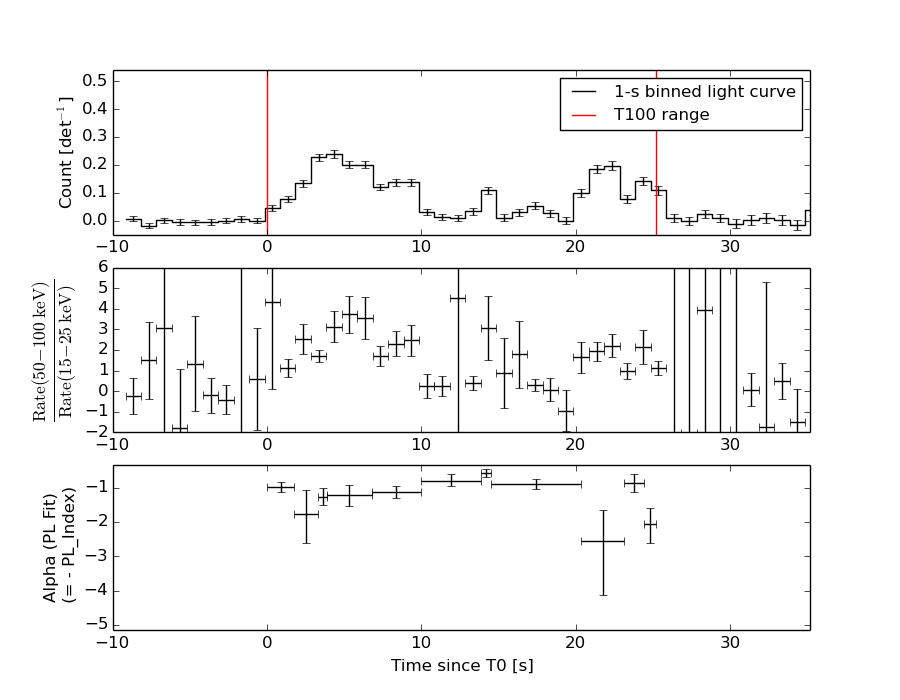
Light Curves
Note: The mask-weighted lightcurves have units of either count/det or counts/sec/det, where a det is 0.4 x 0.4 = 0.16 sq cm.
Best duration plot
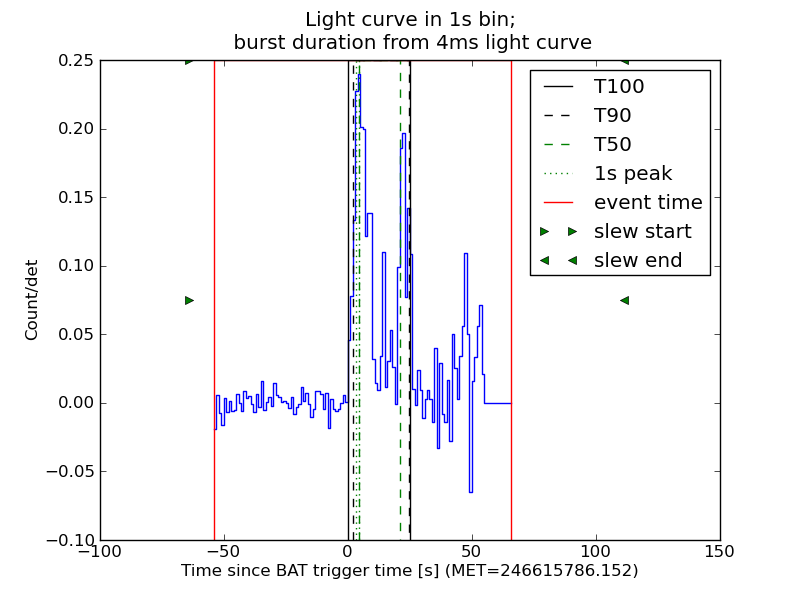
Full-time range; 1 s binning
Other quick-look light curves:
- 64 ms binning (zoomed)
- 16 ms binning (zoomed)
- 8 ms binning (zoomed)
- 2 ms binning (zoomed)
- SN=5 or 10 s binning (full-time range)
- Raw light curve
Spectra
- 64 ms binning (zoomed)
- 16 ms binning (zoomed)
- 8 ms binning (zoomed)
- 2 ms binning (zoomed)
- SN=5 or 10 s binning (full-time range)
- Raw light curve
Spectra
Notes:
- 1) The fitting includes the systematic errors.
- 2) When the burst includes telescope slew time periods, the fitting uses an average response file made from multiple 5-s response files through out the slew time plus single time preiod for the non-slew times, and weighted by the total counts in the corresponding time period using addrmf. An average response file is needed becuase a spectral fit using the pre-slew DRM will introduce some errors in both a spectral shape and a normalization if the PHA file contains a lot of the slew/post-slew time interval.
- 3) For fits to more complicated models (e.g. a power-law over a cutoff power-law), the BAT team has decided to require a chi-square improvement of more than 6 for each extra dof.
Time averaged spectrum fit using the average DRM
Power-law model
Time interval is from    0.000 sec. to   25.172 sec.

Spectral model in power-law:
------------------------------------------------------------
Parameters  : value       lower 90%   higher 90%
Photon index: -1.02904     ( -0.0753727   0.0762856 )
Norm@50keV  : 6.98669E-03    ( -0.000291331   0.000290181 )
------------------------------------------------------------
#Fit statistic : Chi-Squared =          43.24 using 59 PHA bins.
# Reduced chi-squared =         0.7585 for     57 degrees of freedom
# Null hypothesis probability =   9.109330e-01

Photon flux (15-150 keV)    in 25.17 sec: 0.805751 ( -0.034611  0.034711 ) ph/cm2/s
Energy fluence (15-150 keV)             : 1.88262e-06 ( -8.21639e-08  8.23348e-08 ) ergs/cm2
Cutoff power-law model
Time interval is from    0.000 sec. to   25.172 sec.
Spectral model in the cutoff power-law:
------------------------------------------------------------
Parameters  : value       lower 90%   higher 90%
Photon index: -0.921784     ( -0.0996094   0.308765 )
Epeak [keV] : 553.740      ( -715.575 -934.751 )
Norm@50keV  : 7.77335E-03    ( -0.000667132   0.00247731 )
------------------------------------------------------------
#Fit statistic : Chi-Squared =          43.31 using 59 PHA bins.
# Reduced chi-squared =         0.7734 for     56 degrees of freedom
# Null hypothesis probability =   8.924478e-01

Photon flux (15-150 keV)    in 25.17 sec: 0.803044 ( -0.036503  0.034849 ) ph/cm2/s
Energy fluence (15-150 keV)             : 1.87674e-06 ( -8.64464e-08  8.32065e-08 ) ergs/cm2
1-s peak spectrum fit
Power-law model
Time interval is from    3.340 sec. to    4.340 sec.

Spectral model in power-law:
------------------------------------------------------------
Parameters  : value       lower 90%   higher 90%
Photon index: -0.80617     ( -0.140903   0.144925 )
Norm@50keV  : 1.83934E-02    ( -0.00148872   0.0014784 )
------------------------------------------------------------
#Fit statistic : Chi-Squared =          66.77 using 59 PHA bins.
# Reduced chi-squared =          1.171 for     57 degrees of freedom
# Null hypothesis probability =   1.763943e-01

Photon flux (15-150 keV)    in 1 sec: 2.11352 ( -0.16781  0.16808 ) ph/cm2/s
Energy fluence (15-150 keV)             : 2.14408e-07 ( -1.83475e-08  1.84494e-08 ) ergs/cm2
Cutoff power-law model

Time interval is from    3.340 sec. to    4.340 sec.
Spectral model in the cutoff power-law:
------------------------------------------------------------
Parameters  : value       lower 90%   higher 90%
Photon index: -0.805125     ( -0.138285   0.176548 )
Epeak [keV] : 9999.36      ( -9999.36 -9999.36 )
Norm@50keV  : 1.85342E-02    ( -0.00152884   0.0106953 )
------------------------------------------------------------
#Fit statistic : Chi-Squared =          66.79 using 59 PHA bins.
# Reduced chi-squared =          1.193 for     56 degrees of freedom
# Null hypothesis probability =   1.532859e-01

Photon flux (15-150 keV)    in 1 sec: 2.11719 (    ) ph/cm2/s
Energy fluence (15-150 keV)             : 1.33854e-08 ( 0  0 ) ergs/cm2
Time-resolved spectra
Distribution
T90 vs. Hardness ratio plot
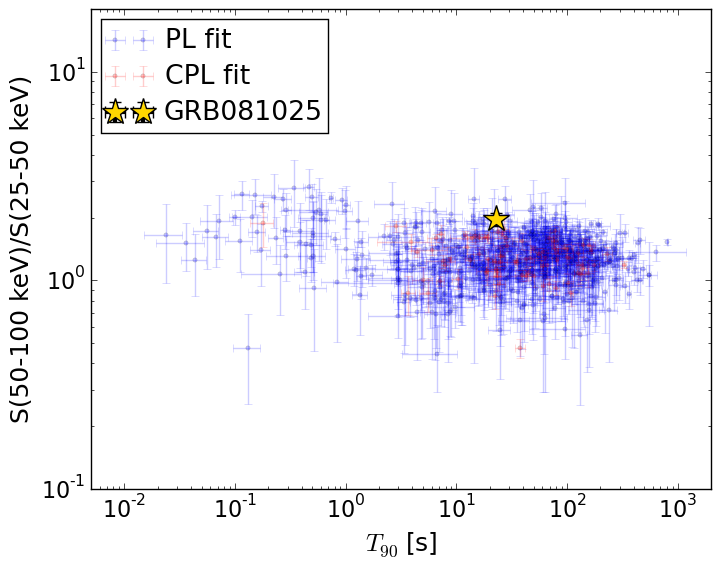
T90                                   = 22.76 sec.
Hardness ratio (energy fluence ratio) = 1.96019887477
S(15-50 keV) vs. S(50-150 keV) plot
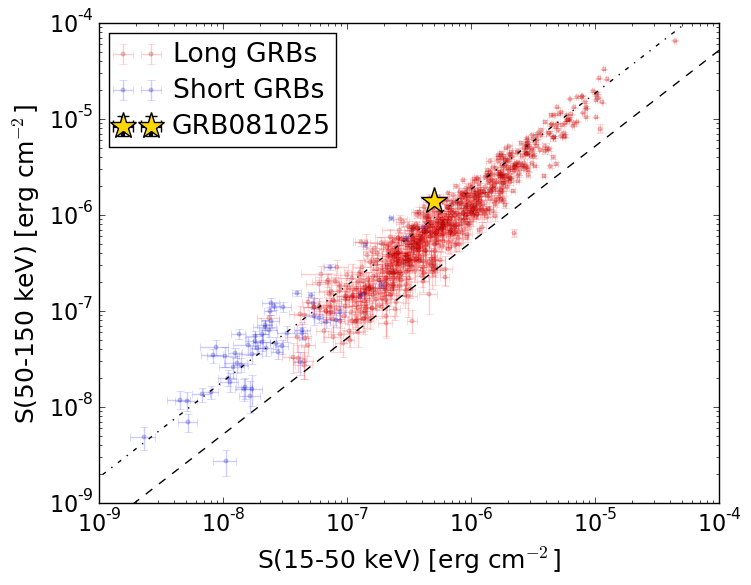
S(15-50 keV)  = 5.000641e-07
S(50-150 keV) = 1.382534e-06
The dash-dotted line and the dashed line traces the fluences calculated from the Band function with Epeak = 15 and 150 keV, respectively. Both lines assume a canonical values of alpha = -1 and beta = -2.5.
Mask shadow pattern
Mask shadow pattern unavailable because this burst occurs during telescope slews.Spacecraft aspect plot