Analysis Summary
Notes:
- 1) No attempt has been made to eliminate the non-significant decimal places.
- 2) This batgrbproduct analysis is done using the HEASARC data.
- 3) This batgrbproduct analysis is using the flight position for the mask-weighting calculation.
======================================================================
                  BAT GRB EVENT DATA PROCESSING REPORT
    Process Script Ver: batgrbproduct v2.46
    Process Start Time: Sun Jan 19 21:18:18 EST 2014
             Host Name: batevent1
   Current Working Dir: /local/data/batevent/batevent_reproc/trigger332851
======================================================================

  Trigger: 00332851      Segment: 000

  BAT Trigger Time: 246846304   [s; MET]
      Trigger Stop: 246846432   [s; MET]
               UTC: 2008-10-28T00:25:00.790760    [includes UTCF correction]
       Where From?: TDRSS position message

  BAT
    RA: 121.890264700736   Dec: 2.31110706505449  [deg; J2000]

     Catalogged Source?: NO
     Point Source?:      YES
     GRB Indicated?:     YES    [ by BAT flight software ]
     Image S/N Ratio:    17.95
     Image Trigger?:     YES
     Rate S/N Ratio:     0  [ if not an image trigger ]
     Image S/N Ratio:    17.95

  Analysis Position:   [ source = BAT ]
    RA: 121.890264700736   Dec: 2.31110706505449  [deg; J2000]

  Refined Position:   [ source = BAT pre-slew burst ]
    RA: 121.889592537456   Dec: 2.30536988059391  [deg; J2000]
        { 08h 07m 33.5s , +02d 18' 19.3" }
         +/- 1.16676468691905 [arcmin] (estimated 90% radius based on SNR)
         +/- 0.637722226404538 [arcmin] (formal 1-sigma fit error)
    SNR: 24.4021439745795

  Angular difference between the analysis and refined position is 0.346582 arcmin

  Partial Coding Fraction: 0.859375    [ including projection effects ]

  Duration
     T90: 284.423999994993 +/- 30.548726983597
        Measured from: 50.6480000019073
                   to: 335.071999996901     [s; relative to TRIGTIME]
     T50: 135.004000008106 +/- 7.69633783266073
        Measured from: 90.1680000126362
                   to: 225.172000020742     [s; relative to TRIGTIME]


  Fluence
     Peak Flux  (peak 1 second)
        Measured from: 73.7240000069141
                   to: 74.7240000069141     [s; relative to TRIGTIME]
     Total Fluence
        Measured from: 29.3440000116825
                   to: 397.087999999523     [s; relative to TRIGTIME]

             Band 1     Band 2     Band 3     Band 4
              15-25      25-50     50-100    100-350     keV
 Total     2.223726   2.802350   1.692750   0.244879
           0.090422   0.094498   0.084349   0.076247 [error]
 Peak      0.018467   0.027558   0.016355   0.005247
           0.005119   0.005287   0.004531   0.004235 [error]

     [ fluence units of on-axis counts / fully illuminated detector ]

======================================================================


====== Table of the duration information =============================

        Value   tstart    tstop
T100  367.744   29.344  397.088
T90   284.424   50.648  335.072
T50   135.004   90.168  225.172
Peak    1.000   73.724   74.724


====== Spectral Analysis Summary =====================================

Model      : spectral model: simple power-law (PL) and cutoff power-law (CPL)
Ph_index   : photon index: E^{Ph_index}
Ph_90err   : 90% error of the photon index
Epeak      : Epeak in keV
Epeak_90err: 90% error of Epeak
Norm       : normalization at 50 keV in both the PL model and CPL model
Nomr_90err : 90% error of the normalization
chi2       : Chi-Squared
dof        : degree of freedo

=== Time-averaged spectral analysis ===
(Best model with acceptable fit: PL)

Model Ph_index Ph_90err_low Ph_90err_hi  Epeak  Epeak_90err_low  Epeak_90err_hi  Norm       Nomr_90err_low    Norm_90err_hi    chi2    dof
PL      -1.774    -0.083      0.082       -           -               -         1.16e-03     -5.46e-05          5.43e-05      42.820   57
CPL     -1.404    -0.317      0.343       75.248     -17.108       142.590      1.82e-03     -5.67e-04          9.17e-04      38.800   56


=== 1-s peak spectral analysis ===
(Best model with acceptable fit: PL)

Model Ph_index Ph_90err_low Ph_90err_hi  Epeak  Epeak_90err_low  Epeak_90err_hi  Norm       Nomr_90err_low    Norm_90err_hi    chi2    dof
PL      -1.639     -0.396     0.373       -           -               -         4.39e-03     -1.06e-03          1.03e-03      39.790   57
CPL     -0.889     -1.320     2.436       68.372     -61.600       -68.372      1.11e-02     -1.11e-02          1.98e-01      39.210   56


=== Fluence/Peak Flux Summary ===

              Model    Band1     Band2     Band3     Band4     Band5     Total
                       15-25     25-50    50-100    100-350    15-150    15-350    keV
Fluence         PL   7.07e-07  1.10e-06  1.29e-06  2.91e-06  3.95e-06  6.00e-06   erg/cm2
      90%_error_low -5.06e-08 -4.77e-08 -8.30e-08 -3.81e-07 -1.90e-07 -4.53e-07   erg/cm2
      90%_error_hi   5.18e-08  4.77e-08  8.33e-08  4.19e-07  1.92e-07  4.83e-07   erg/cm2
Peak flux       PL   2.07e-01  1.91e-01  1.23e-01  1.22e-01  5.71e-01  6.43e-01   ph/cm2/s
      90%_error_low -6.62e-02 -4.16e-02 -3.80e-02 -6.08e-02 -1.22e-01 -1.41e-01   ph/cm2/s
      90%_error_hi   7.10e-02  4.14e-02  3.80e-02  8.92e-02  1.22e-01  1.43e-01   ph/cm2/s

Fluence        CPL   6.68e-07  1.14e-06  1.29e-06  1.61e-06  3.80e-06  4.71e-06   erg/cm2
      90%_error_low -6.01e-08 -5.77e-08 -8.78e-08 -6.02e-07 -2.27e-07 -6.52e-07   erg/cm2
      90%_error_hi   6.09e-08  5.85e-08  8.78e-08  1.04e-06  2.29e-07  1.06e-06   erg/cm2
Peak flux      CPL   1.86e-01  2.07e-01  1.27e-01  5.16e-02  5.55e-01  5.72e-01   ph/cm2/s
      90%_error_low -8.47e-02 -5.38e-02     N/A   -5.16e-02 -1.29e-01 -1.44e-01   ph/cm2/s
      90%_error_hi   8.31e-02  5.83e-02     N/A    9.17e-02  1.28e-01  1.52e-01   ph/cm2/s

======================================================================
Image
Pre-slew 15.0-350.0 keV image (Event data)
#   RAcent    DECcent   POSerr    Theta     Phi              Peak Cts       SNR   Name
  121.8896     2.3054   0.0079    21.2145    25.4649         2.8584905     24.402 TRIG_00332851

Foreground time interval of the image:
 29.344 136.701 (delta_t = 107.357 [sec])
Background time interval of the image:
-322.899 -289.900 (delta_t =  32.999 [sec])
-239.000  29.344 (delta_t = 268.344 [sec])
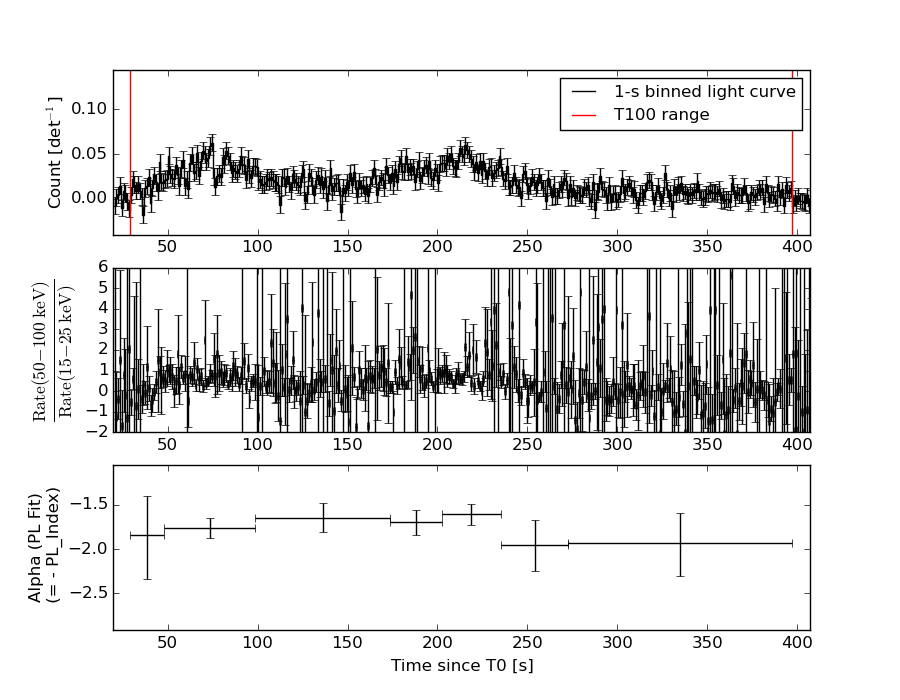
Light Curves
Note: The mask-weighted lightcurves have units of either count/det or counts/sec/det, where a det is 0.4 x 0.4 = 0.16 sq cm.
Full-time range; 1 s binning
Other quick-look light curves:
- 64 ms binning (zoomed)
- 16 ms binning (zoomed)
- 8 ms binning (zoomed)
- 2 ms binning (zoomed)
- SN=5 or 10 s binning (full-time range)
- Raw light curve
Spectra
- 64 ms binning (zoomed)
- 16 ms binning (zoomed)
- 8 ms binning (zoomed)
- 2 ms binning (zoomed)
- SN=5 or 10 s binning (full-time range)
- Raw light curve
Spectra
Notes:
- 1) The fitting includes the systematic errors.
- 2) When the burst includes telescope slew time periods, the fitting uses an average response file made from multiple 5-s response files through out the slew time plus single time preiod for the non-slew times, and weighted by the total counts in the corresponding time period using addrmf. An average response file is needed becuase a spectral fit using the pre-slew DRM will introduce some errors in both a spectral shape and a normalization if the PHA file contains a lot of the slew/post-slew time interval.
- 3) For fits to more complicated models (e.g. a power-law over a cutoff power-law), the BAT team has decided to require a chi-square improvement of more than 6 for each extra dof.
Time averaged spectrum fit using the average DRM
Power-law model
Time interval is from   29.344 sec. to  397.088 sec.

Spectral model in power-law:
------------------------------------------------------------
Parameters  : value       lower 90%   higher 90%
Photon index: -1.77359     ( -0.0831377   0.0822206 )
Norm@50keV  : 1.16445E-03    ( -5.4578e-05   5.42465e-05 )
------------------------------------------------------------
#Fit statistic : Chi-Squared =          42.82 using 59 PHA bins.
# Reduced chi-squared =         0.7512 for     57 degrees of freedom
# Null hypothesis probability =   9.183052e-01

Photon flux (15-150 keV)    in 367.7 sec: 0.158853 ( -0.007007  0.00702 ) ph/cm2/s
Energy fluence (15-150 keV)             : 3.9466e-06 ( -1.90441e-07  1.91909e-07 ) ergs/cm2
Cutoff power-law model
Time interval is from   29.344 sec. to  397.088 sec.
Spectral model in the cutoff power-law:
------------------------------------------------------------
Parameters  : value       lower 90%   higher 90%
Photon index: -1.40443     ( -0.31703   0.343303 )
Epeak [keV] : 75.2479      ( -17.1075 142.59 )
Norm@50keV  : 1.82028E-03    ( -0.000566532   0.000917091 )
------------------------------------------------------------
#Fit statistic : Chi-Squared =          38.80 using 59 PHA bins.
# Reduced chi-squared =         0.6929 for     56 degrees of freedom
# Null hypothesis probability =   9.612124e-01

Photon flux (15-150 keV)    in 367.7 sec: 0.155072 ( -0.007677  0.007683 ) ph/cm2/s
Energy fluence (15-150 keV)             : 3.79613e-06 ( -2.27241e-07  2.28659e-07 ) ergs/cm2
1-s peak spectrum fit
Power-law model
Time interval is from   73.724 sec. to   74.724 sec.

Spectral model in power-law:
------------------------------------------------------------
Parameters  : value       lower 90%   higher 90%
Photon index: -1.63905     ( -0.39631   0.373457 )
Norm@50keV  : 4.39141E-03    ( -0.00106469   0.00103003 )
------------------------------------------------------------
#Fit statistic : Chi-Squared =          39.79 using 59 PHA bins.
# Reduced chi-squared =         0.6981 for     57 degrees of freedom
# Null hypothesis probability =   9.595813e-01

Photon flux (15-150 keV)    in 1 sec: 0.571377 ( -0.122341  0.122393 ) ph/cm2/s
Energy fluence (15-150 keV)             : 4.08931e-08 ( -1.03193e-08  1.06606e-08 ) ergs/cm2
Cutoff power-law model
Time interval is from   73.724 sec. to   74.724 sec.
Spectral model in the cutoff power-law:
------------------------------------------------------------
Parameters  : value       lower 90%   higher 90%
Photon index: -0.889359     ( -1.31992   2.43571 )
Epeak [keV] : 68.3723      ( -61.5904 -68.3629 )
Norm@50keV  : 1.11276E-02    ( -0.0111331   0.198377 )
------------------------------------------------------------
#Fit statistic : Chi-Squared =          39.21 using 59 PHA bins.
# Reduced chi-squared =         0.7002 for     56 degrees of freedom
# Null hypothesis probability =   9.568399e-01

Photon flux (15-150 keV)    in 1 sec: 0.555073 ( -0.129403  0.127748 ) ph/cm2/s
Energy fluence (15-150 keV)             : 3.82807e-08 ( -1.08896e-08  1.20612e-08 ) ergs/cm2
Time-resolved spectra
Distribution
T90 vs. Hardness ratio plot
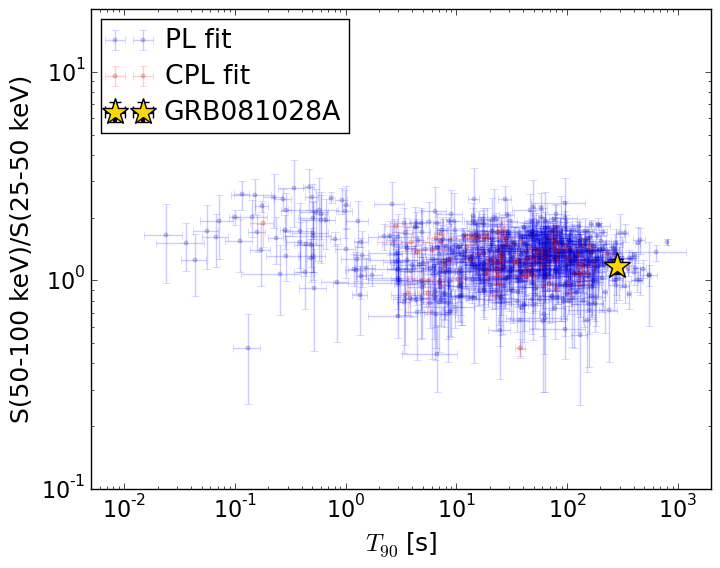
T90                                   = 284.424 sec.
Hardness ratio (energy fluence ratio) = 1.16995673435
S(15-50 keV) vs. S(50-150 keV) plot
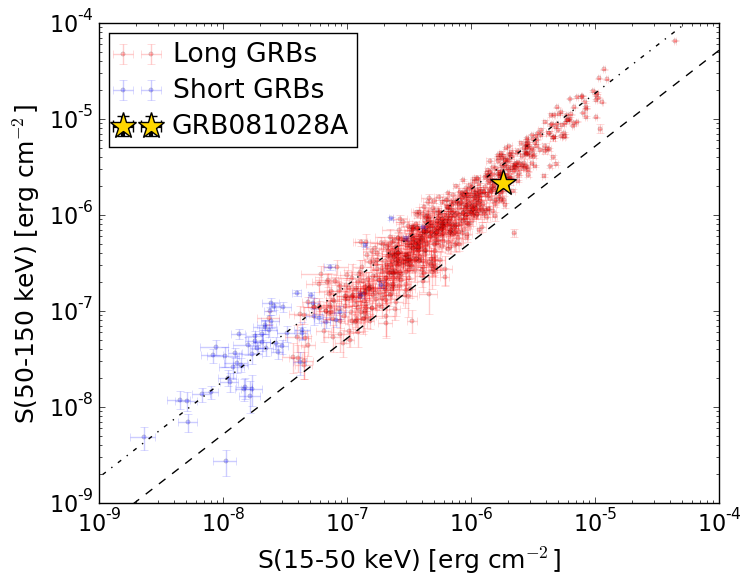
S(15-50 keV)  = 1.8073984e-06
S(50-150 keV) = 2.1392298e-06
The dash-dotted line and the dashed line traces the fluences calculated from the Band function with Epeak = 15 and 150 keV, respectively. Both lines assume a canonical values of alpha = -1 and beta = -2.5.
Mask shadow pattern
IMX = 3.504548298085697E-01, IMY = -1.668952291069005E-01
Spacecraft aspect plot
Bright source in the pre-burst/pre-slew/post-slew images
Pre-burst image of 15-350 keV band
Time interval of the image:
-322.899410 -289.900000
-239.000000 29.344000

# RAcent  DECcent POSerr Theta    Phi  PeakCts   SNR AngSep     Name
#  [deg]    [deg]    ['] [deg]  [deg]                   [']
124.6739  10.1625    2.9  13.2   33.6   0.6933   3.9 ------	UNKNOWN
137.0808 -11.4677    2.3  31.7  -15.3   1.0025   4.9 ------	UNKNOWN
Pre-slew background subtracted image of 15-350 keV band
Time interval of the image:
29.344000 136.700600

# RAcent  DECcent POSerr Theta    Phi  PeakCts   SNR AngSep     Name
#  [deg]    [deg]    ['] [deg]  [deg]                   [']
121.8896   2.3053    0.5  21.2   25.5   2.8582  24.4 ------	UNKNOWN
Post-slew image of 15-350 keV band
Time interval of the image:
179.900600 867.000600

# RAcent  DECcent POSerr Theta    Phi  PeakCts   SNR AngSep     Name
#  [deg]    [deg]    ['] [deg]  [deg]                   [']
135.4183 -40.4261    7.3  44.5  -27.7  -0.9444  -1.6    9.2	Vela X-1
 98.4222 -39.6132    2.7  47.1   11.8   3.5360   4.3 ------	UNKNOWN
130.6691  56.1020    3.1  54.3  173.1   5.5247   3.8 ------	UNKNOWN
118.9243  16.9855    2.6  15.0  156.0   1.4338   4.5 ------	UNKNOWN
121.8632   2.2995    1.0   0.0   72.0   3.8376  11.7 ------	UNKNOWN
131.3552   3.8338    2.4   9.6 -112.4   1.4058   4.8 ------	UNKNOWN
129.8072 -44.1303    3.2  47.0  -20.7   2.3811   3.7 ------	UNKNOWN
135.5690 -48.3022    2.5  52.0  -24.5   4.2391   4.6 ------	UNKNOWN