Analysis Summary
Notes:
- 1) No attempt has been made to eliminate the non-significant decimal places.
- 2) This batgrbproduct analysis is done using the HEASARC data.
- 3) This batgrbproduct analysis is using the flight position for the mask-weighting calculation.
======================================================================
BAT GRB EVENT DATA PROCESSING REPORT
Process Script Ver: batgrbproduct v2.46
Process Start Time: Sun Jan 19 21:10:58 EST 2014
Host Name: batevent1
Current Working Dir: /local/data/batevent/batevent_reproc/trigger332931
======================================================================
Trigger: 00332931 Segment: 000
BAT Trigger Time: 246937440 [s; MET]
Trigger Stop: 246937504 [s; MET]
UTC: 2008-10-29T01:43:56.788020 [includes UTCF correction]
Where From?: TDRSS position message
BAT
RA: 346.703787157334 Dec: -68.159638914543 [deg; J2000]
Catalogged Source?: NO
Point Source?: YES
GRB Indicated?: YES [ by BAT flight software ]
Image S/N Ratio: 11.49
Image Trigger?: YES
Rate S/N Ratio: 0 [ if not an image trigger ]
Image S/N Ratio: 11.49
Analysis Position: [ source = BAT ]
RA: 346.703787157334 Dec: -68.159638914543 [deg; J2000]
Refined Position: [ source = BAT pre-slew burst ]
RA: 346.761947245779 Dec: -68.1701997611752 [deg; J2000]
{ 23h 07m 02.9s , -68d 10' 12.7" }
+/- 2.09465946373624 [arcmin] (estimated 90% radius based on SNR)
+/- 0.925258207746063 [arcmin] (formal 1-sigma fit error)
SNR: 10.577545717326
Angular difference between the analysis and refined position is 1.444329 arcmin
Partial Coding Fraction: 0.5859375 [ including projection effects ]
Duration
T90: 275.104000031948 +/- 48.9548761810702
Measured from: -24.0640000104904
to: 251.040000021458 [s; relative to TRIGTIME]
T50: 106.511999994516 +/- 37.2252639035916
Measured from: 15.5480000078678
to: 122.060000002384 [s; relative to TRIGTIME]
Fluence
Peak Flux (peak 1 second)
Measured from: 20.5719999969006
to: 21.5719999969006 [s; relative to TRIGTIME]
Total Fluence
Measured from: -36.2560000121593
to: 270.243999987841 [s; relative to TRIGTIME]
Band 1 Band 2 Band 3 Band 4
15-25 25-50 50-100 100-350 keV
Total 0.656352 1.262595 0.918684 0.320510
0.109706 0.114528 0.102133 0.090530 [error]
Peak 0.019444 0.017710 0.009729 0.008874
0.006339 0.006703 0.005947 0.005177 [error]
[ fluence units of on-axis counts / fully illuminated detector ]
======================================================================
====== Table of the duration information =============================
Value tstart tstop
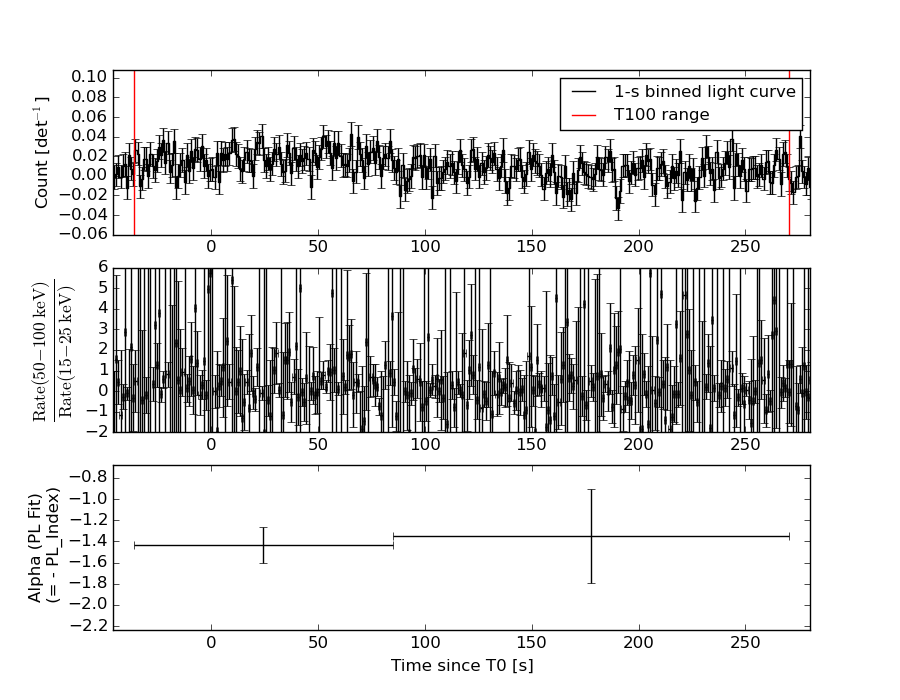
T100 306.500 -36.256 270.244
T90 275.104 -24.064 251.040
T50 106.512 15.548 122.060
Peak 1.000 20.572 21.572
====== Spectral Analysis Summary =====================================
Model : spectral model: simple power-law (PL) and cutoff power-law (CPL)
Ph_index : photon index: E^{Ph_index}
Ph_90err : 90% error of the photon index
Epeak : Epeak in keV
Epeak_90err: 90% error of Epeak
Norm : normalization at 50 keV in both the PL model and CPL model
Nomr_90err : 90% error of the normalization
chi2 : Chi-Squared
dof : degree of freedo
=== Time-averaged spectral analysis ===
(Best model with acceptable fit: PL)
Model Ph_index Ph_90err_low Ph_90err_hi Epeak Epeak_90err_low Epeak_90err_hi Norm Nomr_90err_low Norm_90err_hi chi2 dof
PL -1.407 -0.181 0.182 - - - 7.25e-04 -7.64e-05 7.62e-05 67.290 57
CPL -1.101 -0.458 0.792 149.667 -149.667 -149.667 1.03e-03 -4.07e-04 1.48e-03 66.720 56
=== 1-s peak spectral analysis ===
(Best model with acceptable fit: N/A)
Model Ph_index Ph_90err_low Ph_90err_hi Epeak Epeak_90err_low Epeak_90err_hi Norm Nomr_90err_low Norm_90err_hi chi2 dof
PL -1.739 -0.712 0.632 - - - 3.32e-03 -1.44e-03 1.37e-03 44.010 57
CPL -0.447 -1.732 5.125 53.023 -53.023 -53.023 1.74e-02 -1.74e-02 1.63e+01 43.390 56
=== Fluence/Peak Flux Summary ===
Model Band1 Band2 Band3 Band4 Band5 Total
15-25 25-50 50-100 100-350 15-150 15-350 keV
Fluence PL 2.60e-07 5.06e-07 7.63e-07 2.50e-06 2.14e-06 4.02e-06 erg/cm2
90%_error_low -4.76e-08 -5.81e-08 -1.00e-07 -6.42e-07 -2.46e-07 -7.23e-07 erg/cm2
90%_error_hi 5.01e-08 5.75e-08 9.92e-08 7.80e-07 2.47e-07 8.36e-07 erg/cm2
Peak flux PL 1.72e-01 1.50e-01 9.00e-02 8.12e-02 4.47e-01 4.93e-01 ph/cm2/s
90%_error_low -8.91e-02 -5.69e-02 -4.74e-02 -8.12e-02 -1.68e-01 -1.87e-01 ph/cm2/s
90%_error_hi 1.00e-01 5.67e-02 4.84e-02 1.14e-01 1.69e-01 1.89e-01 ph/cm2/s
Fluence CPL 2.47e-07 5.23e-07 7.81e-07 1.58e-06 2.10e-06 3.13e-06 erg/cm2
90%_error_low -5.61e-08 -6.80e-08 -1.08e-07 -9.68e-07 -2.72e-07 -9.99e-07 erg/cm2
90%_error_hi 5.73e-08 7.11e-08 1.11e-07 1.67e-06 2.68e-07 1.19e-06 erg/cm2
Peak flux CPL 1.48e-01 1.73e-01 9.22e-02 2.07e-02 4.30e-01 4.34e-01 ph/cm2/s
90%_error_low N/A -7.32e-02 -9.22e-02 -2.07e-02 -1.71e-01 -1.75e-01 ph/cm2/s
90%_error_hi N/A 8.33e-02 5.77e-02 8.78e-02 1.73e-01 2.02e-01 ph/cm2/s
======================================================================
Image
Pre-slew 15.0-350.0 keV image (Event data)
#   RAcent    DECcent   POSerr    Theta     Phi              Peak Cts       SNR   Name
  346.7619   -68.1702   0.0181    38.5132   -23.0966         3.2692915     10.578 TRIG_00332931

Foreground time interval of the image:
-36.256 270.244 (delta_t = 306.500 [sec])
Background time interval of the image:
-556.799 -465.950 (delta_t =  90.849 [sec])
-239.000 -36.256 (delta_t = 202.744 [sec])
Light Curves
Note: The mask-weighted lightcurves have units of either count/det or counts/sec/det, where a det is 0.4 x 0.4 = 0.16 sq cm.
Full-time range; 1 s binning
Other quick-look light curves:
- 64 ms binning (zoomed)
- 16 ms binning (zoomed)
- 8 ms binning (zoomed)
- 2 ms binning (zoomed)
- SN=5 or 10 s binning (full-time range)
- Raw light curve
Spectra
- 64 ms binning (zoomed)
- 16 ms binning (zoomed)
- 8 ms binning (zoomed)
- 2 ms binning (zoomed)
- SN=5 or 10 s binning (full-time range)
- Raw light curve
Spectra
Notes:
- 1) The fitting includes the systematic errors.
- 2) When the burst includes telescope slew time periods, the fitting uses an average response file made from multiple 5-s response files through out the slew time plus single time preiod for the non-slew times, and weighted by the total counts in the corresponding time period using addrmf. An average response file is needed becuase a spectral fit using the pre-slew DRM will introduce some errors in both a spectral shape and a normalization if the PHA file contains a lot of the slew/post-slew time interval.
- 3) For fits to more complicated models (e.g. a power-law over a cutoff power-law), the BAT team has decided to require a chi-square improvement of more than 6 for each extra dof.
Time averaged spectrum fit using the average DRM
Power-law model
Time interval is from  -36.256 sec. to  270.244 sec.

Spectral model in power-law:
------------------------------------------------------------
Parameters  : value       lower 90%   higher 90%
Photon index: -1.40691     ( -0.18053   0.181523 )
Norm@50keV  : 7.25083E-04    ( -7.6356e-05   7.61502e-05 )
------------------------------------------------------------
#Fit statistic : Chi-Squared =          67.29 using 59 PHA bins.
# Reduced chi-squared =          1.180 for     57 degrees of freedom
# Null hypothesis probability =   1.654318e-01

Photon flux (15-150 keV)    in 306.5 sec: 8.84425E-02 ( -0.0095818  0.0096054 ) ph/cm2/s
Energy fluence (15-150 keV)             : 2.14467e-06 ( -2.45645e-07  2.47382e-07 ) ergs/cm2
Cutoff power-law model
Time interval is from  -36.256 sec. to  270.244 sec.
Spectral model in the cutoff power-law:
------------------------------------------------------------
Parameters  : value       lower 90%   higher 90%
Photon index: -1.10067     ( -0.457718   0.791959 )
Epeak [keV] : 149.667      ( -149.686 -149.686 )
Norm@50keV  : 1.03195E-03    ( -0.000407135   0.00148068 )
------------------------------------------------------------
#Fit statistic : Chi-Squared =          66.72 using 59 PHA bins.
# Reduced chi-squared =          1.191 for     56 degrees of freedom
# Null hypothesis probability =   1.547010e-01

Photon flux (15-150 keV)    in 306.5 sec: 8.73399E-02 ( -0.0099174  0.0099121 ) ph/cm2/s
Energy fluence (15-150 keV)             : 2.09827e-06 ( -2.71762e-07  2.67929e-07 ) ergs/cm2
1-s peak spectrum fit
Power-law model
Time interval is from   20.572 sec. to   21.572 sec.

Spectral model in power-law:
------------------------------------------------------------
Parameters  : value       lower 90%   higher 90%
Photon index: -1.739     ( -0.711834   0.631925 )
Norm@50keV  : 3.31807E-03    ( -0.00144476   0.00137176 )
------------------------------------------------------------
#Fit statistic : Chi-Squared =          44.01 using 59 PHA bins.
# Reduced chi-squared =         0.7721 for     57 degrees of freedom
# Null hypothesis probability =   8.961031e-01

Photon flux (15-150 keV)    in 1 sec: 0.446872 ( -0.168333  0.168567 ) ph/cm2/s
Energy fluence (15-150 keV)             : 3.06422e-08 ( -1.30164e-08  1.37309e-08 ) ergs/cm2
Cutoff power-law model
Time interval is from   20.572 sec. to   21.572 sec.
Spectral model in the cutoff power-law:
------------------------------------------------------------
Parameters  : value       lower 90%   higher 90%
Photon index: -0.446697     ( -1.73185   5.12497 )
Epeak [keV] : 53.0231      ( -53.0207 -53.0207 )
Norm@50keV  : 1.73525E-02    ( -0.0173609   16.347 )
------------------------------------------------------------
#Fit statistic : Chi-Squared =          43.39 using 59 PHA bins.
# Reduced chi-squared =         0.7749 for     56 degrees of freedom
# Null hypothesis probability =   8.906983e-01

Photon flux (15-150 keV)    in 1 sec: 0.430009 ( -0.171355  0.172516 ) ph/cm2/s
Energy fluence (15-150 keV)             : 2.76427e-08 ( -1.23272e-08  1.50762e-08 ) ergs/cm2
Time-resolved spectra
Distribution
T90 vs. Hardness ratio plot
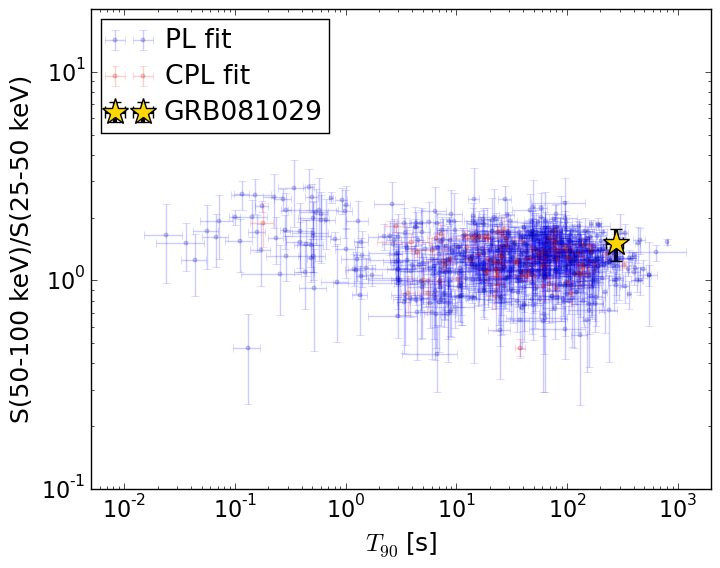
T90                                   = 275.104 sec.
Hardness ratio (energy fluence ratio) = 1.50851639316
S(15-50 keV) vs. S(50-150 keV) plot
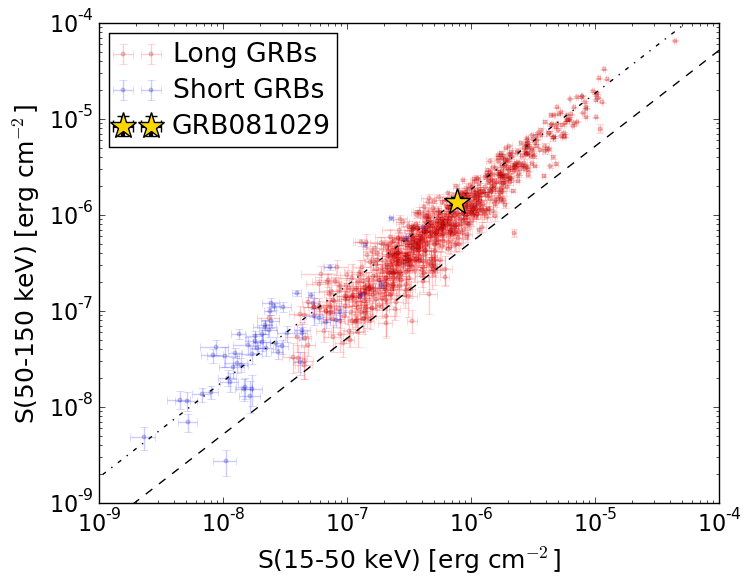
S(15-50 keV)  = 7.659945e-07
S(50-150 keV) = 1.3786756e-06
The dash-dotted line and the dashed line traces the fluences calculated from the Band function with Epeak = 15 and 150 keV, respectively. Both lines assume a canonical values of alpha = -1 and beta = -2.5.
Mask shadow pattern
IMX = 7.320249024235598E-01, IMY = 3.121838585141472E-01
Spacecraft aspect plot
Bright source in the pre-burst/pre-slew/post-slew images
Pre-burst image of 15-350 keV band
Time interval of the image:
-556.799400 -465.950000
-239.000000 -36.256000

# RAcent  DECcent POSerr Theta    Phi  PeakCts   SNR AngSep     Name
#  [deg]    [deg]    ['] [deg]  [deg]                   [']
135.5107 -40.5694    5.3  46.1 -136.8   1.0889   2.2    1.2	Vela X-1
 38.9445 -20.9913    2.6  39.3   75.7   3.0135   4.4 ------	UNKNOWN
Pre-slew background subtracted image of 15-350 keV band
Time interval of the image:
-36.256000 270.244000

# RAcent  DECcent POSerr Theta    Phi  PeakCts   SNR AngSep     Name
#  [deg]    [deg]    ['] [deg]  [deg]                   [']
135.7118 -40.7121    4.6  46.1 -136.5   1.4248   2.5   12.6	Vela X-1
338.6058 -48.0346    2.4  52.7   -2.1   3.0775   4.9 ------	UNKNOWN
346.7620 -68.1702    1.1  38.5  -23.1   3.2706  10.6 ------	UNKNOWN
Post-slew image of 15-350 keV band
Time interval of the image:
836.500600 983.093400

# RAcent  DECcent POSerr Theta    Phi  PeakCts   SNR AngSep     Name
#  [deg]    [deg]    ['] [deg]  [deg]                   [']
135.4472 -40.6243    1.9  31.2   31.0   0.9509   6.2    5.6	Vela X-1
170.5211 -60.5758    5.7  41.8  -16.2   0.3662   2.0    6.7	Cen X-3
186.3979 -62.9492    0.0  46.9  -24.8   0.0160   0.1   12.9	GX 301-2
138.7719  17.6044    2.4  43.3  136.8   1.7823   4.8 ------	UNKNOWN
127.4043 -31.4850    2.2  33.4   51.6   1.0410   5.2 ------	UNKNOWN
162.4623   6.8552    2.5  26.0  171.1   0.6003   4.7 ------	UNKNOWN
173.4278  36.9657    2.4  57.2 -179.1   3.2238   4.9 ------	UNKNOWN