Analysis Summary
Notes:
- 1) No attempt has been made to eliminate the non-significant decimal places.
- 2) This batgrbproduct analysis is done using the HEASARC data.
- 3) This batgrbproduct analysis is using the flight position for the mask-weighting calculation.
======================================================================
                  BAT GRB EVENT DATA PROCESSING REPORT
    Process Script Ver: batgrbproduct v2.46
    Process Start Time: Sun Jan 19 21:00:27 EST 2014
             Host Name: batevent1
   Current Working Dir: /local/data/batevent/batevent_reproc/trigger333427
======================================================================

  Trigger: 00333427      Segment: 000

  BAT Trigger Time: 247340682.752   [s; MET]
      Trigger Stop: 247340684.8   [s; MET]
               UTC: 2008-11-02T17:44:39.527920    [includes UTCF correction]
       Where From?: TDRSS position message

  BAT
    RA: 331.182421230354   Dec: 52.99333778508  [deg; J2000]

     Catalogged Source?: NO
     Point Source?:      YES
     GRB Indicated?:     YES    [ by BAT flight software ]
     Image S/N Ratio:    8.52
     Image Trigger?:     NO
     Rate S/N Ratio:     14  [ if not an image trigger ]
     Image S/N Ratio:    8.52

  Analysis Position:   [ source = BAT ]
    RA: 331.182421230354   Dec: 52.99333778508  [deg; J2000]

  Refined Position:   [ source = BAT pre-slew burst ]
    RA: 331.180275443501   Dec: 52.9922552262831  [deg; J2000]
        { 22h 04m 43.3s , +52d 59' 32.1" }
         +/- 1.14347271049501 [arcmin] (estimated 90% radius based on SNR)
         +/- 0.419501003585147 [arcmin] (formal 1-sigma fit error)
    SNR: 25.1153167268121

  Angular difference between the analysis and refined position is 0.101116 arcmin

  Partial Coding Fraction: 0.3632812    [ including projection effects ]

  Duration
     T90: 50.3199999928474 +/- 12.6093471912768
        Measured from: -17.3400000035763
                   to: 32.9799999892712     [s; relative to TRIGTIME]
     T50: 16.7520000040531 +/- 4.93076547613347
        Measured from: -5.0160000026226
                   to: 11.7360000014305     [s; relative to TRIGTIME]


  Fluence
     Peak Flux  (peak 1 second)
        Measured from: 0.0640000104904175
                   to: 1.06400001049042     [s; relative to TRIGTIME]
     Total Fluence
        Measured from: -20.0760000050068
                   to: 45.8120000064373     [s; relative to TRIGTIME]

             Band 1     Band 2     Band 3     Band 4
              15-25      25-50     50-100    100-350     keV
 Total     1.096401   1.388040   0.895936   0.293457
           0.073006   0.078627   0.074478   0.077443 [error]
 Peak      0.035907   0.048488   0.073268   0.025678
           0.009542   0.010918   0.010328   0.009842 [error]

     [ fluence units of on-axis counts / fully illuminated detector ]

======================================================================


====== Table of the duration information =============================

        Value   tstart    tstop
T100   65.888  -20.076   45.812
T90    50.320  -17.340   32.980
T50    16.752   -5.016   11.736
Peak    1.000    0.064    1.064


====== Spectral Analysis Summary =====================================

Model      : spectral model: simple power-law (PL) and cutoff power-law (CPL)
Ph_index   : photon index: E^{Ph_index}
Ph_90err   : 90% error of the photon index
Epeak      : Epeak in keV
Epeak_90err: 90% error of Epeak
Norm       : normalization at 50 keV in both the PL model and CPL model
Nomr_90err : 90% error of the normalization
chi2       : Chi-Squared
dof        : degree of freedo

=== Time-averaged spectral analysis ===
(Best model with acceptable fit: PL)

Model Ph_index Ph_90err_low Ph_90err_hi  Epeak  Epeak_90err_low  Epeak_90err_hi  Norm       Nomr_90err_low    Norm_90err_hi    chi2    dof
PL      -1.662    -0.125      0.123       -           -               -         3.71e-03     -2.67e-04          2.64e-04      32.690   57
CPL     -1.475    -0.295      0.524      129.694     -65.406      -129.694      4.67e-03     -1.32e-03          4.14e-03      32.250   56


=== 1-s peak spectral analysis ===
(Best model with acceptable fit: PL)

Model Ph_index Ph_90err_low Ph_90err_hi  Epeak  Epeak_90err_low  Epeak_90err_hi  Norm       Nomr_90err_low    Norm_90err_hi    chi2    dof
PL      -1.038     -0.295     0.307       -           -               -         1.29e-02     -2.22e-03          2.21e-03      59.030   57
CPL     -0.656     -0.643     1.661      205.140    -205.140      -205.140      1.90e-02     -8.06e-03          7.13e-02      58.770   56


=== Fluence/Peak Flux Summary ===

              Model    Band1     Band2     Band3     Band4     Band5     Total
                       15-25     25-50    50-100    100-350    15-150    15-350    keV
Fluence         PL   3.63e-07  6.05e-07  7.65e-07  1.93e-06  2.27e-06  3.66e-06   erg/cm2
      90%_error_low -3.86e-08 -3.99e-08 -7.52e-08 -3.74e-07 -1.74e-07 -4.43e-07   erg/cm2
      90%_error_hi   3.97e-08  3.99e-08  7.56e-08  4.33e-07  1.76e-07  4.92e-07   erg/cm2
Peak flux       PL   3.42e-01  4.54e-01  4.42e-01  7.71e-01  1.49e+00  2.01e+00   ph/cm2/s
      90%_error_low -1.12e-01 -9.78e-02 -8.28e-02 -2.71e-01 -2.61e-01 -3.64e-01   ph/cm2/s
      90%_error_hi   1.26e-01  9.52e-02  8.15e-02  3.55e-01  2.62e-01  3.81e-01   ph/cm2/s

Fluence        CPL   3.54e-07  6.17e-07  7.66e-07  1.38e-06  2.22e-06  3.12e-06   erg/cm2
      90%_error_low -4.51e-08 -4.86e-08 -7.77e-08 -7.55e-07 -2.11e-07 -7.90e-07   erg/cm2
      90%_error_hi   4.39e-08  5.14e-08  7.79e-08  1.04e-06  2.08e-07  9.38e-07   erg/cm2
Peak flux      CPL   3.09e-01  4.62e-01  4.63e-01  5.36e-01  1.47e+00  1.77e+00   ph/cm2/s
      90%_error_low -1.54e-01 -1.03e-01 -9.90e-02 -5.36e-01 -2.76e-01 -4.88e-01   ph/cm2/s
      90%_error_hi   1.52e-01  1.06e-01  1.10e-01  3.19e-01  2.71e-01  5.77e-01   ph/cm2/s

======================================================================
Image
Pre-slew 15.0-350.0 keV image (Event data)
#   RAcent    DECcent   POSerr    Theta     Phi              Peak Cts       SNR   Name
  331.1803    52.9923   0.0077    32.7270    50.5117         3.7362482     25.115 TRIG_00333427

Foreground time interval of the image:
-20.076  28.349 (delta_t =  48.425 [sec])
Background time interval of the image:
-239.752 -20.076 (delta_t = 219.676 [sec])
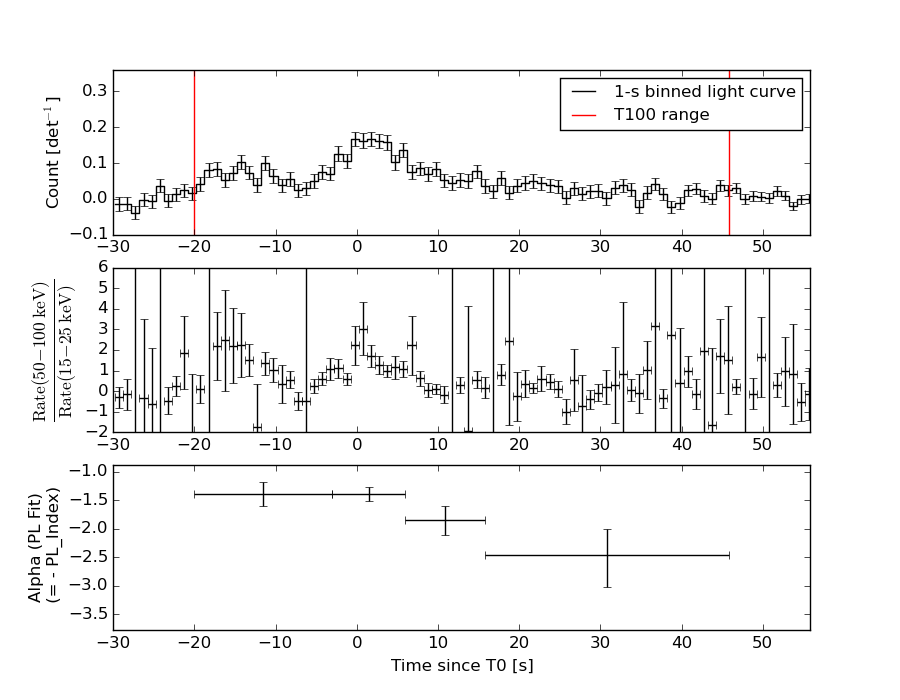
Light Curves
Note: The mask-weighted lightcurves have units of either count/det or counts/sec/det, where a det is 0.4 x 0.4 = 0.16 sq cm.
Full-time range; 1 s binning
Other quick-look light curves:
- 64 ms binning (zoomed)
- 16 ms binning (zoomed)
- 8 ms binning (zoomed)
- 2 ms binning (zoomed)
- SN=5 or 10 s binning (full-time range)
- Raw light curve
Spectra
- 64 ms binning (zoomed)
- 16 ms binning (zoomed)
- 8 ms binning (zoomed)
- 2 ms binning (zoomed)
- SN=5 or 10 s binning (full-time range)
- Raw light curve
Spectra
Notes:
- 1) The fitting includes the systematic errors.
- 2) When the burst includes telescope slew time periods, the fitting uses an average response file made from multiple 5-s response files through out the slew time plus single time preiod for the non-slew times, and weighted by the total counts in the corresponding time period using addrmf. An average response file is needed becuase a spectral fit using the pre-slew DRM will introduce some errors in both a spectral shape and a normalization if the PHA file contains a lot of the slew/post-slew time interval.
- 3) For fits to more complicated models (e.g. a power-law over a cutoff power-law), the BAT team has decided to require a chi-square improvement of more than 6 for each extra dof.
Time averaged spectrum fit using the average DRM
Power-law model
Time interval is from  -20.076 sec. to   45.812 sec.

Spectral model in power-law:
------------------------------------------------------------
Parameters  : value       lower 90%   higher 90%
Photon index: -1.66195     ( -0.124629   0.122695 )
Norm@50keV  : 3.70910E-03    ( -0.000266941   0.000264311 )
------------------------------------------------------------
#Fit statistic : Chi-Squared =          32.69 using 59 PHA bins.
# Reduced chi-squared =         0.5736 for     57 degrees of freedom
# Null hypothesis probability =   9.959904e-01

Photon flux (15-150 keV)    in 65.89 sec: 0.486261 ( -0.032081  0.032107 ) ph/cm2/s
Energy fluence (15-150 keV)             : 2.2706e-06 ( -1.74122e-07  1.76379e-07 ) ergs/cm2
Cutoff power-law model
Time interval is from  -20.076 sec. to   45.812 sec.
Spectral model in the cutoff power-law:
------------------------------------------------------------
Parameters  : value       lower 90%   higher 90%
Photon index: -1.47476     ( -0.294963   0.52369 )
Epeak [keV] : 129.694      ( -65.495 -129.783 )
Norm@50keV  : 4.67127E-03    ( -0.00131536   0.00413713 )
------------------------------------------------------------
#Fit statistic : Chi-Squared =          32.25 using 59 PHA bins.
# Reduced chi-squared =         0.5758 for     56 degrees of freedom
# Null hypothesis probability =   9.954661e-01

Photon flux (15-150 keV)    in 65.89 sec: 0.481207 ( -0.034606  0.034418 ) ph/cm2/s
Energy fluence (15-150 keV)             : 2.22346e-06 ( -2.10756e-07  2.07959e-07 ) ergs/cm2
1-s peak spectrum fit
Power-law model
Time interval is from    0.064 sec. to    1.064 sec.

Spectral model in power-law:
------------------------------------------------------------
Parameters  : value       lower 90%   higher 90%
Photon index: -1.03757     ( -0.294545   0.307038 )
Norm@50keV  : 1.29281E-02    ( -0.00221503   0.00220512 )
------------------------------------------------------------
#Fit statistic : Chi-Squared =          59.03 using 59 PHA bins.
# Reduced chi-squared =          1.036 for     57 degrees of freedom
# Null hypothesis probability =   4.011369e-01

Photon flux (15-150 keV)    in 1 sec: 1.49181 ( -0.26069  0.26189 ) ph/cm2/s
Energy fluence (15-150 keV)             : 1.37997e-07 ( -2.54095e-08  2.56055e-08 ) ergs/cm2
Cutoff power-law model
Time interval is from    0.064 sec. to    1.064 sec.
Spectral model in the cutoff power-law:
------------------------------------------------------------
Parameters  : value       lower 90%   higher 90%
Photon index: -0.656397     ( -0.643336   1.661 )
Epeak [keV] : 205.140      ( -205.094 -205.094 )
Norm@50keV  : 1.90279E-02    ( -0.00806412   0.071285 )
------------------------------------------------------------
#Fit statistic : Chi-Squared =          58.77 using 59 PHA bins.
# Reduced chi-squared =          1.049 for     56 degrees of freedom
# Null hypothesis probability =   3.744519e-01

Photon flux (15-150 keV)    in 1 sec: 1.46871 ( -0.27611  0.27134 ) ph/cm2/s
Energy fluence (15-150 keV)             : 1.35838e-07 ( -2.70603e-08  2.66121e-08 ) ergs/cm2
Time-resolved spectra
Distribution
T90 vs. Hardness ratio plot
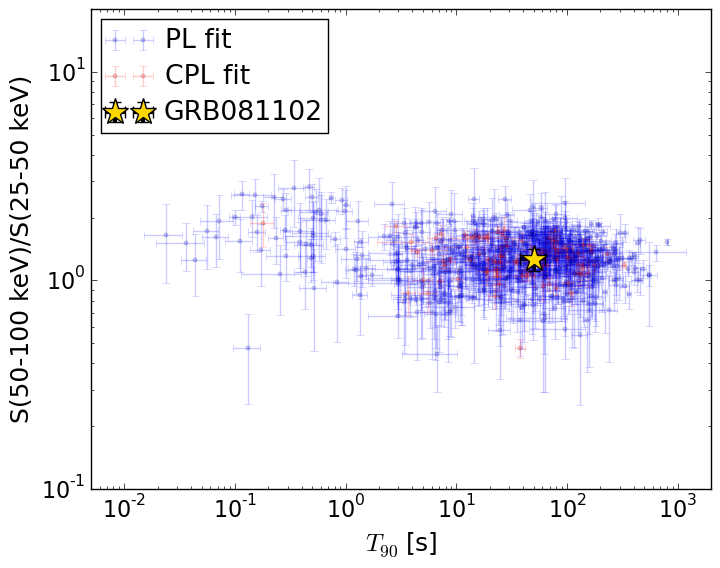
T90                                   = 50.32 sec.
Hardness ratio (energy fluence ratio) = 1.26409556182
S(15-50 keV) vs. S(50-150 keV) plot
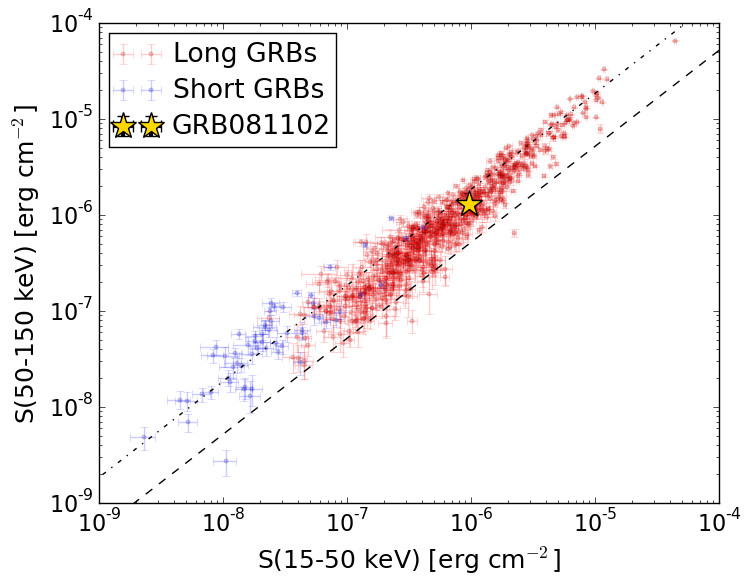
S(15-50 keV)  = 9.682479e-07
S(50-150 keV) = 1.3023683e-06
The dash-dotted line and the dashed line traces the fluences calculated from the Band function with Epeak = 15 and 150 keV, respectively. Both lines assume a canonical values of alpha = -1 and beta = -2.5.
Mask shadow pattern
IMX = 4.086775134310253E-01, IMY = -4.959717974243960E-01
Spacecraft aspect plot
Bright source in the pre-burst/pre-slew/post-slew images
Pre-burst image of 15-350 keV band
Time interval of the image:
-239.752000 -20.076000

# RAcent  DECcent POSerr Theta    Phi  PeakCts   SNR AngSep     Name
#  [deg]    [deg]    ['] [deg]  [deg]                   [']
254.4721  35.3754   10.9  34.1  -63.0  -0.3742  -1.1    2.1	Her X-1
268.4074  -1.4246    5.0  42.5 -127.0   1.2166   2.3    2.9	SW J1753.5-0127
274.0723 -13.9016    0.0  50.7 -142.1  -0.4308  -0.6    9.0	GX 17+2
284.9091 -24.8958    7.4  58.1 -158.2  -2.2656  -1.5    7.1	HT1900.1-2455
288.7859  10.9392    1.7  22.3 -151.5   1.4697   6.9    0.8	GRS 1915+105
299.6030  35.2047    0.2   4.3   57.5   9.0588  46.6    0.7	Cyg X-1
308.2754  40.9933    7.1  13.3   55.9   0.3306   1.6    7.9	Cyg X-3
326.0027  38.4801    0.0  25.3   77.7   0.6626   2.2   12.4	Cyg X-2
255.8983  13.2789    3.3  41.0  -98.0   3.6408   3.5 ------	UNKNOWN
234.8677  41.9535    2.7  48.4  -50.0   4.8837   4.3 ------	UNKNOWN
Pre-slew background subtracted image of 15-350 keV band
Time interval of the image:
-20.076000 28.348600

# RAcent  DECcent POSerr Theta    Phi  PeakCts   SNR AngSep     Name
#  [deg]    [deg]    ['] [deg]  [deg]                   [']
254.2703  35.3172   28.6  34.3  -63.1   0.0551   0.4    9.3	Her X-1
268.4375  -1.5692   17.5  42.6 -127.1   0.1338   0.7    8.1	SW J1753.5-0127
274.0654 -14.0506    3.7  50.8 -142.2   1.0071   3.2    3.6	GX 17+2
285.0897 -24.9971    5.7  58.2 -158.4   0.9375   2.0    5.4	HT1900.1-2455
288.6181  11.0612    0.0  22.2 -151.0   0.1572   1.8   12.7	GRS 1915+105
299.4648  35.3382    6.5   4.3   55.1   0.1518   1.8   10.2	Cyg X-1
307.9142  40.9376   13.9  13.0   55.4   0.0755   0.8    8.9	Cyg X-3
326.0655  38.2895    6.2  25.4   78.1  -0.2399  -1.9    5.4	Cyg X-2
331.1803  52.9922    0.5  32.7   50.5   3.7368  25.1 ------	UNKNOWN
320.9842 -11.3914    2.2  49.9  157.1   1.6258   5.2 ------	UNKNOWN
215.8207  62.7601    2.4  57.1  -22.2   1.9614   4.8 ------	UNKNOWN
265.5354  -4.5811    2.3  46.7 -126.2   1.8695   5.1 ------	UNKNOWN
Post-slew image of 15-350 keV band
Time interval of the image:
81.148590 962.348700

# RAcent  DECcent POSerr Theta    Phi  PeakCts   SNR AngSep     Name
#  [deg]    [deg]    ['] [deg]  [deg]                   [']
299.5903  35.1972    0.2  28.4 -125.1  34.7769  51.8    0.3	Cyg X-1
307.8912  41.0473   11.4  19.7 -127.0   0.5471   1.0   11.4	Cyg X-3
326.0859  38.2183    3.4  15.2 -173.7   1.7947   3.4    7.4	Cyg X-2
324.3203  18.9708    2.9  34.4 -177.6   2.6657   4.0 ------	UNKNOWN
354.9229  84.6028    3.8  32.1   -4.9   1.9162   3.1 ------	UNKNOWN
238.3213  72.5381    3.0  41.1  -36.1   3.3823   3.8 ------	UNKNOWN