Analysis Summary
Notes:
- 1) No attempt has been made to eliminate the non-significant decimal places.
- 2) This batgrbproduct analysis is done using the HEASARC data.
- 3) This batgrbproduct analysis is using the flight position for the mask-weighting calculation.
======================================================================
BAT GRB EVENT DATA PROCESSING REPORT
Process Script Ver: batgrbproduct v2.46
Process Start Time: Sun Jan 19 20:54:18 EST 2014
Host Name: batevent1
Current Working Dir: /local/data/batevent/batevent_reproc/trigger333666
======================================================================
Trigger: 00333666 Segment: 000
BAT Trigger Time: 247484085.696 [s; MET]
Trigger Stop: 247484093.888 [s; MET]
UTC: 2008-11-04T09:34:42.467620 [includes UTCF correction]
Where From?: TDRSS position message
BAT
RA: 100.485289941374 Dec: -54.7321618369165 [deg; J2000]
Catalogged Source?: NO
Point Source?: YES
GRB Indicated?: YES [ by BAT flight software ]
Image S/N Ratio: 9.32
Image Trigger?: NO
Rate S/N Ratio: 6.70820393249937 [ if not an image trigger ]
Image S/N Ratio: 9.32
Analysis Position: [ source = BAT ]
RA: 100.485289941374 Dec: -54.7321618369165 [deg; J2000]
Refined Position: [ source = BAT pre-slew burst ]
RA: 100.498811005272 Dec: -54.7198364861277 [deg; J2000]
{ 06h 41m 59.7s , -54d 43' 11.4" }
+/- 1.3262778339297 [arcmin] (estimated 90% radius based on SNR)
+/- 0.607722226441068 [arcmin] (formal 1-sigma fit error)
SNR: 20.3201177828557
Angular difference between the analysis and refined position is 0.875430 arcmin
Partial Coding Fraction: 0.3203125 [ including projection effects ]
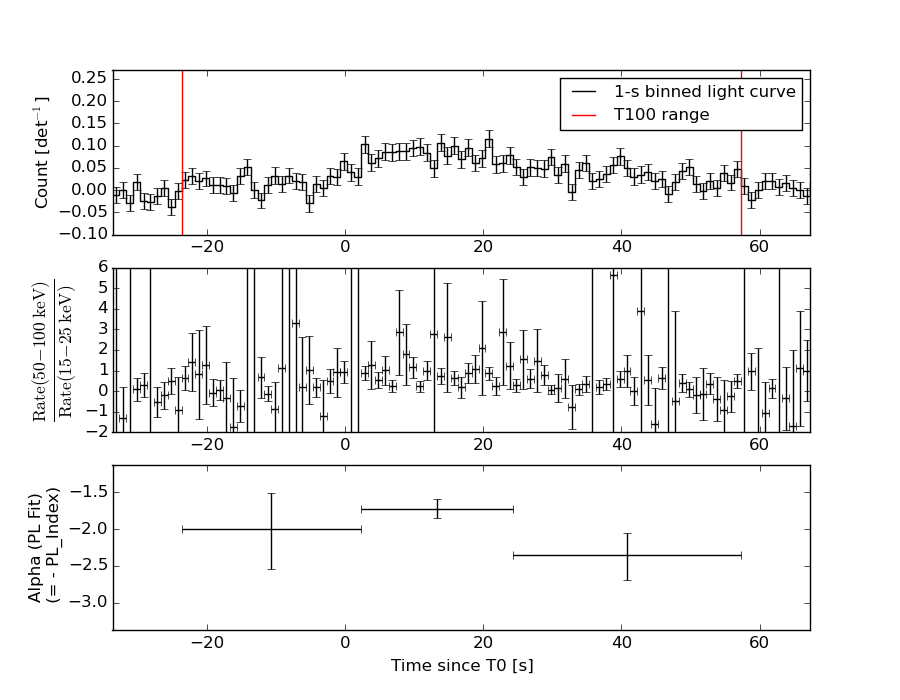
Duration
T90: 64 +/- 15.2643375224737
Measured from: -14.6960000097752
to: 49.3039999902248 [s; relative to TRIGTIME]
T50: 23 +/- 5.3851648071345
Measured from: 6.30399999022484
to: 29.3039999902248 [s; relative to TRIGTIME]
Fluence
Peak Flux (peak 1 second)
Measured from: 20.3039999902248
to: 21.3039999902248 [s; relative to TRIGTIME]
Total Fluence
Measured from: -23.6960000097752
to: 57.3039999902248 [s; relative to TRIGTIME]
Band 1 Band 2 Band 3 Band 4
15-25 25-50 50-100 100-350 keV
Total 1.171929 1.374217 0.762523 0.165470
0.084961 0.089939 0.080511 0.075021 [error]
Peak 0.039635 0.035506 0.034610 0.005506
0.009764 0.010356 0.009336 0.008367 [error]
[ fluence units of on-axis counts / fully illuminated detector ]
======================================================================
====== Table of the duration information =============================
Value tstart tstop
T100 81.000 -23.696 57.304
T90 64.000 -14.696 49.304
T50 23.000 6.304 29.304
Peak 1.000 20.304 21.304
====== Spectral Analysis Summary =====================================
Model : spectral model: simple power-law (PL) and cutoff power-law (CPL)
Ph_index : photon index: E^{Ph_index}
Ph_90err : 90% error of the photon index
Epeak : Epeak in keV
Epeak_90err: 90% error of Epeak
Norm : normalization at 50 keV in both the PL model and CPL model
Nomr_90err : 90% error of the normalization
chi2 : Chi-Squared
dof : degree of freedo
=== Time-averaged spectral analysis ===
(Best model with acceptable fit: PL)
Model Ph_index Ph_90err_low Ph_90err_hi Epeak Epeak_90err_low Epeak_90err_hi Norm Nomr_90err_low Norm_90err_hi chi2 dof
PL -1.943 -0.144 0.140 - - - 2.82e-03 -2.53e-04 2.49e-04 51.830 57
CPL -1.522 -0.534 0.615 51.218 -36.898 -51.218 4.79e-03 -2.30e-03 5.49e-03 50.060 56
=== 1-s peak spectral analysis ===
(Best model with acceptable fit: N/A)
Model Ph_index Ph_90err_low Ph_90err_hi Epeak Epeak_90err_low Epeak_90err_hi Norm Nomr_90err_low Norm_90err_hi chi2 dof
PL -1.852 -0.497 0.448 - - - 7.15e-03 -2.25e-03 2.17e-03 82.710 57
CPL -0.918 -1.260 2.503 52.905 -52.758 -52.905 2.32e-02 -2.32e-02 5.32e-01 81.850 56
=== Fluence/Peak Flux Summary ===
Model Band1 Band2 Band3 Band4 Band5 Total
15-25 25-50 50-100 100-350 15-150 15-350 keV
Fluence PL 4.43e-07 6.22e-07 6.47e-07 1.24e-06 2.10e-06 2.95e-06 erg/cm2
90%_error_low -5.13e-08 -4.77e-08 -7.84e-08 -2.79e-07 -1.82e-07 -3.64e-07 erg/cm2
90%_error_hi 5.28e-08 4.77e-08 7.87e-08 3.28e-07 1.83e-07 3.99e-07 erg/cm2
Peak flux PL 4.13e-01 3.38e-01 1.87e-01 1.53e-01 1.01e+00 1.09e+00 ph/cm2/s
90%_error_low -1.58e-01 -9.25e-02 -7.30e-02 -9.02e-02 -2.76e-01 -2.97e-01 ph/cm2/s
90%_error_hi 1.72e-01 9.23e-02 7.37e-02 1.41e-01 2.77e-01 2.98e-01 ph/cm2/s
Fluence CPL 4.21e-07 6.52e-07 6.49e-07 6.34e-07 2.03e-06 2.36e-06 erg/cm2
90%_error_low -5.94e-08 -6.10e-08 -8.47e-08 -3.50e-07 -2.03e-07 -4.14e-07 erg/cm2
90%_error_hi 5.97e-08 6.27e-08 8.42e-08 7.07e-07 2.05e-07 7.59e-07 erg/cm2
Peak flux CPL 3.67e-01 3.76e-01 1.96e-01 5.75e-02 9.81e-01 9.96e-01 ph/cm2/s
90%_error_low -1.84e-01 -1.14e-01 N/A -5.75e-02 -2.80e-01 -1.54e-01 ph/cm2/s
90%_error_hi 1.92e-01 1.24e-01 N/A 1.39e-01 2.81e-01 3.25e-01 ph/cm2/s
======================================================================
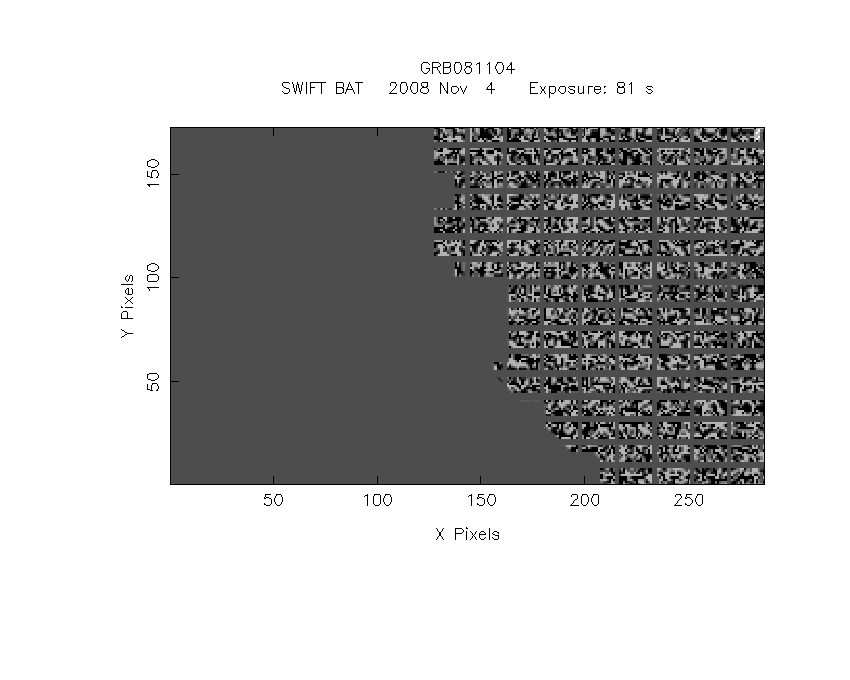
Image
Pre-slew 15.0-350.0 keV image (Event data)
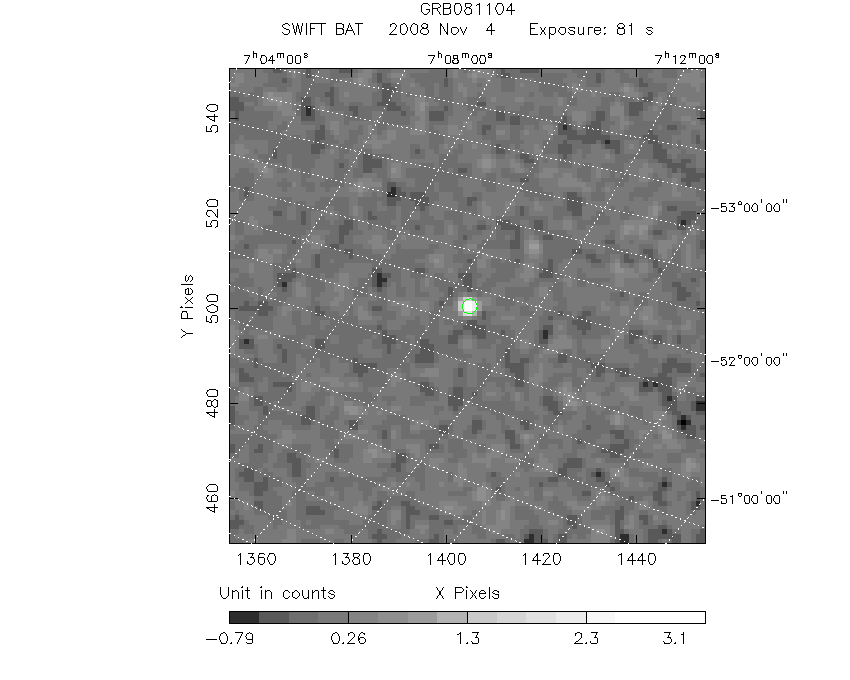
#   RAcent    DECcent   POSerr    Theta     Phi              Peak Cts       SNR   Name
  100.4988   -54.7198   0.0095    47.8516  -177.4057         3.8681784     20.320 TRIG_00333666

Foreground time interval of the image:
-23.696  57.304 (delta_t =  81.000 [sec])
Background time interval of the image:
-239.696 -23.696 (delta_t = 216.000 [sec])
Light Curves
Note: The mask-weighted lightcurves have units of either count/det or counts/sec/det, where a det is 0.4 x 0.4 = 0.16 sq cm.
Full-time range; 1 s binning
Other quick-look light curves:
- 64 ms binning (zoomed)
- 16 ms binning (zoomed)
- 8 ms binning (zoomed)
- 2 ms binning (zoomed)
- SN=5 or 10 s binning (full-time range)
- Raw light curve
Spectra
- 64 ms binning (zoomed)
- 16 ms binning (zoomed)
- 8 ms binning (zoomed)
- 2 ms binning (zoomed)
- SN=5 or 10 s binning (full-time range)
- Raw light curve
Spectra
Notes:
- 1) The fitting includes the systematic errors.
- 2) When the burst includes telescope slew time periods, the fitting uses an average response file made from multiple 5-s response files through out the slew time plus single time preiod for the non-slew times, and weighted by the total counts in the corresponding time period using addrmf. An average response file is needed becuase a spectral fit using the pre-slew DRM will introduce some errors in both a spectral shape and a normalization if the PHA file contains a lot of the slew/post-slew time interval.
- 3) For fits to more complicated models (e.g. a power-law over a cutoff power-law), the BAT team has decided to require a chi-square improvement of more than 6 for each extra dof.
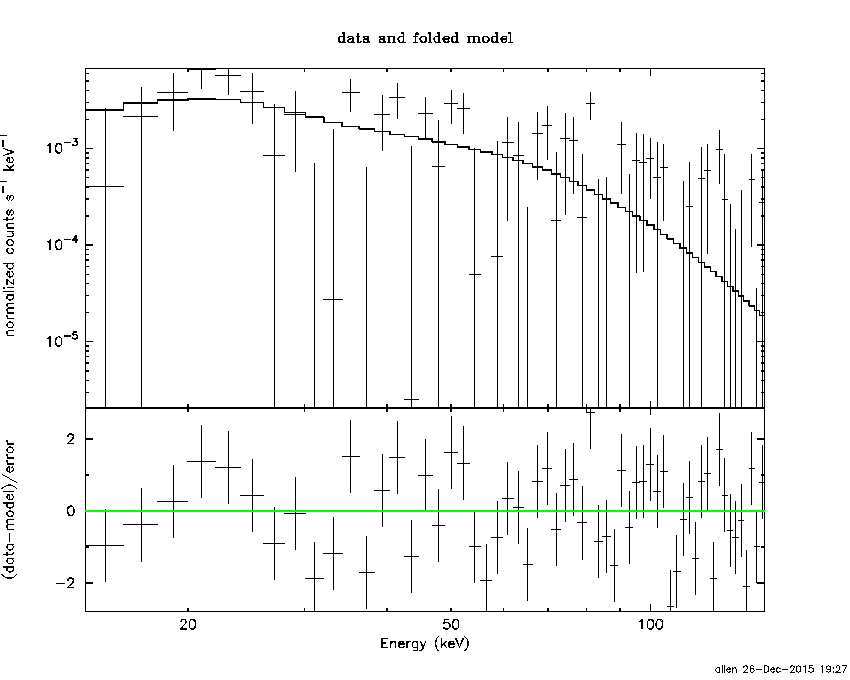
Time averaged spectrum fit using the average DRM
Power-law model
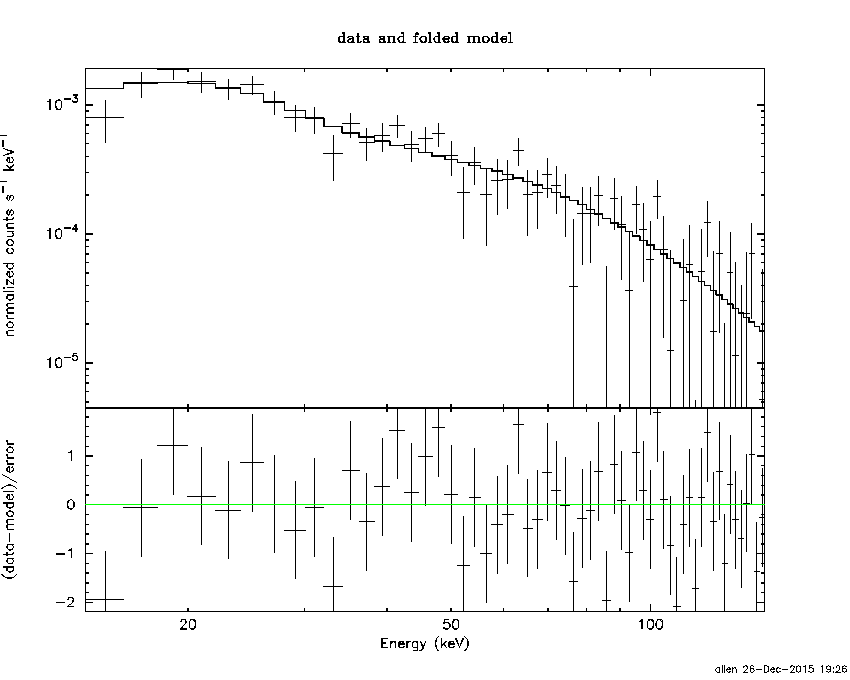
Time interval is from  -23.696 sec. to   57.304 sec.

Spectral model in power-law:
------------------------------------------------------------
Parameters  : value       lower 90%   higher 90%
Photon index: -1.94346     ( -0.144434   0.139839 )
Norm@50keV  : 2.82002E-03    ( -0.000252574   0.000248823 )
------------------------------------------------------------
#Fit statistic : Chi-Squared =          51.83 using 59 PHA bins.
# Reduced chi-squared =         0.9093 for     57 degrees of freedom
# Null hypothesis probability =   6.687401e-01

Photon flux (15-150 keV)    in 81 sec: 0.412405 ( -0.032386  0.032432 ) ph/cm2/s
Energy fluence (15-150 keV)             : 2.10206e-06 ( -1.81604e-07  1.83457e-07 ) ergs/cm2
Cutoff power-law model
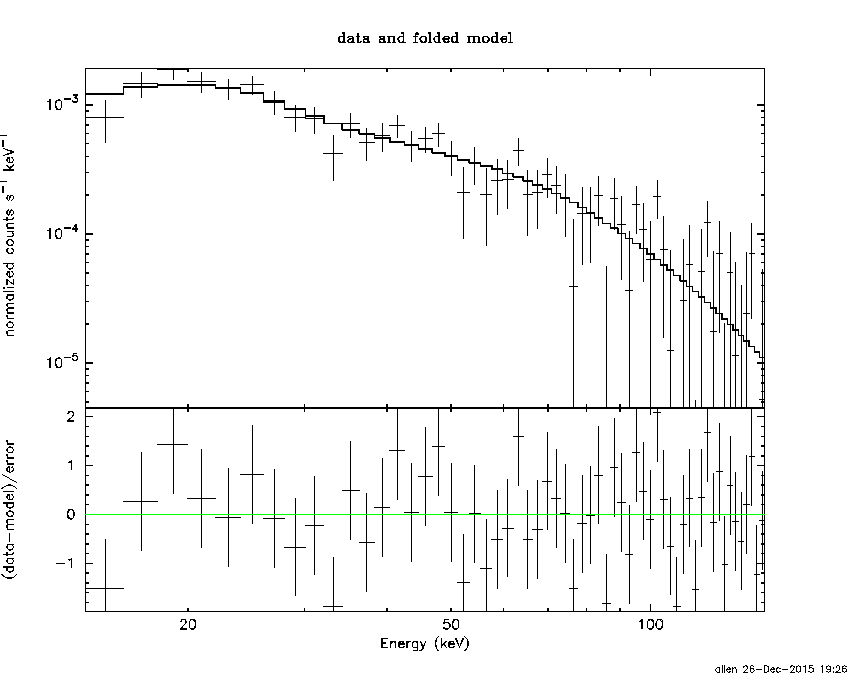
Time interval is from  -23.696 sec. to   57.304 sec.
Spectral model in the cutoff power-law:
------------------------------------------------------------
Parameters  : value       lower 90%   higher 90%
Photon index: -1.52236     ( -0.53424   0.615199 )
Epeak [keV] : 51.2183      ( -36.8976 -51.2183 )
Norm@50keV  : 4.79031E-03    ( -0.00229851   0.00549309 )
------------------------------------------------------------
#Fit statistic : Chi-Squared =          50.06 using 59 PHA bins.
# Reduced chi-squared =         0.8938 for     56 degrees of freedom
# Null hypothesis probability =   6.982349e-01

Photon flux (15-150 keV)    in 81 sec: 0.404741 ( -0.033874  0.033846 ) ph/cm2/s
Energy fluence (15-150 keV)             : 2.02948e-06 ( -2.03167e-07  2.04787e-07 ) ergs/cm2
1-s peak spectrum fit
Power-law model
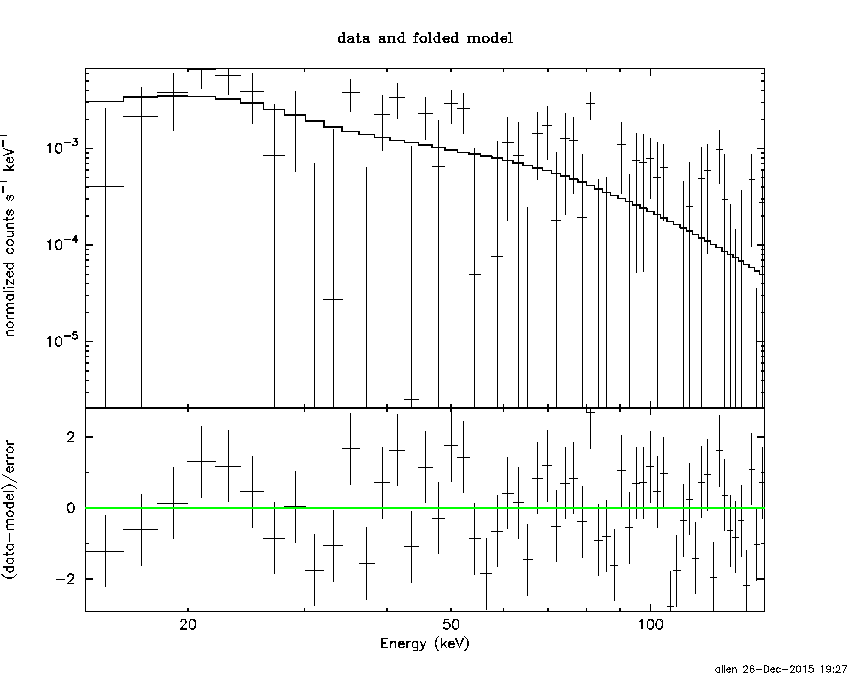
Time interval is from   20.304 sec. to   21.304 sec.

Spectral model in power-law:
------------------------------------------------------------
Parameters  : value       lower 90%   higher 90%
Photon index: -1.85232     ( -0.497146   0.447713 )
Norm@50keV  : 7.15498E-03    ( -0.00225492   0.00216875 )
------------------------------------------------------------
#Fit statistic : Chi-Squared =          82.71 using 59 PHA bins.
# Reduced chi-squared =          1.451 for     57 degrees of freedom
# Null hypothesis probability =   1.464267e-02

Photon flux (15-150 keV)    in 1 sec: 1.00671 ( -0.276222  0.2768 ) ph/cm2/s
Energy fluence (15-150 keV)             : 6.57991e-08 ( -2.0045e-08  2.06579e-08 ) ergs/cm2
Cutoff power-law model
Time interval is from   20.304 sec. to   21.304 sec.
Spectral model in the cutoff power-law:
------------------------------------------------------------
Parameters  : value       lower 90%   higher 90%
Photon index: -0.917577     ( -1.2606   2.5027 )
Epeak [keV] : 52.9050      ( -52.7563 -52.9036 )
Norm@50keV  : 2.31522E-02    ( -0.0231551   0.532077 )
------------------------------------------------------------
#Fit statistic : Chi-Squared =          81.85 using 59 PHA bins.
# Reduced chi-squared =          1.462 for     56 degrees of freedom
# Null hypothesis probability =   1.373809e-02

Photon flux (15-150 keV)    in 1 sec: 0.980824 ( -0.279731  0.280656 ) ph/cm2/s
Energy fluence (15-150 keV)             : 6.21098e-08 ( -2.02198e-08  2.16778e-08 ) ergs/cm2
Time-resolved spectra
Distribution
T90 vs. Hardness ratio plot
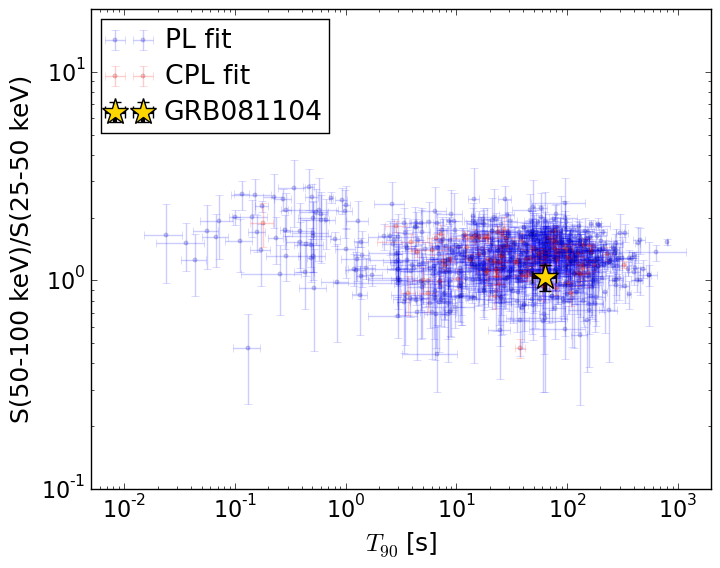
T90                                   = 64.0 sec.
Hardness ratio (energy fluence ratio) = 1.04001591806
S(15-50 keV) vs. S(50-150 keV) plot
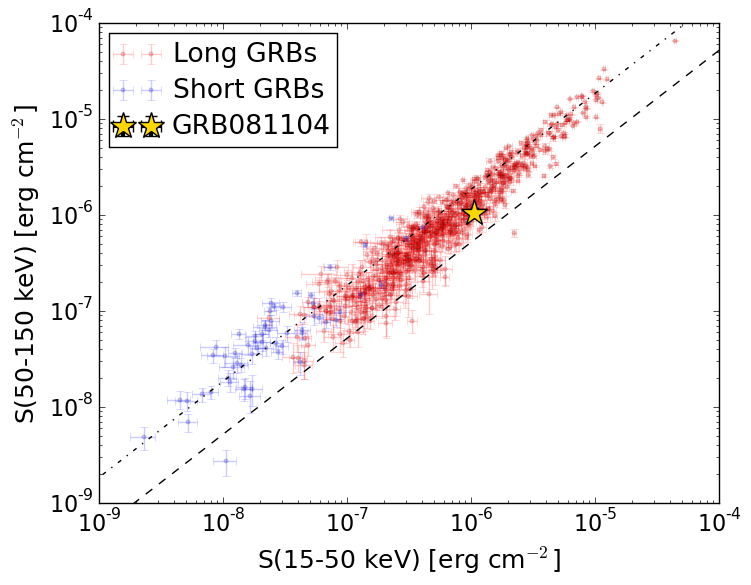
S(15-50 keV)  = 1.0649669e-06
S(50-150 keV) = 1.0370921e-06
The dash-dotted line and the dashed line traces the fluences calculated from the Band function with Epeak = 15 and 150 keV, respectively. Both lines assume a canonical values of alpha = -1 and beta = -2.5.
Mask shadow pattern
IMX = -1.103713398757182E+00, IMY = 5.000866963813672E-02
Spacecraft aspect plot

Bright source in the pre-burst/pre-slew/post-slew images
Pre-burst image of 15-350 keV band
Time interval of the image:
-239.696000 -23.696000

# RAcent  DECcent POSerr Theta    Phi  PeakCts   SNR AngSep     Name
#  [deg]    [deg]    ['] [deg]  [deg]                   [']
264.5327 -44.4278    7.6  46.7  -55.5  -1.2743  -1.5    9.1	4U 1735-44
285.1473 -24.9264    7.9  56.5  -24.9  -1.0723  -1.5    6.1	HT1900.1-2455
322.3384 -16.0893    2.8  54.4   18.9   4.0364   4.2 ------	UNKNOWN
Pre-slew background subtracted image of 15-350 keV band
Time interval of the image:
-23.696000 57.304000

# RAcent  DECcent POSerr Theta    Phi  PeakCts   SNR AngSep     Name
#  [deg]    [deg]    ['] [deg]  [deg]                   [']
265.0034 -44.4183    5.1  46.5  -55.1   0.9956   2.3   11.3	4U 1735-44
284.9932 -25.0098    7.7  56.5  -25.1   0.6532   1.5    5.8	HT1900.1-2455
100.4988 -54.7198    0.6  47.9 -177.4   3.8683  20.3 ------	UNKNOWN
295.9070 -53.1007    2.2  27.9  -35.2   0.5550   5.1 ------	UNKNOWN
Post-slew image of 15-350 keV band
Time interval of the image: