Analysis Summary
Notes:
- 1) No attempt has been made to eliminate the non-significant decimal places.
- 2) This batgrbproduct analysis is done using the HEASARC data.
- 3) This batgrbproduct analysis is using the flight position for the mask-weighting calculation.
======================================================================
                  BAT GRB EVENT DATA PROCESSING REPORT
    Process Script Ver: batgrbproduct v2.46
    Process Start Time: Sun Jan 19 20:49:01 EST 2014
             Host Name: batevent1
   Current Working Dir: /local/data/batevent/batevent_reproc/trigger334112
======================================================================

  Trigger: 00334112      Segment: 000

  BAT Trigger Time: 247906929.856   [s; MET]
      Trigger Stop: 247906930.88   [s; MET]
               UTC: 2008-11-09T07:02:06.614940    [includes UTCF correction]
       Where From?: TDRSS position message

  BAT
    RA: 330.787413462989   Dec: -54.7186309698602  [deg; J2000]

     Catalogged Source?: NO
     Point Source?:      YES
     GRB Indicated?:     YES    [ by BAT flight software ]
     Image S/N Ratio:    9.1
     Image Trigger?:     NO
     Rate S/N Ratio:     14.9331845230681  [ if not an image trigger ]
     Image S/N Ratio:    9.1

  Analysis Position:   [ source = BAT ]
    RA: 330.787413462989   Dec: -54.7186309698602  [deg; J2000]

  Refined Position:   [ source = BAT pre-slew burst ]
    RA: 330.800308250584   Dec: -54.7084162680192  [deg; J2000]
        { 22h 03m 12.1s , -54d 42' 30.3" }
         +/- 0.94305321883769 [arcmin] (estimated 90% radius based on SNR)
         +/- 0.362762483415238 [arcmin] (formal 1-sigma fit error)
    SNR: 33.0746482871109

  Angular difference between the analysis and refined position is 0.758533 arcmin

  Partial Coding Fraction: 0.734375    [ including projection effects ]

  Duration
     T90: 221.487999975681 +/- 58.9712879330521
        Measured from: -36.2560000121593
                   to: 185.231999963522     [s; relative to TRIGTIME]
     T50: 34.9599999785423 +/- 5.8716729948983
        Measured from: -1.84000000357628
                   to: 33.119999974966     [s; relative to TRIGTIME]


  Fluence
     Peak Flux  (peak 1 second)
        Measured from: 7.55599999427795
                   to: 8.55599999427795     [s; relative to TRIGTIME]
     Total Fluence
        Measured from: -80.7520000040531
                   to: 299.775999993086     [s; relative to TRIGTIME]

             Band 1     Band 2     Band 3     Band 4
              15-25      25-50     50-100    100-350     keV
 Total     1.989267   2.584879   1.767380   0.367549
           0.092707   0.096623   0.085504   0.074660 [error]
 Peak      0.048180   0.068829   0.043649   0.011802
           0.006192   0.006598   0.005813   0.004640 [error]

     [ fluence units of on-axis counts / fully illuminated detector ]

======================================================================


====== Table of the duration information =============================

        Value   tstart    tstop
T100  380.528  -80.752  299.776
T90   221.488  -36.256  185.232
T50    34.960   -1.840   33.120
Peak    1.000    7.556    8.556


====== Spectral Analysis Summary =====================================

Model      : spectral model: simple power-law (PL) and cutoff power-law (CPL)
Ph_index   : photon index: E^{Ph_index}
Ph_90err   : 90% error of the photon index
Epeak      : Epeak in keV
Epeak_90err: 90% error of Epeak
Norm       : normalization at 50 keV in both the PL model and CPL model
Nomr_90err : 90% error of the normalization
chi2       : Chi-Squared
dof        : degree of freedo

=== Time-averaged spectral analysis ===
(Best model with acceptable fit: N/A)

Model Ph_index Ph_90err_low Ph_90err_hi  Epeak  Epeak_90err_low  Epeak_90err_hi  Norm       Nomr_90err_low    Norm_90err_hi    chi2    dof
PL      -1.608    -0.085      0.085       -           -               -         1.13e-03     -5.24e-05          5.22e-05      71.710   57
CPL     -1.448    -0.268      0.349      169.706     -84.550      -169.706      1.36e-03     -2.74e-04          6.63e-04      71.020   56


=== 1-s peak spectral analysis ===
(Best model with acceptable fit: PL)

Model Ph_index Ph_90err_low Ph_90err_hi  Epeak  Epeak_90err_low  Epeak_90err_hi  Norm       Nomr_90err_low    Norm_90err_hi    chi2    dof
PL      -1.648     -0.197     0.191       -           -               -         1.08e-02     -1.32e-03          1.30e-03      45.830   57
CPL     -1.448      N/A       N/A         127.363      N/A           N/A         1.39e-02        N/A               N/A         45.640   56


=== Fluence/Peak Flux Summary ===

              Model    Band1     Band2     Band3     Band4     Band5     Total
                       15-25     25-50    50-100    100-350    15-150    15-350    keV
Fluence         PL   6.05e-07  1.04e-06  1.37e-06  3.64e-06  4.00e-06  6.65e-06   erg/cm2
      90%_error_low -4.79e-08 -4.90e-08 -8.52e-08 -4.74e-07 -2.00e-07 -5.40e-07   erg/cm2
      90%_error_hi   4.92e-08  4.89e-08  8.52e-08  5.21e-07  2.01e-07  5.78e-07   erg/cm2
Peak flux       PL   5.14e-01  4.74e-01  3.03e-01  2.97e-01  1.41e+00  1.59e+00   ph/cm2/s
      90%_error_low -8.74e-02 -5.29e-02 -4.77e-02 -8.35e-02 -1.56e-01 -1.78e-01   ph/cm2/s
      90%_error_hi   9.08e-02  5.28e-02  4.74e-02  1.01e-01  1.56e-01  1.79e-01   ph/cm2/s

Fluence        CPL   5.88e-07  1.06e-06  1.38e-06  2.81e-06  3.94e-06  5.83e-06   erg/cm2
      90%_error_low -5.83e-08 -5.75e-08 -8.83e-08 -1.11e-06 -2.35e-07 -1.13e-06   erg/cm2
      90%_error_hi   5.78e-08  5.86e-08  8.93e-08  9.60e-07  2.33e-07  1.03e-06   erg/cm2
Peak flux      CPL   5.01e-01  4.86e-01  3.06e-01  2.26e-01  1.40e+00  1.52e+00   ph/cm2/s
      90%_error_low -1.01e-01 -6.21e-02 -4.95e-02 -1.46e-01 -1.61e-01 -2.29e-01   ph/cm2/s
      90%_error_hi   9.73e-02  7.13e-02  5.09e-02  9.37e-02  1.60e-01  2.36e-01   ph/cm2/s

======================================================================
Image
Pre-slew 15.0-350.0 keV image (Event data)
#   RAcent    DECcent   POSerr    Theta     Phi              Peak Cts       SNR   Name
  330.8003   -54.7084   0.0058    20.3443   -90.0729         3.7472072     33.075 TRIG_00334112

Foreground time interval of the image:
-80.355  13.245 (delta_t =  93.600 [sec])
Background time interval of the image:
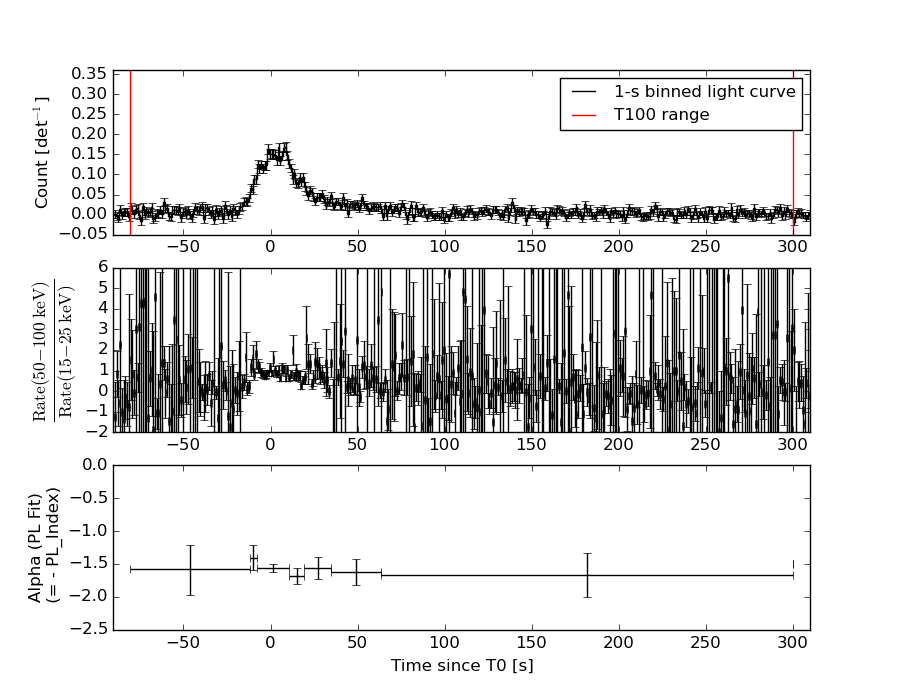
Light Curves
Note: The mask-weighted lightcurves have units of either count/det or counts/sec/det, where a det is 0.4 x 0.4 = 0.16 sq cm.
Full-time range; 1 s binning
Other quick-look light curves:
- 64 ms binning (zoomed)
- 16 ms binning (zoomed)
- 8 ms binning (zoomed)
- 2 ms binning (zoomed)
- SN=5 or 10 s binning (full-time range)
- Raw light curve
Spectra
- 64 ms binning (zoomed)
- 16 ms binning (zoomed)
- 8 ms binning (zoomed)
- 2 ms binning (zoomed)
- SN=5 or 10 s binning (full-time range)
- Raw light curve
Spectra
Notes:
- 1) The fitting includes the systematic errors.
- 2) When the burst includes telescope slew time periods, the fitting uses an average response file made from multiple 5-s response files through out the slew time plus single time preiod for the non-slew times, and weighted by the total counts in the corresponding time period using addrmf. An average response file is needed becuase a spectral fit using the pre-slew DRM will introduce some errors in both a spectral shape and a normalization if the PHA file contains a lot of the slew/post-slew time interval.
- 3) For fits to more complicated models (e.g. a power-law over a cutoff power-law), the BAT team has decided to require a chi-square improvement of more than 6 for each extra dof.
Time averaged spectrum fit using the average DRM
Power-law model
Time interval is from  -80.752 sec. to  299.776 sec.

Spectral model in power-law:
------------------------------------------------------------
Parameters  : value       lower 90%   higher 90%
Photon index: -1.60842     ( -0.0850958   0.0845167 )
Norm@50keV  : 1.12546E-03    ( -5.23581e-05   5.21783e-05 )
------------------------------------------------------------
#Fit statistic : Chi-Squared =          71.71 using 59 PHA bins.
# Reduced chi-squared =          1.258 for     57 degrees of freedom
# Null hypothesis probability =   9.079826e-02

Photon flux (15-150 keV)    in 380.5 sec: 0.145011 ( -0.006749  0.006762 ) ph/cm2/s
Energy fluence (15-150 keV)             : 4.00141e-06 ( -2.00004e-07  2.0125e-07 ) ergs/cm2
Cutoff power-law model
Time interval is from  -80.752 sec. to  299.776 sec.
Spectral model in the cutoff power-law:
------------------------------------------------------------
Parameters  : value       lower 90%   higher 90%
Photon index: -1.44755     ( -0.267527   0.349407 )
Epeak [keV] : 169.706      ( -84.5842 -169.74 )
Norm@50keV  : 1.35705E-03    ( -0.000274057   0.000662928 )
------------------------------------------------------------
#Fit statistic : Chi-Squared =          71.02 using 59 PHA bins.
# Reduced chi-squared =          1.268 for     56 degrees of freedom
# Null hypothesis probability =   8.525306e-02

Photon flux (15-150 keV)    in 380.5 sec: 0.143540 ( -0.007359  0.007356 ) ph/cm2/s
Energy fluence (15-150 keV)             : 3.94152e-06 ( -2.34676e-07  2.3269e-07 ) ergs/cm2
1-s peak spectrum fit
Power-law model
Time interval is from    7.556 sec. to    8.556 sec.

Spectral model in power-law:
------------------------------------------------------------
Parameters  : value       lower 90%   higher 90%
Photon index: -1.64788     ( -0.197198   0.191028 )
Norm@50keV  : 1.08356E-02    ( -0.00132227   0.00130001 )
------------------------------------------------------------
#Fit statistic : Chi-Squared =          45.83 using 59 PHA bins.
# Reduced chi-squared =         0.8040 for     57 degrees of freedom
# Null hypothesis probability =   8.554665e-01

Photon flux (15-150 keV)    in 1 sec: 1.41393 ( -0.15583  0.15588 ) ph/cm2/s
Energy fluence (15-150 keV)             : 1.00811e-07 ( -1.30362e-08  1.32192e-08 ) ergs/cm2
Cutoff power-law model
Time interval is from    7.556 sec. to    8.556 sec.
Spectral model in the cutoff power-law:
------------------------------------------------------------
Parameters  : value       lower 90%   higher 90%
Photon index: -1.44801     (       )
Epeak [keV] : 127.363      (   )
Norm@50keV  : 1.39261E-02    (     )
------------------------------------------------------------
#Fit statistic : Chi-Squared =          45.64 using 59 PHA bins.
# Reduced chi-squared =         0.8150 for     56 degrees of freedom
# Null hypothesis probability =   8.371429e-01

Photon flux (15-150 keV)    in 1 sec: 1.40419 ( -0.16081  0.16018 ) ph/cm2/s
Energy fluence (15-150 keV)             : 9.89578e-08 ( -1.51103e-08  1.33061e-08 ) ergs/cm2
Time-resolved spectra
Distribution
T90 vs. Hardness ratio plot
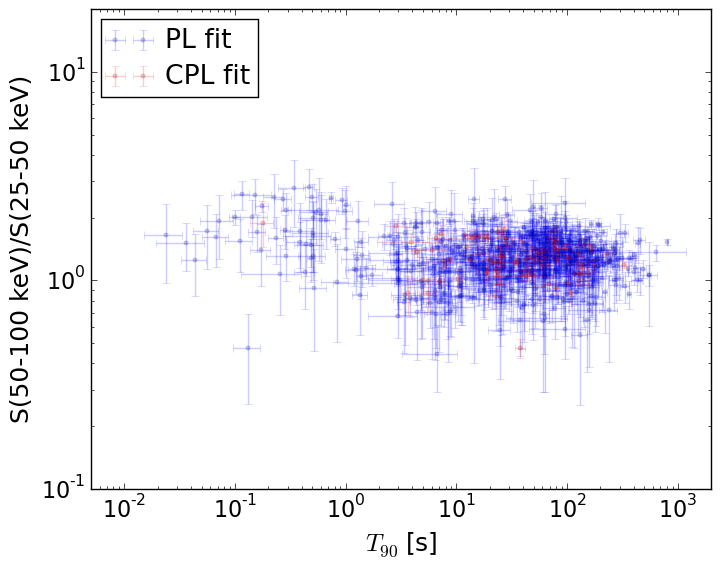
T90                                   = N/A sec.
Hardness ratio (energy fluence ratio) = N/A
S(15-50 keV) vs. S(50-150 keV) plot
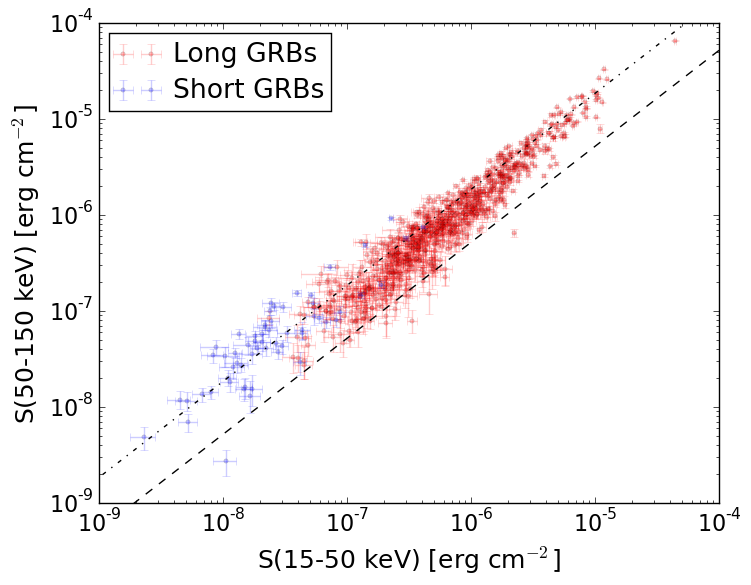
S(15-50 keV)  = N/A
S(50-150 keV) = N/A
The dash-dotted line and the dashed line traces the fluences calculated from the Band function with Epeak = 15 and 150 keV, respectively. Both lines assume a canonical values of alpha = -1 and beta = -2.5.
Mask shadow pattern
IMX = -4.719629474907354E-04, IMY = 3.707903229589902E-01
Spacecraft aspect plot
Bright source in the pre-burst/pre-slew/post-slew images
Pre-burst image of 15-350 keV band
Time interval of the image:
Pre-slew background subtracted image of 15-350 keV band
Time interval of the image:
-80.355410 13.244600

# RAcent  DECcent POSerr Theta    Phi  PeakCts   SNR AngSep     Name
#  [deg]    [deg]    ['] [deg]  [deg]                   [']
 14.1139 -30.7479    2.6  18.7  100.5   0.4998   4.4 ------	UNKNOWN
330.8003 -54.7084    0.3  20.3  -90.1   3.7467  33.1 ------	UNKNOWN
296.3265 -38.9932    2.3  44.4  -61.7   2.0616   5.1 ------	UNKNOWN
294.5503 -54.0417    2.0  41.0  -83.4   2.3087   5.9 ------	UNKNOWN
Post-slew image of 15-350 keV band
Time interval of the image:
55.044620 962.264000

# RAcent  DECcent POSerr Theta    Phi  PeakCts   SNR AngSep     Name
#  [deg]    [deg]    ['] [deg]  [deg]                   [']
276.1380 -30.3007    8.8  45.6  -57.8   3.2014   1.3   11.7	H1820-303
284.8494 -25.0204   11.7  44.8  -44.6   1.2340   1.0   11.8	HT1900.1-2455
294.3946 -34.4913    2.8  32.3  -43.5   1.9580   4.2 ------	UNKNOWN