Analysis Summary
Notes:
- 1) No attempt has been made to eliminate the non-significant decimal places.
- 2) This batgrbproduct analysis is done using the HEASARC data.
- 3) This batgrbproduct analysis is using the flight position for the mask-weighting calculation.
Special note: Due to the low partial coding fraction, the refined position is found using the DETECTION mask. Therefore, the refined position and the mask shadow pattern shown here are from analyses with DETECTION mask, everything else uses the FLUX mask.
======================================================================
BAT GRB EVENT DATA PROCESSING REPORT
Process Script Ver: batgrbproduct v2.46
Process Start Time: Sat May 9 19:06:52 EDT 2015
Host Name: bat1
Current Working Dir: /local/data/bat1/alien/Swift_3rdBATcatalog/event/batevent_reproc/trigger335105
======================================================================
Trigger: 00335105 Segment: 000
BAT Trigger Time: 248992536.128 [s; MET]
Trigger Stop: 248992540.224 [s; MET]
UTC: 2008-11-21T20:35:32.854060 [includes UTCF correction]
Where From?: TDRSS position message
BAT
RA: 89.2636966592357 Dec: -60.6257043407029 [deg; J2000]
Catalogged Source?: NO
Point Source?: YES
GRB Indicated?: YES [ by BAT flight software ]
Image S/N Ratio: 9.79
Image Trigger?: NO
Rate S/N Ratio: 39.319206502675 [ if not an image trigger ]
Image S/N Ratio: 9.79
Analysis Position: [ source = BAT ]
RA: 89.2636966592357 Dec: -60.6257043407029 [deg; J2000]
Refined Position: [ source = BAT pre-slew burst ]
RA: Dec: [deg; J2000]
{ 00h 00m 00.0s , +00d 00' 00.0" }
+/- -inf [arcmin] (estimated 90% radius based on SNR)
+/- 0 [arcmin] (formal 1-sigma fit error)
SNR:
Angular difference between the analysis and refined position is 5378.330478 arcmin
Partial Coding Fraction: 0.05078125 [ including projection effects ]
Duration
T90: 17.5199999511242 +/- 2.00670876082545
Measured from: -3.43199998140335
to: 14.0879999697208 [s; relative to TRIGTIME]
T50: 9.11999997496605 +/- 1.68481214282871
Measured from: 0.631999999284744
to: 9.75199997425079 [s; relative to TRIGTIME]
Fluence
Peak Flux (peak 1 second)
Measured from: 13.580000013113
to: 14.580000013113 [s; relative to TRIGTIME]
Total Fluence
Measured from: -5.30399999022484
to: 14.4560000002384 [s; relative to TRIGTIME]
Band 1 Band 2 Band 3 Band 4
15-25 25-50 50-100 100-350 keV
Total 0.826651 1.979833 2.397285 1.011585
0.126032 0.138277 0.135600 0.110438 [error]
Peak 0.086335 0.142615 0.202693 0.079431
0.029010 0.032773 0.034162 0.027135 [error]
[ fluence units of on-axis counts / fully illuminated detector ]
======================================================================
====== Table of the duration information =============================
Value tstart tstop
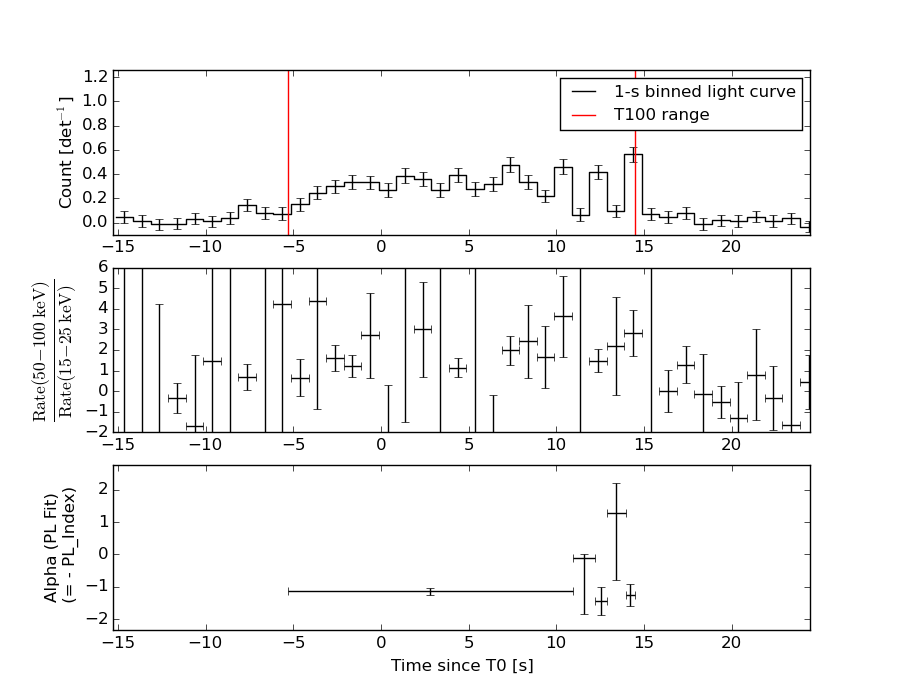
T100 19.760 -5.304 14.456
T90 17.520 -3.432 14.088
T50 9.120 0.632 9.752
Peak 1.000 13.580 14.580
====== Spectral Analysis Summary =====================================
Model : spectral model: simple power-law (PL) and cutoff power-law (CPL)
Ph_index : photon index: E^{Ph_index}
Ph_90err : 90% error of the photon index
Epeak : Epeak in keV
Epeak_90err: 90% error of Epeak
Norm : normalization at 50 keV in both the PL model and CPL model
Nomr_90err : 90% error of the normalization
chi2 : Chi-Squared
dof : degree of freedo
=== Time-averaged spectral analysis ===
(Best model with acceptable fit: PL)
Model Ph_index Ph_90err_low Ph_90err_hi Epeak Epeak_90err_low Epeak_90err_hi Norm Nomr_90err_low Norm_90err_hi chi2 dof
PL -1.088 -0.112 0.115 - - - 2.45e-02 -1.72e-03 1.71e-03 47.740 57
CPL -0.695 -0.431 0.509 208.387 -83.050 -208.387 3.55e-02 -1.15e-02 2.06e-02 45.610 56
=== 1-s peak spectral analysis ===
(Best model with acceptable fit: PL)
Model Ph_index Ph_90err_low Ph_90err_hi Epeak Epeak_90err_low Epeak_90err_hi Norm Nomr_90err_low Norm_90err_hi chi2 dof
PL -1.173 -0.361 0.379 - - - 3.55e-02 -7.68e-03 7.59e-03 52.120 57
CPL -1.118 N/A N/A 933.214 N/A N/A 3.75e-02 N/A N/A 52.120 56
=== Fluence/Peak Flux Summary ===
Model Band1 Band2 Band3 Band4 Band5 Total
15-25 25-50 50-100 100-350 15-150 15-350 keV
Fluence PL 4.21e-07 9.96e-07 1.87e-06 8.54e-06 5.08e-06 1.18e-05 erg/cm2
90%_error_low -5.98e-08 -8.92e-08 -1.26e-07 -1.23e-06 -3.34e-07 -1.28e-06 erg/cm2
90%_error_hi 6.33e-08 8.85e-08 1.26e-07 1.36e-06 3.34e-07 1.39e-06 erg/cm2
Peak flux PL 1.07e+00 1.31e+00 1.16e+00 1.77e+00 4.15e+00 5.31e+00 ph/cm2/s
90%_error_low -4.34e-01 -3.62e-01 -2.61e-01 -7.23e-01 -9.47e-01 -1.12e+00 ph/cm2/s
90%_error_hi 5.08e-01 3.51e-01 2.56e-01 9.64e-01 9.56e-01 1.13e+00 ph/cm2/s
Fluence CPL 3.73e-07 1.01e-06 1.98e-06 5.66e-06 5.05e-06 9.01e-06 erg/cm2
90%_error_low -7.71e-08 -9.38e-08 -1.70e-07 -2.05e-06 -3.39e-07 -2.03e-06 erg/cm2
90%_error_hi 8.21e-08 9.44e-08 1.73e-07 3.30e-06 3.38e-07 3.28e-06 erg/cm2
Peak flux CPL 1.05e+00 1.31e+00 1.17e+00 1.81e+00 4.14e+00 5.22e+00 ph/cm2/s
90%_error_low -6.20e-01 -3.59e-01 -2.68e-01 -1.81e+00 -9.78e-01 -1.83e+00 ph/cm2/s
90%_error_hi 3.73e-01 3.95e-01 4.08e-01 4.69e-01 9.21e-01 1.20e+00 ph/cm2/s
======================================================================
Image
Pre-slew 15.0-350.0 keV image (Event data; DETECTION mask)
#   RAcent    DECcent   POSerr    Theta     Phi              Peak Cts       SNR   Name
89.264 -60.626 0.000 57.735 -9.270 5.718 23.499 TRIG_00335105

Image time interval: -5.304 to 14.456 [sec]
Light Curves
Note: The mask-weighted lightcurves have units of either count/det or counts/sec/det, where a det is 0.4 x 0.4 = 0.16 sq cm.
Full-time range; 1 s binning
Other quick-look light curves:
- 64 ms binning (zoomed)
- 16 ms binning (zoomed)
- 8 ms binning (zoomed)
- 2 ms binning (zoomed)
- SN=5 or 10 s binning (full-time range)
- Raw light curve
Spectra
- 64 ms binning (zoomed)
- 16 ms binning (zoomed)
- 8 ms binning (zoomed)
- 2 ms binning (zoomed)
- SN=5 or 10 s binning (full-time range)
- Raw light curve
Spectra
Notes:
- 1) The fitting includes the systematic errors.
- 2) When the burst includes telescope slew time periods, the fitting uses an average response file made from multiple 5-s response files through out the slew time plus single time preiod for the non-slew times, and weighted by the total counts in the corresponding time period using addrmf. An average response file is needed becuase a spectral fit using the pre-slew DRM will introduce some errors in both a spectral shape and a normalization if the PHA file contains a lot of the slew/post-slew time interval.
- 3) For fits to more complicated models (e.g. a power-law over a cutoff power-law), the BAT team has decided to require a chi-square improvement of more than 6 for each extra dof.
Time averaged spectrum fit using the average DRM
Power-law model
Time interval is from   -5.304 sec. to   14.456 sec.

Spectral model in power-law:
------------------------------------------------------------
Parameters  : value       lower 90%   higher 90%
Photon index: -1.0881     ( -0.112278   0.115059 )
Norm@50keV  : 2.44966E-02    ( -0.00172134   0.0017071 )
------------------------------------------------------------
#Fit statistic : Chi-Squared =          47.74 using 59 PHA bins.
# Reduced chi-squared =         0.8376 for     57 degrees of freedom
# Null hypothesis probability =   8.038973e-01

Photon flux (15-150 keV)    in 19.76 sec: 2.83825 ( -0.21057  0.21187 ) ph/cm2/s
Energy fluence (15-150 keV)             : 5.08085e-06 ( -3.34203e-07  3.34505e-07 ) ergs/cm2
Cutoff power-law model
Time interval is from   -5.304 sec. to   14.456 sec.
Spectral model in the cutoff power-law:
------------------------------------------------------------
Parameters  : value       lower 90%   higher 90%
Photon index: -0.694585     ( -0.431476   0.508788 )
Epeak [keV] : 208.387      ( -83.0502 -208.387 )
Norm@50keV  : 3.54624E-02    ( -0.0115361   0.0205984 )
------------------------------------------------------------
#Fit statistic : Chi-Squared =          45.61 using 59 PHA bins.
# Reduced chi-squared =         0.8145 for     56 degrees of freedom
# Null hypothesis probability =   8.379210e-01

Photon flux (15-150 keV)    in 19.76 sec: 2.78903 ( -0.2163  0.21835 ) ph/cm2/s
Energy fluence (15-150 keV)             : 5.05461e-06 ( -3.39226e-07  3.38473e-07 ) ergs/cm2
1-s peak spectrum fit
Power-law model

Time interval is from   13.580 sec. to   14.580 sec.

Spectral model in power-law:
------------------------------------------------------------
Parameters  : value       lower 90%   higher 90%
Photon index: -1.17324     ( -0.360898   0.378768 )
Norm@50keV  : 3.54846E-02    ( -0.00767654   0.00758637 )
------------------------------------------------------------
#Fit statistic : Chi-Squared =          52.12 using 59 PHA bins.
# Reduced chi-squared =         0.9143 for     57 degrees of freedom
# Null hypothesis probability =   6.584082e-01

Photon flux (15-150 keV)    in 1 sec: 4.15018 ( -0.94664  0.95606 ) ph/cm2/s
Energy fluence (15-150 keV)             : 3.62819e-07 ( -7.86806e-08  7.87616e-08 ) ergs/cm2
Cutoff power-law model
Time interval is from   13.580 sec. to   14.580 sec.
Spectral model in the cutoff power-law:
------------------------------------------------------------
Parameters  : value       lower 90%   higher 90%
Photon index: -1.11841     (       )
Epeak [keV] : 933.214      (   )
Norm@50keV  : 3.75315E-02    (     )
------------------------------------------------------------
#Fit statistic : Chi-Squared =          52.12 using 59 PHA bins.
# Reduced chi-squared =         0.9306 for     56 degrees of freedom
# Null hypothesis probability =   6.226614e-01

Photon flux (15-150 keV)    in 1 sec: 4.14445 ( -0.97751  0.92078 ) ph/cm2/s
Energy fluence (15-150 keV)             : 3.62493e-07 ( -8.03495e-08  7.74536e-08 ) ergs/cm2
Time-resolved spectra
Distribution
T90 vs. Hardness ratio plot
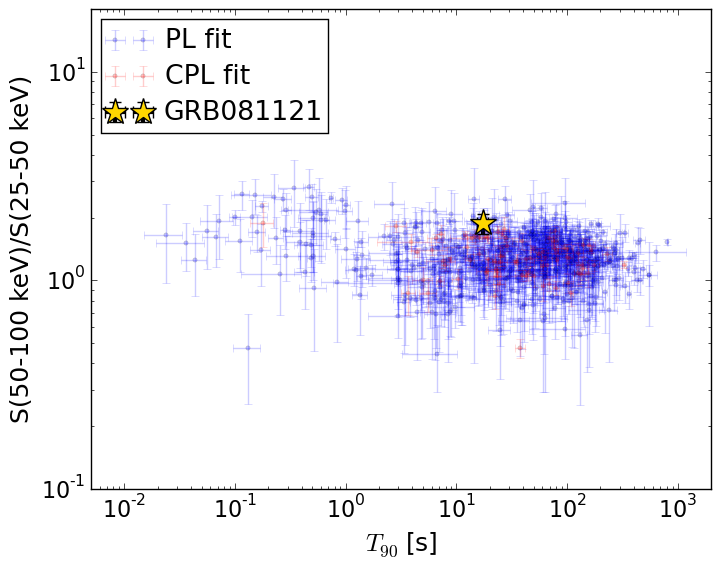
T90                                   = 17.52 sec.
Hardness ratio (energy fluence ratio) = 1.88152473769
S(15-50 keV) vs. S(50-150 keV) plot
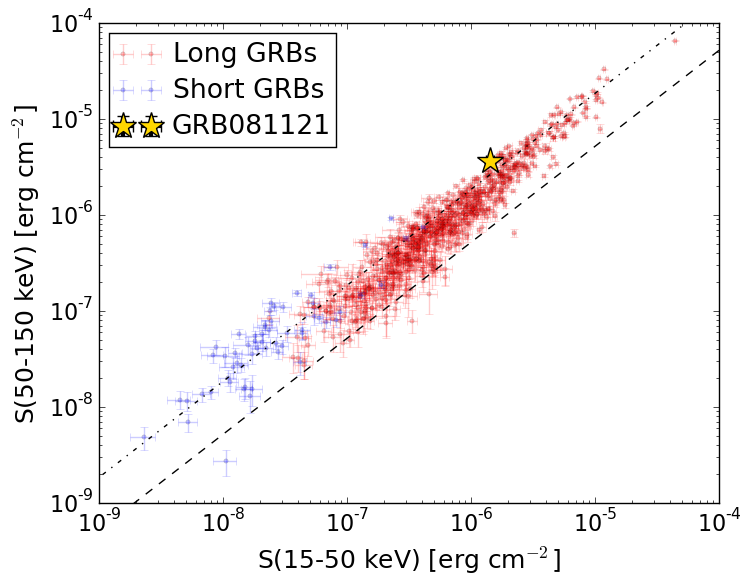
S(15-50 keV)  = 1.4169526e-06
S(50-150 keV) = 3.663851e-06
The dash-dotted line and the dashed line traces the fluences calculated from the Band function with Epeak = 15 and 150 keV, respectively. Both lines assume a canonical values of alpha = -1 and beta = -2.5.
Mask shadow pattern (with DETECTION mask)
IMX = 1.56329747719, IMY = 0.255147024436
Spacecraft aspect plot
Bright source in the pre-burst/pre-slew/post-slew images
Pre-burst image of 15-350 keV band
Time interval of the image:
-147.827410 -5.304000

# RAcent  DECcent POSerr Theta    Phi  PeakCts   SNR AngSep     Name
#  [deg]    [deg]    ['] [deg]  [deg]                   [']
135.5321 -40.5677    0.9  28.4  -37.5   1.6761  12.2    0.8	Vela X-1
148.0100  16.0640    2.7  32.2  176.1   0.5865   4.3 ------	UNKNOWN
Pre-slew background subtracted image of 15-350 keV band
Time interval of the image:
-5.304000 14.456000

# RAcent  DECcent POSerr Theta    Phi  PeakCts   SNR AngSep     Name
#  [deg]    [deg]    ['] [deg]  [deg]                   [']
135.6961 -40.5919    5.1  28.5  -37.7  -0.1201  -2.3    8.0	Vela X-1
 83.3672 -37.0878    2.9  50.4   18.9   0.7495   4.0 ------	UNKNOWN
132.6114  -0.7608    2.9  11.5  147.6   0.1813   4.0 ------	UNKNOWN
163.4053  35.5555    2.2  56.0  177.5   1.2796   5.3 ------	UNKNOWN
 89.2747 -60.6111    0.6  57.7   -9.3   6.6229  19.7 ------	UNKNOWN
121.1387 -57.0913    2.3  45.7  -24.1   0.4432   4.9 ------	UNKNOWN
179.0069  -4.7930    1.7  46.5 -127.8   1.2206   6.8 ------	UNKNOWN
Post-slew image of 15-350 keV band
Time interval of the image:
369.772600 962.975500

# RAcent  DECcent POSerr Theta    Phi  PeakCts   SNR AngSep     Name
#  [deg]    [deg]    ['] [deg]  [deg]                   [']
254.4425  35.3601    2.6  54.9 -160.3   4.5107   4.4    1.3	Her X-1
163.0831  36.1246    3.0  19.3   56.5   1.1907   3.8 ------	UNKNOWN
171.0821  30.7607    3.3  13.3   34.3   0.9947   3.5 ------	UNKNOWN