Analysis Summary
Notes:
- 1) No attempt has been made to eliminate the non-significant decimal places.
- 2) This batgrbproduct analysis is done using the HEASARC data.
- 3) This batgrbproduct analysis is using the flight position for the mask-weighting calculation.
======================================================================
                  BAT GRB EVENT DATA PROCESSING REPORT
    Process Script Ver: batgrbproduct v2.46
    Process Start Time: Thu Sep 11 12:49:26 EDT 2014
             Host Name: batevent1
   Current Working Dir: /local/data/batevent/batevent_reproc/trigger335647
======================================================================

  Trigger: 00335647      Segment: 000

  BAT Trigger Time: 249428053.568   [s; MET]
      Trigger Stop: 249428054.592   [s; MET]
               UTC: 2008-11-26T21:34:10.280820    [includes UTCF correction]
       Where From?: TDRSS position message

  BAT
    RA: 323.541872169791   Dec: 48.7093541229447  [deg; J2000]

     Catalogged Source?: NO
     Point Source?:      YES
     GRB Indicated?:     YES    [ by BAT flight software ]
     Image S/N Ratio:    14.45
     Image Trigger?:     NO
     Rate S/N Ratio:     44.2831796509691  [ if not an image trigger ]
     Image S/N Ratio:    14.45

  Analysis Position:   [ source = BAT ]
    RA: 323.541872169791   Dec: 48.7093541229447  [deg; J2000]

  Refined Position:   [ source = BAT pre-slew burst ]
    RA: 323.522116127488   Dec: 48.7139383556857  [deg; J2000]
        { 21h 34m 05.3s , +48d 42' 50.2" }
         +/- 0.826704679421499 [arcmin] (estimated 90% radius based on SNR)
         +/- 0.301151601178795 [arcmin] (formal 1-sigma fit error)
    SNR: 39.9198814605241

  Angular difference between the analysis and refined position is 0.829114 arcmin

  Partial Coding Fraction: 0.6796875    [ including projection effects ]

  Duration
     T90: 57.6480000019073 +/- 5.84667323042645
        Measured from: -17.783999979496
                   to: 39.8640000224113     [s; relative to TRIGTIME]
     T50: 31.4399999976158 +/- 0.452866415824261
        Measured from: -0.183999985456467
                   to: 31.2560000121593     [s; relative to TRIGTIME]


  Fluence
     Peak Flux  (peak 1 second)
        Measured from: 0.752000004053116
                   to: 1.75200000405312     [s; relative to TRIGTIME]
     Total Fluence
        Measured from: -21.527999997139
                   to: 56.9120000004768     [s; relative to TRIGTIME]

             Band 1     Band 2     Band 3     Band 4
              15-25      25-50     50-100    100-350     keV
 Total     1.101600   1.796884   1.700388   0.527732
           0.052394   0.055005   0.049074   0.041008 [error]
 Peak      0.088494   0.156951   0.174945   0.064264
           0.007555   0.008779   0.008971   0.006745 [error]

     [ fluence units of on-axis counts / fully illuminated detector ]

======================================================================


====== Table of the duration information =============================

        Value   tstart    tstop
T100   78.440  -21.528   56.912
T90    57.648  -17.784   39.864
T50    31.440   -0.184   31.256
Peak    1.000    0.752    1.752


====== Spectral Analysis Summary =====================================

Model      : spectral model: simple power-law (PL) and cutoff power-law (CPL)
Ph_index   : photon index: E^{Ph_index}
Ph_90err   : 90% error of the photon index
Epeak      : Epeak in keV
Epeak_90err: 90% error of Epeak
Norm       : normalization at 50 keV in both the PL model and CPL model
Nomr_90err : 90% error of the normalization
chi2       : Chi-Squared
dof        : degree of freedo

=== Time-averaged spectral analysis ===
(Best model with acceptable fit: PL)

Model Ph_index Ph_90err_low Ph_90err_hi  Epeak  Epeak_90err_low  Epeak_90err_hi  Norm       Nomr_90err_low    Norm_90err_hi    chi2    dof
PL      -1.206    -0.062      0.063       -           -               -         4.35e-03     -1.45e-04          1.45e-04      46.690   57
CPL     -1.060    -0.187      0.252      366.222    -366.222      -366.222      5.05e-03     -7.93e-04          1.44e-03      45.620   56


=== 1-s peak spectral analysis ===
(Best model with acceptable fit: PL)

Model Ph_index Ph_90err_low Ph_90err_hi  Epeak  Epeak_90err_low  Epeak_90err_hi  Norm       Nomr_90err_low    Norm_90err_hi    chi2    dof
PL      -0.988     -0.099     0.100       -           -               -         3.22e-02     -1.81e-03          1.81e-03      47.070   57
CPL     -0.799     -0.259     0.407      366.374    -366.374      -366.374      3.90e-02     -8.22e-03          1.94e-02      46.350   56


=== Fluence/Peak Flux Summary ===

              Model    Band1     Band2     Band3     Band4     Band5     Total
                       15-25     25-50    50-100    100-350    15-150    15-350    keV
Fluence         PL   3.31e-07  7.28e-07  1.26e-06  5.08e-06  3.45e-06  7.40e-06   erg/cm2
      90%_error_low -2.29e-08 -2.96e-08 -4.88e-08 -4.48e-07 -1.24e-07 -4.73e-07   erg/cm2
      90%_error_hi   2.35e-08  2.95e-08  4.86e-08  4.79e-07  1.24e-07  4.98e-07   erg/cm2
Peak flux       PL   8.12e-01  1.11e+00  1.12e+00  2.05e+00  3.70e+00  5.09e+00   ph/cm2/s
      90%_error_low -9.19e-02 -7.74e-02 -6.98e-02 -2.66e-01 -2.11e-01 -3.21e-01   ph/cm2/s
      90%_error_hi   9.57e-02  7.68e-02  6.94e-02  2.91e-01  2.11e-01  3.28e-01   ph/cm2/s

Fluence        CPL   3.19e-07  7.34e-07  1.28e-06  4.17e-06  3.42e-06  6.50e-06   erg/cm2
      90%_error_low -2.96e-08 -3.14e-08 -5.60e-08 -1.13e-06 -1.34e-07 -1.13e-06   erg/cm2
      90%_error_hi   3.01e-08  3.16e-08  5.68e-08  1.22e-06  1.33e-07  1.06e-06   erg/cm2
Peak flux      CPL   7.73e-01  1.12e+00  1.15e+00  1.68e+00  3.67e+00  4.72e+00   ph/cm2/s
      90%_error_low -1.18e-01 -8.15e-02 -8.57e-02 -5.34e-01 -2.18e-01 -5.80e-01   ph/cm2/s
      90%_error_hi   1.11e-01  8.24e-02  8.76e-02  4.50e-01  2.17e-01  5.33e-01   ph/cm2/s

======================================================================
Image
Pre-slew 15.0-350.0 keV image (Event data)
#   RAcent    DECcent   POSerr    Theta     Phi              Peak Cts       SNR   Name
  323.5221    48.7139   0.0048    19.9341    72.9909         3.0674038     39.920 TRIG_00335647

Foreground time interval of the image:
-21.528  11.333 (delta_t =  32.861 [sec])
Background time interval of the image:
-239.568 -21.528 (delta_t = 218.040 [sec])
Light Curves
Note: The mask-weighted lightcurves have units of either count/det or counts/sec/det, where a det is 0.4 x 0.4 = 0.16 sq cm.
Full-time range; 1 s binning
Other quick-look light curves:
- 64 ms binning (zoomed)
- 16 ms binning (zoomed)
- 8 ms binning (zoomed)
- 2 ms binning (zoomed)
- SN=5 or 10 s binning (full-time range)
- Raw light curve
Spectra
- 64 ms binning (zoomed)
- 16 ms binning (zoomed)
- 8 ms binning (zoomed)
- 2 ms binning (zoomed)
- SN=5 or 10 s binning (full-time range)
- Raw light curve
Spectra
Notes:
- 1) The fitting includes the systematic errors.
- 2) When the burst includes telescope slew time periods, the fitting uses an average response file made from multiple 5-s response files through out the slew time plus single time preiod for the non-slew times, and weighted by the total counts in the corresponding time period using addrmf. An average response file is needed becuase a spectral fit using the pre-slew DRM will introduce some errors in both a spectral shape and a normalization if the PHA file contains a lot of the slew/post-slew time interval.
- 3) For fits to more complicated models (e.g. a power-law over a cutoff power-law), the BAT team has decided to require a chi-square improvement of more than 6 for each extra dof.
Time averaged spectrum fit using the average DRM
Power-law model
Time interval is from  -21.528 sec. to   56.912 sec.

Spectral model in power-law:
------------------------------------------------------------
Parameters  : value       lower 90%   higher 90%
Photon index: -1.20609     ( -0.0622731   0.0626119 )
Norm@50keV  : 4.34667E-03    ( -0.000145001   0.000144889 )
------------------------------------------------------------
#Fit statistic : Chi-Squared =          46.69 using 59 PHA bins.
# Reduced chi-squared =         0.8192 for     57 degrees of freedom
# Null hypothesis probability =   8.332612e-01

Photon flux (15-150 keV)    in 78.44 sec: 0.510654 ( -0.018109  0.018149 ) ph/cm2/s
Energy fluence (15-150 keV)             : 3.45356e-06 ( -1.23538e-07  1.23836e-07 ) ergs/cm2
Cutoff power-law model
Time interval is from  -21.528 sec. to   56.912 sec.
Spectral model in the cutoff power-law:
------------------------------------------------------------
Parameters  : value       lower 90%   higher 90%
Photon index: -1.0604     ( -0.187152   0.251706 )
Epeak [keV] : 366.222      ( -366.222 -366.222 )
Norm@50keV  : 5.04801E-03    ( -0.000793094   0.001439 )
------------------------------------------------------------
#Fit statistic : Chi-Squared =          45.62 using 59 PHA bins.
# Reduced chi-squared =         0.8147 for     56 degrees of freedom
# Null hypothesis probability =   8.375682e-01

Photon flux (15-150 keV)    in 78.44 sec: 0.506054 ( -0.019534  0.019569 ) ph/cm2/s
Energy fluence (15-150 keV)             : 3.42285e-06 ( -1.34198e-07  1.33446e-07 ) ergs/cm2
1-s peak spectrum fit
Power-law model
Time interval is from    0.752 sec. to    1.752 sec.

Spectral model in power-law:
------------------------------------------------------------
Parameters  : value       lower 90%   higher 90%
Photon index: -0.988378     ( -0.0989733   0.0999745 )
Norm@50keV  : 3.21506E-02    ( -0.0018103   0.00180728 )
------------------------------------------------------------
#Fit statistic : Chi-Squared =          47.07 using 59 PHA bins.
# Reduced chi-squared =         0.8259 for     57 degrees of freedom
# Null hypothesis probability =   8.228669e-01

Photon flux (15-150 keV)    in 1 sec: 3.69930 ( -0.21085  0.21101 ) ph/cm2/s
Energy fluence (15-150 keV)             : 3.4914e-07 ( -2.18295e-08  2.1925e-08 ) ergs/cm2
Cutoff power-law model
Time interval is from    0.752 sec. to    1.752 sec.
Spectral model in the cutoff power-law:
------------------------------------------------------------
Parameters  : value       lower 90%   higher 90%
Photon index: -0.799313     ( -0.25854   0.407337 )
Epeak [keV] : 366.374      ( -366.374 -366.374 )
Norm@50keV  : 3.90403E-02    ( -0.00822051   0.0193895 )
------------------------------------------------------------
#Fit statistic : Chi-Squared =          46.35 using 59 PHA bins.
# Reduced chi-squared =         0.8277 for     56 degrees of freedom
# Null hypothesis probability =   8.175752e-01

Photon flux (15-150 keV)    in 1 sec: 3.67241 ( -0.21762  0.21744 ) ph/cm2/s
Energy fluence (15-150 keV)             : 3.46131e-07 ( -2.29246e-08  2.27956e-08 ) ergs/cm2
Time-resolved spectra
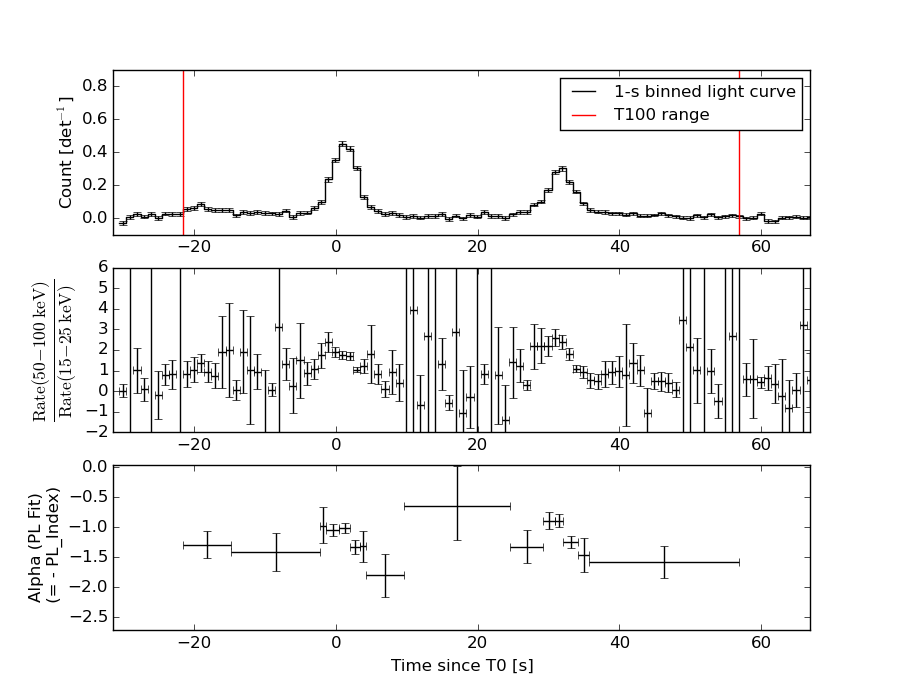
Distribution
T90 vs. Hardness ratio plot
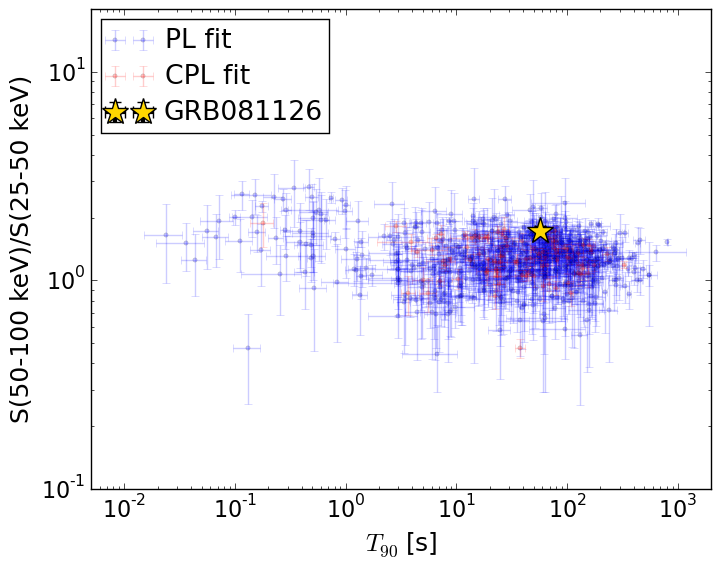
T90                                   = 57.648 sec.
Hardness ratio (energy fluence ratio) = 1.73380352808
S(15-50 keV) vs. S(50-150 keV) plot
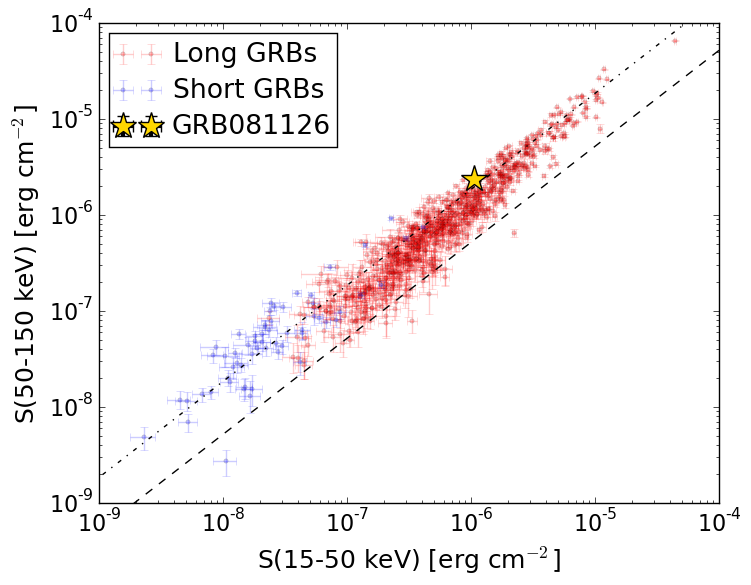
S(15-50 keV)  = 1.0588044e-06
S(50-150 keV) = 2.394777e-06
The dash-dotted line and the dashed line traces the fluences calculated from the Band function with Epeak = 15 and 150 keV, respectively. Both lines assume a canonical values of alpha = -1 and beta = -2.5.
Mask shadow pattern
IMX = 1.060888796040506E-01, IMY = -3.468050399278023E-01
Spacecraft aspect plot
Bright source in the pre-burst/pre-slew/post-slew images
Pre-burst image of 15-350 keV band
Time interval of the image:
-239.568000 -21.528000

# RAcent  DECcent POSerr Theta    Phi  PeakCts   SNR AngSep     Name
#  [deg]    [deg]    ['] [deg]  [deg]                   [']
254.4596  35.3451    1.8  37.7  -50.9   2.0342   6.2    0.2	Her X-1
288.7955  10.9375    0.9  28.3 -126.0   3.1915  13.4    0.5	GRS 1915+105
299.5955  35.2014    0.2   2.2 -107.0  10.3016  57.9    0.3	Cyg X-1
308.0033  40.7576    0.0   6.4   76.2   0.2146   1.2   12.7	Cyg X-3
326.2592  38.1915    5.1  19.6  105.0   0.5146   2.2    8.8	Cyg X-2
284.2068  28.4307    2.3  16.8  -88.0   0.9480   5.1 ------	UNKNOWN
309.7055 -20.9728    2.1  58.3 -162.2   5.9991   5.5 ------	UNKNOWN
291.0328  -5.5561    2.9  43.5 -137.9   1.4537   3.9 ------	UNKNOWN
268.9864   7.9682    3.1  41.3  -99.4   3.7500   3.7 ------	UNKNOWN
Pre-slew background subtracted image of 15-350 keV band
Time interval of the image:
-21.528000 11.332620

# RAcent  DECcent POSerr Theta    Phi  PeakCts   SNR AngSep     Name
#  [deg]    [deg]    ['] [deg]  [deg]                   [']
254.3911  35.2643   14.6  37.8  -51.0  -0.0908  -0.8    5.7	Her X-1
288.8460  11.1288    0.0  28.1 -126.0  -0.1852  -2.3   11.3	GRS 1915+105
299.5976  35.2045   15.7   2.2 -107.0  -0.0453  -0.7    0.4	Cyg X-1
307.9237  41.0555   13.2   6.5   73.7   0.0560   0.9   10.5	Cyg X-3
325.9962  38.2462    8.7  19.4  104.9   0.1010   1.3    9.4	Cyg X-2
323.5221  48.7139    0.3  19.9   73.0   3.0674  39.9 ------	UNKNOWN
266.2687  63.1668    2.3  34.0   -1.1   0.4182   5.0 ------	UNKNOWN
251.0601  25.9289    3.0  44.0  -62.7   1.0741   3.8 ------	UNKNOWN
Post-slew image of 15-350 keV band
Time interval of the image:
54.932600 542.442000

# RAcent  DECcent POSerr Theta    Phi  PeakCts   SNR AngSep     Name
#  [deg]    [deg]    ['] [deg]  [deg]                   [']
299.5977  35.2082    0.6  22.2  -97.4  21.9516  20.9    0.5	Cyg X-1
308.3573  40.9380   10.5  13.2  -99.1   1.0661   1.1   11.2	Cyg X-3
326.2009  38.4068    5.2  10.5 -170.5   2.0889   2.2    5.3	Cyg X-2
247.9721  73.7942    2.9  39.9   -3.7   5.7144   4.0 ------	UNKNOWN
337.5949  -5.5138    2.3  55.6 -175.8  22.2924   5.1 ------	UNKNOWN
286.2697  20.1329    2.8  41.2  -99.2  16.4374   4.1 ------	UNKNOWN