Analysis Summary
Notes:
- 1) No attempt has been made to eliminate the non-significant decimal places.
- 2) This batgrbproduct analysis is done using the HEASARC data.
- 3) This batgrbproduct analysis is using the flight position for the mask-weighting calculation.
==========================================================================
           BAT GROUND-DETECTED GRB DATA PROCESSING REPORT
            (This burst occurred during telescope slew)
    Process Script Ver: batgrbproduct v2.46
    Process Start Time: Tue Nov 11 10:27:46 EST 2014
             Host Name: bat1
   Current Working Dir: /local/data/bat1/alien/Swift_3rdBATcatalog/event/batevent_reproc/GRB081203B
======================================================================

  Trigger: 00336489      Segment: 000

  BAT Trigger Time: 250005073.6
               UTC: 2008-12-03T13:51:10.295   [includes UTCF correction]
       Where From?: Ground analysis (best_duration.txt)
  NOTE: BAT trigger time for ground-detected burst during slew is the T100 start time.

  Refined Position:   [ source = BAT mosaic image ]
    RA: 228.777643512081   Dec: 44.4213141022708  [deg; J2000]
        { 15h 15m 06.6s , +44d 25' 16.7" }
        +/- 2.19924039821 [arcmin] (estimated 90% radius based on SNR)
    SNR: 9.86766032176


  Angular difference between the analysis and refined position is Usage: arcmin

  Partial Coding Fraction: Unavailable because the burst occurred during slew.

  Duration
     T90: 161.600000023842 +/- 1.6
        Measured from: 8
                   to: 169.6     [s; relative to TRIGTIME]
     T50: 88.0000000298023 +/- 1.6
        Measured from: 41.6
                   to: 129.6     [s; relative to TRIGTIME]


====== Table of the duration information =============================

        Value   tstart    tstop
T100  177.600    0.000  177.600
T90   161.600    8.000  169.600
T50    88.000   41.600  129.600
Peak    1.000   32.300   33.300


====== Spectral Analysis Summary =====================================

Model      : spectral model: simple power-law (PL) and cutoff power-law (CPL)
Ph_index   : photon index: E^{Ph_index}
Ph_90err   : 90% error of the photon index
Epeak      : Epeak in keV
Epeak_90err: 90% error of Epeak
Norm       : normalization at 50 keV in both the PL model and CPL model
Nomr_90err : 90% error of the normalization
chi2       : Chi-Squared
dof        : degree of freedo

=== Time-averaged spectral analysis ===
(Best model with acceptable fit: PL)

Model Ph_index Ph_90err_low Ph_90err_hi  Epeak  Epeak_90err_low  Epeak_90err_hi  Norm       Nomr_90err_low    Norm_90err_hi    chi2    dof
PL      -1.690    -0.139      0.136       -           -               -         2.65e-03     -1.91e-04          1.89e-04      51.690   57
CPL     -1.687    -0.142      0.135     9999.360    -9999.350      -9999.360      2.66e-03     -2.30e-03          -1.24e-03      51.730   56


=== 1-s peak spectral analysis ===
(Best model with acceptable fit: N/A)

Model Ph_index Ph_90err_low Ph_90err_hi  Epeak  Epeak_90err_low  Epeak_90err_hi  Norm       Nomr_90err_low    Norm_90err_hi    chi2    dof
PL      N/A         N/A       N/A          -           -               -           N/A           N/A               N/A         N/A        N/A
CPL     N/A         N/A       N/A          N/A         N/A           N/A           N/A           N/A               N/A         N/A        N/A


=== Fluence/Peak Flux Summary ===

              Model    Band1     Band2     Band3     Band4     Band5     Total
                       15-25     25-50    50-100    100-350    15-150    15-350    keV
Fluence         PL   4.58e-07  7.50e-07  9.30e-07  2.28e-06  2.78e-06  4.42e-06   erg/cm2
      90%_error_low -5.72e-08 -5.45e-08 -9.18e-08 -4.63e-07 -2.10e-07 -5.33e-07   erg/cm2
      90%_error_hi   5.96e-08  5.42e-08  9.07e-08  5.37e-07  2.11e-07  5.89e-07   erg/cm2
Peak flux       PL     N/A      N/A      N/A      N/A      N/A      N/A     ph/cm2/s
Image
Note1: The mosaic image is made with timebin = 0.50 s; energybin = 15-350 keV
Note2: The mosaic image uses Galactic coordinate.
#RAcent DECcent POSerr Theta  Phi  Peak_Cts  SNR Name
228.778 44.421 0.007 29.955 16.462 0.011 9.868 UNKNOWN

Image time interval: 0.000 to 177.600 [sec]
Light Curves
Note: The mask-weighted lightcurves have units of either count/det or counts/sec/det, where a det is 0.4 x 0.4 = 0.16 sq cm.
Best duration plot

Full-time range; 1 s binning
Other quick-look light curves:
- 64 ms binning (zoomed)
- 16 ms binning (zoomed)
- 8 ms binning (zoomed)
- 2 ms binning (zoomed)
- SN=5 or 10 s binning (full-time range)
- Raw light curve
Spectra
- 64 ms binning (zoomed)
- 16 ms binning (zoomed)
- 8 ms binning (zoomed)
- 2 ms binning (zoomed)
- SN=5 or 10 s binning (full-time range)
- Raw light curve
Spectra
Notes:
- 1) The fitting includes the systematic errors.
- 2) When the burst includes telescope slew time periods, the fitting uses an average response file made from multiple 5-s response files through out the slew time plus single time preiod for the non-slew times, and weighted by the total counts in the corresponding time period using addrmf. An average response file is needed becuase a spectral fit using the pre-slew DRM will introduce some errors in both a spectral shape and a normalization if the PHA file contains a lot of the slew/post-slew time interval.
- 3) For fits to more complicated models (e.g. a power-law over a cutoff power-law), the BAT team has decided to require a chi-square improvement of more than 6 for each extra dof.
Time averaged spectrum fit using the average DRM
Power-law model
Time interval is from   64.400 sec. to  177.600 sec.

Spectral model in power-law:
------------------------------------------------------------
Parameters  : value       lower 90%   higher 90%
Photon index: -1.69001     ( -0.138514   0.136295 )
Norm@50keV  : 2.65222E-03    ( -0.000190555   0.000188928 )
------------------------------------------------------------
#Fit statistic : Chi-Squared =          51.69 using 59 PHA bins.
# Reduced chi-squared =         0.9068 for     57 degrees of freedom
# Null hypothesis probability =   6.739070e-01

Photon flux (15-150 keV)    in 113.2 sec: 0.351039 ( -0.025563  0.025705 ) ph/cm2/s
Energy fluence (15-150 keV)             : 2.78244e-06 ( -2.0988e-07  2.10966e-07 ) ergs/cm2
Cutoff power-law model
Time interval is from   64.400 sec. to  177.600 sec.
Spectral model in the cutoff power-law:
------------------------------------------------------------
Parameters  : value       lower 90%   higher 90%
Photon index: -2.70974     ( -0.141444   0.1349 )
Epeak [keV] : 234.869      ( -9999.35 -9999.36 )
Norm@50keV  : 8.41988E-04    ( -0.000484526   0.000582559 )
------------------------------------------------------------
#Fit statistic : Chi-Squared =          43.75 using 59 PHA bins.
# Reduced chi-squared =         0.7813 for     56 degrees of freedom
# Null hypothesis probability =   8.829536e-01

Photon flux (15-150 keV)    in 113.2 sec: 0.351058 ( -0.025628  0.025655 ) ph/cm2/s
Energy fluence (15-150 keV)             : 1.84386e-06 ( -3.19959e-07  2.84998e-07 ) ergs/cm2
1-s peak spectrum fit
1-s peak spectrum unavailable, likely because there are no event data in the 1-s peak range.
Time-resolved spectra

Distribution
T90 vs. Hardness ratio plot
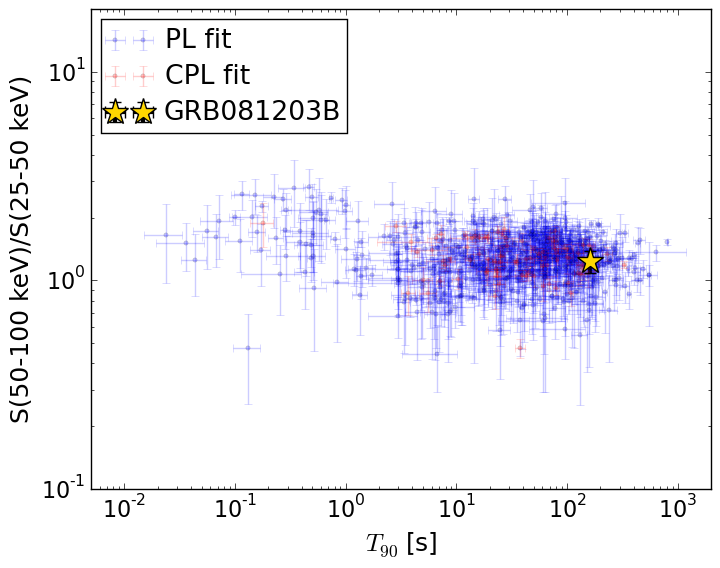
T90                                   = 161.6 sec.
Hardness ratio (energy fluence ratio) = 1.2397098395
S(15-50 keV) vs. S(50-150 keV) plot
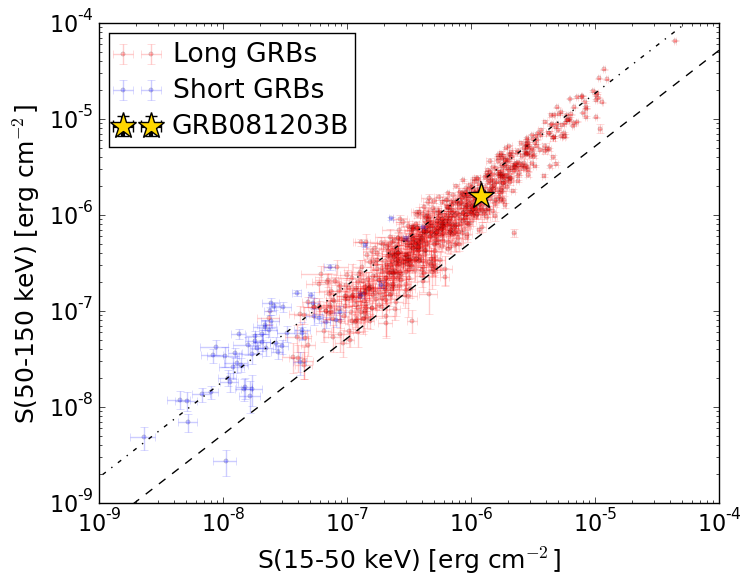
S(15-50 keV)  = 1.2084127e-06
S(50-150 keV) = 1.5740198e-06
The dash-dotted line and the dashed line traces the fluences calculated from the Band function with Epeak = 15 and 150 keV, respectively. Both lines assume a canonical values of alpha = -1 and beta = -2.5.
Mask shadow pattern
Mask shadow pattern unavailable because this burst occurs during telescope slews.Spacecraft aspect plot