Analysis Summary
Notes:
- 1) No attempt has been made to eliminate the non-significant decimal places.
- 2) This batgrbproduct analysis is done using the HEASARC data.
- 3) This batgrbproduct analysis is using the flight position for the mask-weighting calculation.
======================================================================
BAT GRB EVENT DATA PROCESSING REPORT
Process Script Ver: batgrbproduct v2.46
Process Start Time: Sun Jan 19 20:06:18 EST 2014
Host Name: batevent1
Current Working Dir: /local/data/batevent/batevent_reproc/trigger337073
======================================================================
Trigger: 00337073 Segment: 000
BAT Trigger Time: 250633177.536 [s; MET]
Trigger Stop: 250633179.584 [s; MET]
UTC: 2008-12-10T20:19:34.212340 [includes UTCF correction]
Where From?: TDRSS position message
BAT
RA: 70.4580954461975 Dec: -11.2656778579067 [deg; J2000]
Catalogged Source?: NO
Point Source?: YES
GRB Indicated?: YES [ by BAT flight software ]
Image S/N Ratio: 8.2
Image Trigger?: NO
Rate S/N Ratio: 10.6770782520313 [ if not an image trigger ]
Image S/N Ratio: 8.2
Analysis Position: [ source = BAT ]
RA: 70.4580954461975 Dec: -11.2656778579067 [deg; J2000]
Refined Position: [ source = BAT pre-slew burst ]
RA: 70.4863391035201 Dec: -11.2648243025026 [deg; J2000]
{ 04h 41m 56.7s , -11d 15' 53.4" }
+/- 0.982897022927068 [arcmin] (estimated 90% radius based on SNR)
+/- 0.384976049142439 [arcmin] (formal 1-sigma fit error)
SNR: 31.1760585970009
Angular difference between the analysis and refined position is 1.662759 arcmin
Partial Coding Fraction: 0.9609375 [ including projection effects ]
Duration
T90: 145.908000022173 +/- 7.02823676443138
Measured from: -8.77600002288818
to: 137.131999999285 [s; relative to TRIGTIME]
T50: 17.4840000271797 +/- 2.95609741899295
Measured from: 1.59199997782707
to: 19.0760000050068 [s; relative to TRIGTIME]
Fluence
Peak Flux (peak 1 second)
Measured from: 17.9679999947548
to: 18.9679999947548 [s; relative to TRIGTIME]
Total Fluence
Measured from: -12.8680000007153
to: 142.979999989271 [s; relative to TRIGTIME]
Band 1 Band 2 Band 3 Band 4
15-25 25-50 50-100 100-350 keV
Total 0.779624 1.073093 0.887040 0.218520
0.063218 0.067346 0.063591 0.066884 [error]
Peak 0.077121 0.109189 0.106044 0.032463
0.006174 0.006871 0.006621 0.005911 [error]
[ fluence units of on-axis counts / fully illuminated detector ]
======================================================================
====== Table of the duration information =============================
Value tstart tstop
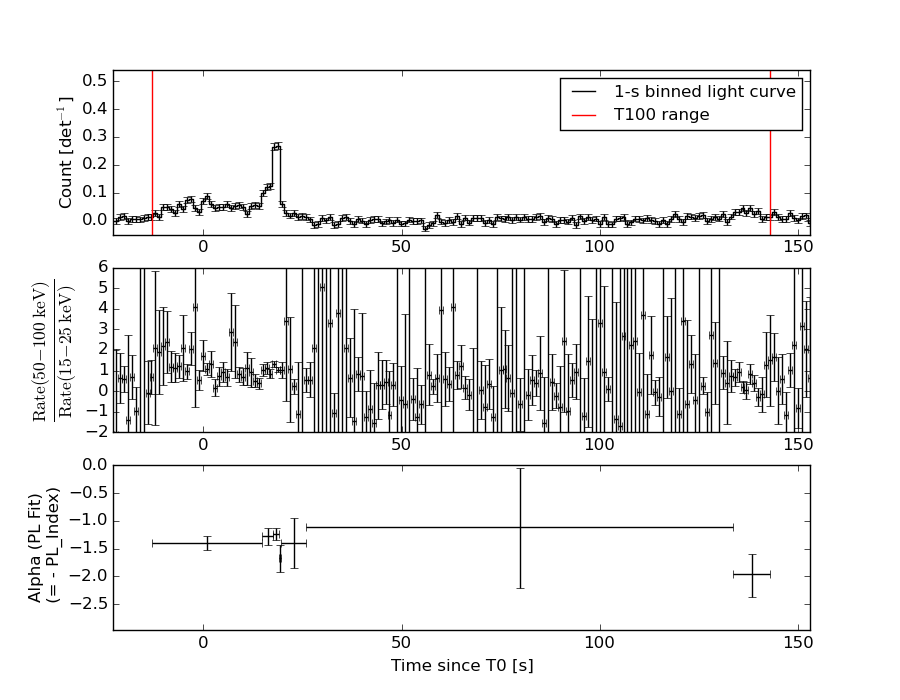
T100 155.848 -12.868 142.980
T90 145.908 -8.776 137.132
T50 17.484 1.592 19.076
Peak 1.000 17.968 18.968
====== Spectral Analysis Summary =====================================
Model : spectral model: simple power-law (PL) and cutoff power-law (CPL)
Ph_index : photon index: E^{Ph_index}
Ph_90err : 90% error of the photon index
Epeak : Epeak in keV
Epeak_90err: 90% error of Epeak
Norm : normalization at 50 keV in both the PL model and CPL model
Nomr_90err : 90% error of the normalization
chi2 : Chi-Squared
dof : degree of freedo
=== Time-averaged spectral analysis ===
(Best model with acceptable fit: PL)
Model Ph_index Ph_90err_low Ph_90err_hi Epeak Epeak_90err_low Epeak_90err_hi Norm Nomr_90err_low Norm_90err_hi chi2 dof
PL -1.376 -0.134 0.134 - - - 1.23e-03 -8.69e-05 8.65e-05 54.510 57
CPL -1.377 -0.132 0.335 9999.340 -9999.340 -9999.340 1.23e-03 -3.29e-04 5.39e-04 54.530 56
=== 1-s peak spectral analysis ===
(Best model with acceptable fit: PL)
Model Ph_index Ph_90err_low Ph_90err_hi Epeak Epeak_90err_low Epeak_90err_hi Norm Nomr_90err_low Norm_90err_hi chi2 dof
PL -1.229 -0.120 0.121 - - - 2.08e-02 -1.36e-03 1.36e-03 53.190 57
CPL -1.163 -0.177 0.406 675.032 -675.032 -675.032 2.24e-02 -2.85e-03 1.19e-02 53.240 56
=== Fluence/Peak Flux Summary ===
Model Band1 Band2 Band3 Band4 Band5 Total
15-25 25-50 50-100 100-350 15-150 15-350 keV
Fluence PL 2.17e-07 4.30e-07 6.63e-07 2.24e-06 1.85e-06 3.55e-06 erg/cm2
90%_error_low -2.71e-08 -3.16e-08 -6.36e-08 -4.46e-07 -1.52e-07 -4.96e-07 erg/cm2
90%_error_hi 2.82e-08 3.14e-08 6.35e-08 5.23e-07 1.54e-07 5.62e-07 erg/cm2
Peak flux PL 6.61e-01 7.82e-01 6.67e-01 9.68e-01 2.45e+00 3.08e+00 ph/cm2/s
90%_error_low -8.12e-02 -5.82e-02 -5.41e-02 -1.60e-01 -1.62e-01 -2.18e-01 ph/cm2/s
90%_error_hi 8.45e-02 5.77e-02 5.37e-02 1.80e-01 1.62e-01 2.22e-01 ph/cm2/s
Fluence CPL 2.19e-07 4.27e-07 6.61e-07 2.35e-06 1.86e-06 3.42e-06 erg/cm2
90%_error_low -3.51e-08 -3.56e-08 -6.15e-08 N/A N/A -8.53e-07 erg/cm2
90%_error_hi 3.11e-08 4.24e-08 6.58e-08 N/A N/A 1.14e-06 erg/cm2
Peak flux CPL 5.12e-01 3.83e-01 2.00e-01 1.80e-01 1.17e+00 1.28e+00 ph/cm2/s
90%_error_low -1.14e-01 -6.39e-02 -1.60e-02 -3.10e-02 -1.75e-01 -1.34e-01 ph/cm2/s
90%_error_hi 7.19e-02 3.26e-02 4.00e-02 2.48e-02 1.45e-01 1.73e-01 ph/cm2/s
======================================================================
Image
Pre-slew 15.0-350.0 keV image (Event data)
#   RAcent    DECcent   POSerr    Theta     Phi              Peak Cts       SNR   Name
   70.4863   -11.2648   0.0062    14.4854    28.6639         2.3870557     31.176 TRIG_00337073

Foreground time interval of the image:
-12.868  24.365 (delta_t =  37.233 [sec])
Background time interval of the image:
-94.435 -12.868 (delta_t =  81.567 [sec])
Light Curves
Note: The mask-weighted lightcurves have units of either count/det or counts/sec/det, where a det is 0.4 x 0.4 = 0.16 sq cm.
Full-time range; 1 s binning
Other quick-look light curves:
- 64 ms binning (zoomed)
- 16 ms binning (zoomed)
- 8 ms binning (zoomed)
- 2 ms binning (zoomed)
- SN=5 or 10 s binning (full-time range)
- Raw light curve
Spectra
- 64 ms binning (zoomed)
- 16 ms binning (zoomed)
- 8 ms binning (zoomed)
- 2 ms binning (zoomed)
- SN=5 or 10 s binning (full-time range)
- Raw light curve
Spectra
Notes:
- 1) The fitting includes the systematic errors.
- 2) When the burst includes telescope slew time periods, the fitting uses an average response file made from multiple 5-s response files through out the slew time plus single time preiod for the non-slew times, and weighted by the total counts in the corresponding time period using addrmf. An average response file is needed becuase a spectral fit using the pre-slew DRM will introduce some errors in both a spectral shape and a normalization if the PHA file contains a lot of the slew/post-slew time interval.
- 3) For fits to more complicated models (e.g. a power-law over a cutoff power-law), the BAT team has decided to require a chi-square improvement of more than 6 for each extra dof.
Time averaged spectrum fit using the average DRM
Power-law model

Time interval is from  -12.868 sec. to  142.980 sec.

Spectral model in power-law:
------------------------------------------------------------
Parameters  : value       lower 90%   higher 90%
Photon index: -1.37641     ( -0.134315   0.133815 )
Norm@50keV  : 1.22567E-03    ( -8.6905e-05   8.64901e-05 )
------------------------------------------------------------
#Fit statistic : Chi-Squared =          54.51 using 59 PHA bins.
# Reduced chi-squared =         0.9563 for     57 degrees of freedom
# Null hypothesis probability =   5.690848e-01

Photon flux (15-150 keV)    in 155.8 sec: 0.148486 ( -0.010311  0.010328 ) ph/cm2/s
Energy fluence (15-150 keV)             : 1.8545e-06 ( -1.51923e-07  1.54023e-07 ) ergs/cm2
Cutoff power-law model
Time interval is from  -12.868 sec. to  142.980 sec.
Spectral model in the cutoff power-law:
------------------------------------------------------------
Parameters  : value       lower 90%   higher 90%
Photon index: -1.37696     ( -0.131824   0.334876 )
Epeak [keV] : 9999.34      ( -9999.36 -9999.36 )
Norm@50keV  : 1.22945E-03    ( -0.00032898   0.000539082 )
------------------------------------------------------------
#Fit statistic : Chi-Squared =          54.53 using 59 PHA bins.
# Reduced chi-squared =         0.9737 for     56 degrees of freedom
# Null hypothesis probability =   5.307610e-01

Photon flux (15-150 keV)    in 155.8 sec: 0.148457 ( -0.010315  0.010324 ) ph/cm2/s
Energy fluence (15-150 keV)             : 1.86457e-06 ( 0  0 ) ergs/cm2
1-s peak spectrum fit
Power-law model
Time interval is from   17.968 sec. to   18.968 sec.

Spectral model in power-law:
------------------------------------------------------------
Parameters  : value       lower 90%   higher 90%
Photon index: -1.22881     ( -0.1204   0.120588 )
Norm@50keV  : 2.08260E-02    ( -0.00136442   0.00136214 )
------------------------------------------------------------
#Fit statistic : Chi-Squared =          53.19 using 59 PHA bins.
# Reduced chi-squared =         0.9331 for     57 degrees of freedom
# Null hypothesis probability =   6.189046e-01

Photon flux (15-150 keV)    in 1 sec: 2.45494 ( -0.16186  0.16202 ) ph/cm2/s
Energy fluence (15-150 keV)             : 2.09633e-07 ( -1.5915e-08  1.6061e-08 ) ergs/cm2
Cutoff power-law model
Time interval is from   17.968 sec. to   18.968 sec.
Spectral model in the cutoff power-law:
------------------------------------------------------------
Parameters  : value       lower 90%   higher 90%
Photon index: -1.22467     ( -0.123112   0.459932 )
Epeak [keV] : 9998.38      ( -9998.37 -9998.37 )
Norm@50keV  : 2.09223E-02    ( -0.00137082   0.0134036 )
------------------------------------------------------------
#Fit statistic : Chi-Squared =          53.19 using 59 PHA bins.
# Reduced chi-squared =         0.9498 for     56 degrees of freedom
# Null hypothesis probability =   5.820558e-01

Photon flux (15-150 keV)    in 1 sec: 1.16858 ( -0.175182  0.14531 ) ph/cm2/s
Energy fluence (15-150 keV)             : 6.6673e-08 ( -1.6122e-08  8.99983e-09 ) ergs/cm2
Time-resolved spectra
Distribution
T90 vs. Hardness ratio plot
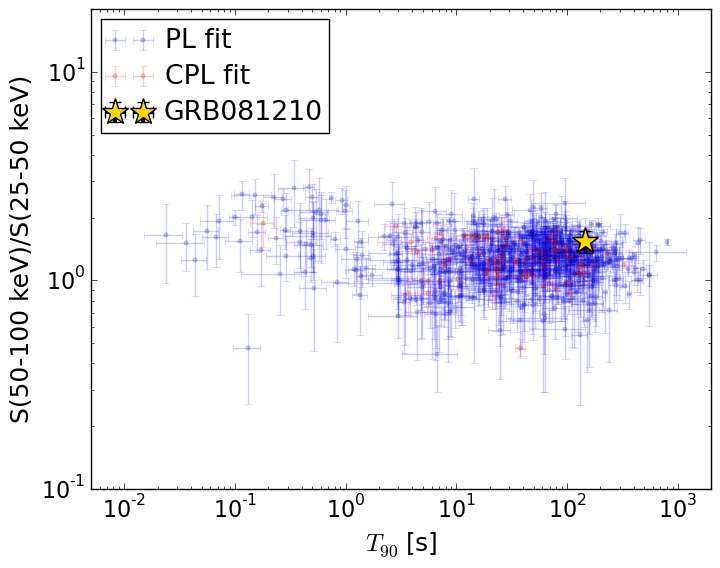
T90                                   = 145.908 sec.
Hardness ratio (energy fluence ratio) = 1.5407421501
S(15-50 keV) vs. S(50-150 keV) plot
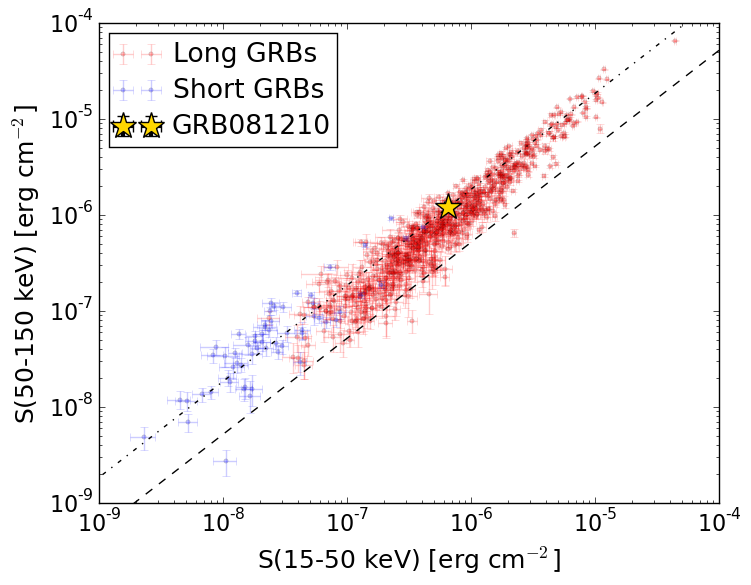
S(15-50 keV)  = 6.476435e-07
S(50-150 keV) = 1.2068673e-06
The dash-dotted line and the dashed line traces the fluences calculated from the Band function with Epeak = 15 and 150 keV, respectively. Both lines assume a canonical values of alpha = -1 and beta = -2.5.
Mask shadow pattern
IMX = 2.266851828296420E-01, IMY = -1.239211919727717E-01
Spacecraft aspect plot
Bright source in the pre-burst/pre-slew/post-slew images
Pre-burst image of 15-350 keV band
Time interval of the image:
-94.435410 -12.868000

# RAcent  DECcent POSerr Theta    Phi  PeakCts   SNR AngSep     Name
#  [deg]    [deg]    ['] [deg]  [deg]                   [']
135.5197 -40.4898    5.2  49.4 -145.3   0.6094   2.2    3.9	Vela X-1
 74.6377   9.2833    2.4  29.7   70.3   0.8533   4.9 ------	UNKNOWN
 39.1517  -0.6456    2.5  46.8   15.4   1.1322   4.6 ------	UNKNOWN
Pre-slew background subtracted image of 15-350 keV band
Time interval of the image:
-12.868000 24.364600

# RAcent  DECcent POSerr Theta    Phi  PeakCts   SNR AngSep     Name
#  [deg]    [deg]    ['] [deg]  [deg]                   [']
135.6107 -40.3593   37.2  49.4 -145.5  -0.0656  -0.3   12.3	Vela X-1
 96.6791  11.9183    2.0  33.9  111.7   1.0030   5.8 ------	UNKNOWN
103.7800  -1.4947    2.5  26.9  138.7   0.4779   4.6 ------	UNKNOWN
 70.4863 -11.2648    0.4  14.5   28.7   2.3872  31.2 ------	UNKNOWN
Post-slew image of 15-350 keV band
Time interval of the image:
60.964600 962.532400

# RAcent  DECcent POSerr Theta    Phi  PeakCts   SNR AngSep     Name
#  [deg]    [deg]    ['] [deg]  [deg]                   [']
 83.6405  22.0244    0.5  35.7   99.0  35.2790  21.7    0.7	Crab
 48.4703  -8.8567    2.3  21.8   -8.0   2.6294   4.9 ------	UNKNOWN