Analysis Summary
Notes:
- 1) No attempt has been made to eliminate the non-significant decimal places.
- 2) This batgrbproduct analysis is done using the HEASARC data.
- 3) This batgrbproduct analysis is using the flight position for the mask-weighting calculation.
======================================================================
BAT GRB EVENT DATA PROCESSING REPORT
Process Script Ver: batgrbproduct v2.46
Process Start Time: Sun Jan 19 19:58:32 EST 2014
Host Name: batevent1
Current Working Dir: /local/data/batevent/batevent_reproc/trigger337115
======================================================================
Trigger: 00337115 Segment: 000
BAT Trigger Time: 250688894.016 [s; MET]
Trigger Stop: 250688896.064 [s; MET]
UTC: 2008-12-11T11:48:10.690660 [includes UTCF correction]
Where From?: TDRSS position message
BAT
RA: 328.087288181771 Dec: -33.8149123552862 [deg; J2000]
Catalogged Source?: NO
Point Source?: YES
GRB Indicated?: YES [ by BAT flight software ]
Image S/N Ratio: 6.53
Image Trigger?: NO
Rate S/N Ratio: 7.41619848709566 [ if not an image trigger ]
Image S/N Ratio: 6.53
Analysis Position: [ source = BAT ]
RA: 328.087288181771 Dec: -33.8149123552862 [deg; J2000]
Refined Position: [ source = BAT pre-slew burst ]
RA: 328.079885243816 Dec: -33.8179449543086 [deg; J2000]
{ 21h 52m 19.2s , -33d 49' 04.6" }
+/- 2.29289696332006 [arcmin] (estimated 90% radius based on SNR)
+/- 1.18442844115158 [arcmin] (formal 1-sigma fit error)
SNR: 9.29572621565351
Angular difference between the analysis and refined position is 0.411452 arcmin
Partial Coding Fraction: 0.4257812 [ including projection effects ]
Duration
T90: 3.42399999499321 +/- 0.84217814817088
Measured from: -0.891999989748001
to: 2.53200000524521 [s; relative to TRIGTIME]
T50: 1.57600003480911 +/- 0.894588156469805
Measured from: 0.227999985218048
to: 1.80400002002716 [s; relative to TRIGTIME]
Fluence
Peak Flux (peak 1 second)
Measured from: 0.19200000166893
to: 1.19200000166893 [s; relative to TRIGTIME]
Total Fluence
Measured from: -1.08000001311302
to: 2.75200000405312 [s; relative to TRIGTIME]
Band 1 Band 2 Band 3 Band 4
15-25 25-50 50-100 100-350 keV
Total 0.097022 0.106774 0.040645 0.015413
0.016293 0.017086 0.014801 0.013366 [error]
Peak 0.016072 0.047566 0.024554 0.002273
0.008272 0.008887 0.007544 0.006893 [error]
[ fluence units of on-axis counts / fully illuminated detector ]
======================================================================
====== Table of the duration information =============================
Value tstart tstop
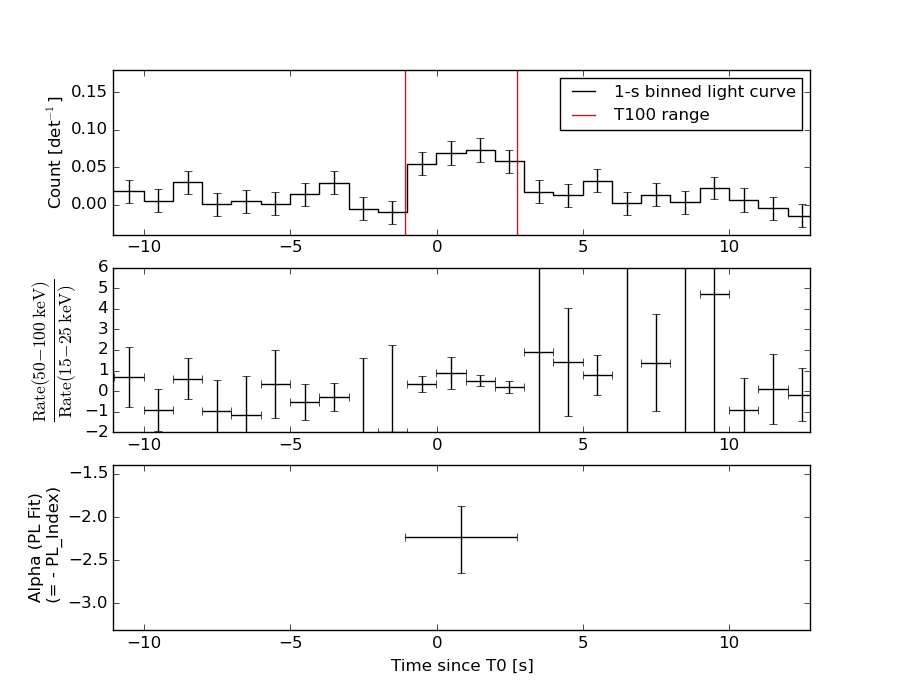
T100 3.832 -1.080 2.752
T90 3.424 -0.892 2.532
T50 1.576 0.228 1.804
Peak 1.000 0.192 1.192
====== Spectral Analysis Summary =====================================
Model : spectral model: simple power-law (PL) and cutoff power-law (CPL)
Ph_index : photon index: E^{Ph_index}
Ph_90err : 90% error of the photon index
Epeak : Epeak in keV
Epeak_90err: 90% error of Epeak
Norm : normalization at 50 keV in both the PL model and CPL model
Nomr_90err : 90% error of the normalization
chi2 : Chi-Squared
dof : degree of freedo
=== Time-averaged spectral analysis ===
(Best model with acceptable fit: PL)
Model Ph_index Ph_90err_low Ph_90err_hi Epeak Epeak_90err_low Epeak_90err_hi Norm Nomr_90err_low Norm_90err_hi chi2 dof
PL -2.231 -0.416 0.365 - - - 3.60e-03 -1.04e-03 1.00e-03 66.420 57
CPL -1.514 -0.571 3.530 24.722 N/A N/A 1.02e-02 N/A N/A 65.850 56
=== 1-s peak spectral analysis ===
(Best model with acceptable fit: PL)
Model Ph_index Ph_90err_low Ph_90err_hi Epeak Epeak_90err_low Epeak_90err_hi Norm Nomr_90err_low Norm_90err_hi chi2 dof
PL -1.634 -0.446 0.433 - - - 6.28e-03 -1.79e-03 1.77e-03 62.550 57
CPL -0.222 -1.866 3.011 56.985 N/A N/A 3.72e-02 N/A N/A 60.930 56
=== Fluence/Peak Flux Summary ===
Model Band1 Band2 Band3 Band4 Band5 Total
15-25 25-50 50-100 100-350 15-150 15-350 keV
Fluence PL 3.52e-08 4.15e-08 3.54e-08 5.12e-08 1.30e-07 1.63e-07 erg/cm2
90%_error_low -8.78e-09 -8.78e-09 -1.30e-08 -2.89e-08 -3.11e-08 -4.90e-08 erg/cm2
90%_error_hi 8.98e-09 8.60e-09 1.41e-08 4.70e-08 3.26e-08 6.23e-08 erg/cm2
Peak flux PL 2.94e-01 2.73e-01 1.76e-01 1.75e-01 8.16e-01 9.18e-01 ph/cm2/s
90%_error_low -1.18e-01 -7.78e-02 -6.08e-02 -9.43e-02 -2.26e-01 -2.50e-01 ph/cm2/s
90%_error_hi 1.31e-01 7.70e-02 6.07e-02 1.41e-01 2.27e-01 2.51e-01 ph/cm2/s
Fluence CPL N/A N/A N/A N/A N/A N/A erg/cm2
90%_error_low -8.78e-09 -8.78e-09 -1.30e-08 -2.89e-08 -3.11e-08 -4.90e-08 erg/cm2
90%_error_hi 8.98e-09 8.60e-09 1.41e-08 4.70e-08 3.26e-08 6.23e-08 erg/cm2
Peak flux CPL 2.47e-01 3.21e-01 1.85e-01 4.25e-02 7.87e-01 7.95e-01 ph/cm2/s
90%_error_low -1.31e-01 -1.01e-01 -8.68e-02 -4.25e-02 -2.27e-01 -2.33e-01 ph/cm2/s
90%_error_hi 1.45e-01 1.13e-01 7.43e-02 1.80e-01 2.30e-01 2.81e-01 ph/cm2/s
======================================================================
Image
Pre-slew 15.0-350.0 keV image (Event data)
#   RAcent    DECcent   POSerr    Theta     Phi              Peak Cts       SNR   Name
  328.0799   -33.8179   0.0206    42.6960   -28.7501         0.2867987      9.296 TRIG_00337115

Foreground time interval of the image:
 -1.080   2.752 (delta_t =   3.832 [sec])
Background time interval of the image:
-207.915  -1.080 (delta_t = 206.835 [sec])
Light Curves
Note: The mask-weighted lightcurves have units of either count/det or counts/sec/det, where a det is 0.4 x 0.4 = 0.16 sq cm.
Full-time range; 1 s binning
Other quick-look light curves:
- 64 ms binning (zoomed)
- 16 ms binning (zoomed)
- 8 ms binning (zoomed)
- 2 ms binning (zoomed)
- SN=5 or 10 s binning (full-time range)
- Raw light curve
Spectra
- 64 ms binning (zoomed)
- 16 ms binning (zoomed)
- 8 ms binning (zoomed)
- 2 ms binning (zoomed)
- SN=5 or 10 s binning (full-time range)
- Raw light curve
Spectra
Notes:
- 1) The fitting includes the systematic errors.
- 2) When the burst includes telescope slew time periods, the fitting uses an average response file made from multiple 5-s response files through out the slew time plus single time preiod for the non-slew times, and weighted by the total counts in the corresponding time period using addrmf. An average response file is needed becuase a spectral fit using the pre-slew DRM will introduce some errors in both a spectral shape and a normalization if the PHA file contains a lot of the slew/post-slew time interval.
- 3) For fits to more complicated models (e.g. a power-law over a cutoff power-law), the BAT team has decided to require a chi-square improvement of more than 6 for each extra dof.
Time averaged spectrum fit using the average DRM
Power-law model
Time interval is from   -1.080 sec. to    2.752 sec.

Spectral model in power-law:
------------------------------------------------------------
Parameters  : value       lower 90%   higher 90%
Photon index: -2.23137     ( -0.416454   0.364514 )
Norm@50keV  : 3.59724E-03    ( -0.00103818   0.00100439 )
------------------------------------------------------------
#Fit statistic : Chi-Squared =          66.42 using 59 PHA bins.
# Reduced chi-squared =          1.165 for     57 degrees of freedom
# Null hypothesis probability =   1.841192e-01

Photon flux (15-150 keV)    in 3.832 sec: 0.605594 ( -0.119354  0.119353 ) ph/cm2/s
Energy fluence (15-150 keV)             : 1.30231e-07 ( -3.11377e-08  3.25616e-08 ) ergs/cm2
Cutoff power-law model
Time interval is from   -1.080 sec. to    2.752 sec.
Spectral model in the cutoff power-law:
------------------------------------------------------------
Parameters  : value       lower 90%   higher 90%
Photon index: -1.51412     ( -0.573515   3.52719 )
Epeak [keV] : 24.7219      (   )
Norm@50keV  : 1.02023E-02    (     )
------------------------------------------------------------
#Fit statistic : Chi-Squared =          65.85 using 59 PHA bins.
# Reduced chi-squared =          1.176 for     56 degrees of freedom
# Null hypothesis probability =   1.726653e-01

Photon flux (15-150 keV)    in 3.832 sec: 0.594649 ( -0.11844  0.121724 ) ph/cm2/s
Energy fluence (15-150 keV)             : 0 ( 0  0 ) ergs/cm2
1-s peak spectrum fit
Power-law model
Time interval is from    0.192 sec. to    1.192 sec.

Spectral model in power-law:
------------------------------------------------------------
Parameters  : value       lower 90%   higher 90%
Photon index: -1.63426     ( -0.445715   0.433065 )
Norm@50keV  : 6.27894E-03    ( -0.00179067   0.00176506 )
------------------------------------------------------------
#Fit statistic : Chi-Squared =          62.55 using 59 PHA bins.
# Reduced chi-squared =          1.097 for     57 degrees of freedom
# Null hypothesis probability =   2.858066e-01

Photon flux (15-150 keV)    in 1 sec: 0.815692 ( -0.225885  0.226838 ) ph/cm2/s
Energy fluence (15-150 keV)             : 5.85019e-08 ( -1.72285e-08  1.7606e-08 ) ergs/cm2
Cutoff power-law model
Time interval is from    0.192 sec. to    1.192 sec.
Spectral model in the cutoff power-law:
------------------------------------------------------------
Parameters  : value       lower 90%   higher 90%
Photon index: -0.221638     ( -1.86893   3.00856 )
Epeak [keV] : 56.9849      (   )
Norm@50keV  : 3.72307E-02    (     )
------------------------------------------------------------
#Fit statistic : Chi-Squared =          60.93 using 59 PHA bins.
# Reduced chi-squared =          1.088 for     56 degrees of freedom
# Null hypothesis probability =   3.030331e-01

Photon flux (15-150 keV)    in 1 sec: 0.787131 ( -0.226806  0.229679 ) ph/cm2/s
Energy fluence (15-150 keV)             : 5.27947e-08 ( -1.75844e-08  1.92148e-08 ) ergs/cm2
Time-resolved spectra
Distribution
T90 vs. Hardness ratio plot
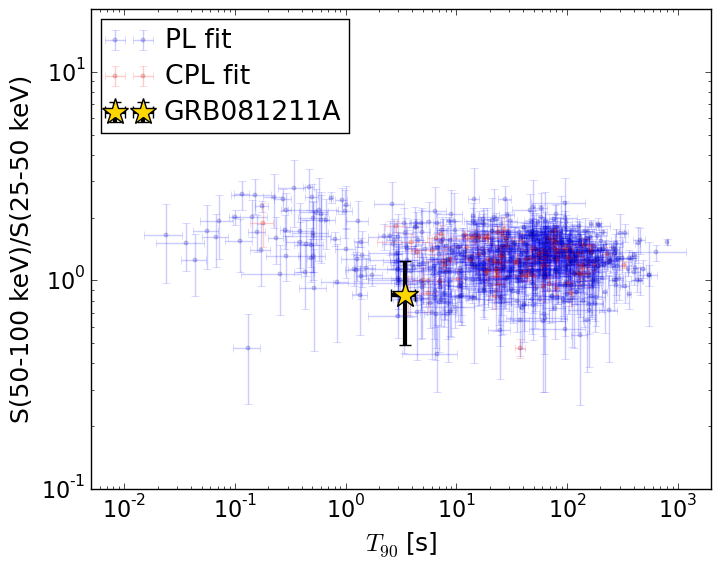
T90                                   = 3.424 sec.
Hardness ratio (energy fluence ratio) = 0.851863494755
S(15-50 keV) vs. S(50-150 keV) plot
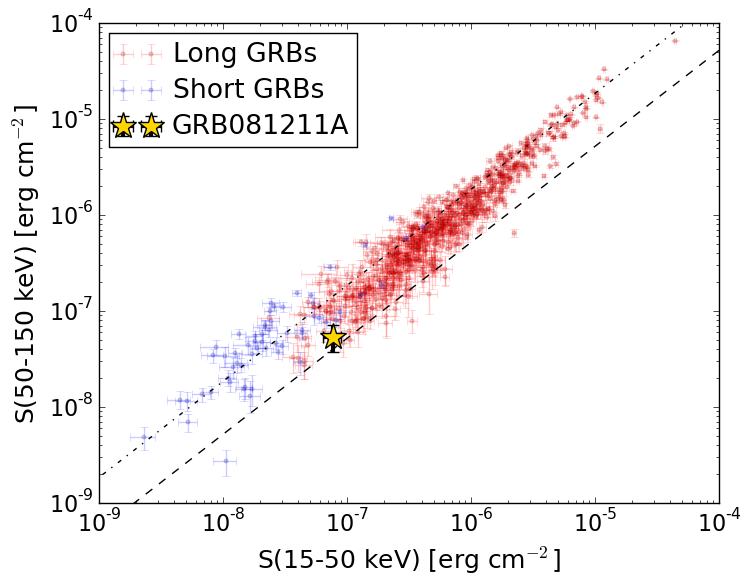
S(15-50 keV)  = 7.666557e-08
S(50-150 keV) = 5.356788e-08
The dash-dotted line and the dashed line traces the fluences calculated from the Band function with Epeak = 15 and 150 keV, respectively. Both lines assume a canonical values of alpha = -1 and beta = -2.5.
Mask shadow pattern
IMX = 8.089071085815778E-01, IMY = 4.437827325362833E-01
Spacecraft aspect plot
Bright source in the pre-burst/pre-slew/post-slew images
Pre-burst image of 15-350 keV band
Time interval of the image:
-207.915410 -1.080000

# RAcent  DECcent POSerr Theta    Phi  PeakCts   SNR AngSep     Name
#  [deg]    [deg]    ['] [deg]  [deg]                   [']
170.2665 -60.7030    5.2  54.5 -153.9   1.3379   2.2    5.0	Cen X-3
186.7855 -62.8118   17.4  54.0 -143.9  -0.7134  -0.7    4.3	GX 301-2
121.6991 -46.4414    2.9  54.9  167.6   4.0356   4.0 ------	UNKNOWN
102.8268 -62.7381    2.3  35.6  171.3   1.1561   5.0 ------	UNKNOWN
349.3619 -35.8150    3.0  32.6   -5.0   0.7821   3.9 ------	UNKNOWN
150.0431 -55.0045    2.7  56.2 -168.5   2.7525   4.2 ------	UNKNOWN
329.9760 -14.7294    2.2  58.9  -15.4   5.3074   5.3 ------	UNKNOWN
309.1712 -67.7933    2.4  27.9  -87.9   1.0906   4.8 ------	UNKNOWN
314.5843 -37.8408    2.9  45.4  -45.1   1.8732   4.0 ------	UNKNOWN
273.9069 -64.5990    3.6  41.1  -98.1   2.7938   3.3 ------	UNKNOWN
Pre-slew background subtracted image of 15-350 keV band
Time interval of the image:
-1.080000 2.752000

# RAcent  DECcent POSerr Theta    Phi  PeakCts   SNR AngSep     Name
#  [deg]    [deg]    ['] [deg]  [deg]                   [']
170.0522 -60.5535   19.3  54.6 -154.0   0.0422   0.6    8.8	Cen X-3
186.7452 -62.6494    8.1  54.1 -144.0   0.1435   1.4    7.7	GX 301-2
344.7737 -24.6910    2.6  44.4   -3.9   0.1389   4.4 ------	UNKNOWN
328.0799 -33.8179    1.2  42.7  -28.8   0.2869   9.3 ------	UNKNOWN
Post-slew image of 15-350 keV band
Time interval of the image:
94.084600 963.018400

# RAcent  DECcent POSerr Theta    Phi  PeakCts   SNR AngSep     Name
#  [deg]    [deg]    ['] [deg]  [deg]                   [']
285.0459 -25.0428    8.6  38.2  -78.8   2.0096   1.3    7.4	HT1900.1-2455
 13.5442 -76.4738    3.5  47.4  176.5   2.9818   3.3 ------	UNKNOWN
304.5569  11.6312    2.9  50.7  -20.7   3.7619   3.9 ------	UNKNOWN
294.6272   6.2284    4.8  51.0  -35.2   3.8606   2.4 ------	UNKNOWN