Analysis Summary
Notes:
- 1) No attempt has been made to eliminate the non-significant decimal places.
- 2) This batgrbproduct analysis is done using the HEASARC data.
- 3) This batgrbproduct analysis is using the flight position for the mask-weighting calculation.
==========================================================================
BAT GROUND-DETECTED GRB DATA PROCESSING REPORT
(This burst occurred during telescope slew)
Process Script Ver: batgrbproduct v2.46
Process Start Time: Tue Nov 11 09:41:51 EST 2014
Host Name: bat1
Current Working Dir: /local/data/bat1/alien/Swift_3rdBATcatalog/event/batevent_reproc/GRB081211B
======================================================================
Trigger: 00090053 Segment: 089
BAT Trigger Time: 250668939.2
UTC: 2008-12-11T06:15:35.875 [includes UTCF correction]
Where From?: Ground analysis (best_duration.txt)
NOTE: BAT trigger time for ground-detected burst during slew is the T100 start time.
Refined Position: [ source = BAT mosaic image ]
RA: 168.233046655742 Dec: 53.8336502568664 [deg; J2000]
{ 11h 12m 55.9s , +53d 50' 01.1" }
+/- 2.36003812751 [arcmin] (estimated 90% radius based on SNR)
SNR: 8.92141499079
Angular difference between the analysis and refined position is Usage: arcmin
Partial Coding Fraction: Unavailable because the burst occurred during slew.
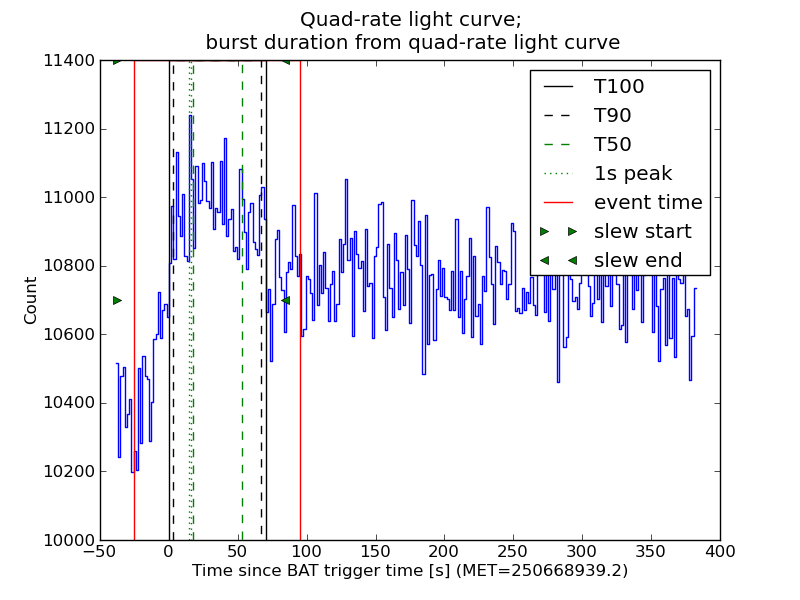
Duration
T90: 64.0000000298023 +/- 1.6
Measured from: 3.2
to: 67.2 [s; relative to TRIGTIME]
T50: 35.2000000178814 +/- 1.6
Measured from: 17.6
to: 52.8 [s; relative to TRIGTIME]
====== Table of the duration information =============================
Value tstart tstop
T100 70.400 0.000 70.400
T90 64.000 3.200 67.200
T50 35.200 17.600 52.800
Peak 1.000 14.700 15.700
====== Spectral Analysis Summary =====================================
Model : spectral model: simple power-law (PL) and cutoff power-law (CPL)
Ph_index : photon index: E^{Ph_index}
Ph_90err : 90% error of the photon index
Epeak : Epeak in keV
Epeak_90err: 90% error of Epeak
Norm : normalization at 50 keV in both the PL model and CPL model
Nomr_90err : 90% error of the normalization
chi2 : Chi-Squared
dof : degree of freedo
=== Time-averaged spectral analysis ===
(Best model with acceptable fit: PL)
Model Ph_index Ph_90err_low Ph_90err_hi Epeak Epeak_90err_low Epeak_90err_hi Norm Nomr_90err_low Norm_90err_hi chi2 dof
PL -1.636 -0.338 0.317 - - - 6.62e-04 -1.27e-04 1.21e-04 52.320 57
CPL -1.637 -0.801 0.633 9999.240 N/A N/A 6.63e-04 N/A N/A 52.330 56
=== 1-s peak spectral analysis ===
(Best model with acceptable fit: N/A)
Model Ph_index Ph_90err_low Ph_90err_hi Epeak Epeak_90err_low Epeak_90err_hi Norm Nomr_90err_low Norm_90err_hi chi2 dof
PL -1.500 1.500 1.500 - - - 0.00e+00 0.00e+00 9.04e-04 43.790 57
CPL -1.000 1.000 1.000 80.000 -80.000 -80.000 0.00e+00 0.00e+00 0.00e+00 43.790 56
=== Fluence/Peak Flux Summary ===
Model Band1 Band2 Band3 Band4 Band5 Total
15-25 25-50 50-100 100-350 15-150 15-350 keV
Fluence PL 6.76e-08 1.14e-07 1.47e-07 3.81e-07 4.34e-07 7.10e-07 erg/cm2
90%_error_low -1.77e-08 -1.90e-08 -3.87e-08 -1.75e-07 -8.76e-08 -2.15e-07 erg/cm2
90%_error_hi 1.88e-08 1.89e-08 3.82e-08 2.53e-07 8.97e-08 2.79e-07 erg/cm2
Peak flux PL 4.14e-02 9.53e-03 1.12e-03 1.55e-04 5.18e-02 5.11e-02 ph/cm2/s
90%_error_low -4.14e-02 -9.53e-03 -1.12e-03 -1.55e-04 -5.18e-02 -5.11e-02 ph/cm2/s
90%_error_hi 7.24e-02 3.50e-02 1.80e-02 2.10e-01 1.05e-01 1.06e-01 ph/cm2/s
Fluence CPL 6.85e-08 7.72e-08 1.45e-07 3.80e-07 4.37e-07 6.99e-07 erg/cm2
90%_error_low N/A -2.73e-08 -9.81e-08 N/A -7.77e-08 -2.72e-07 erg/cm2
90%_error_hi N/A 1.52e-08 -4.01e-08 N/A 8.72e-08 1.16e-07 erg/cm2
Peak flux CPL 7.02e-02 7.98e-03 3.08e-07 5.57e-17 7.17e-02 7.02e-02 ph/cm2/s
90%_error_low -7.02e-02 -7.98e-03 N/A -5.57e-17 -7.17e-02 -7.02e-02 ph/cm2/s
90%_error_hi 8.28e-02 4.88e-02 N/A -5.57e-17 1.04e-01 1.05e-01 ph/cm2/s
======================================================================
Image
Note1: The mosaic image is made with timebin = 0.50 s; energybin = 15-150 keV
Note2: The mosaic image uses Galactic coordinate.
#RAcent DECcent POSerr Theta  Phi  Peak_Cts  SNR Name
168.233 53.834 0.008 29.064 -60.358 0.009 8.921 UNKNOWN

Image time interval: 0.000 to 70.400 [sec]
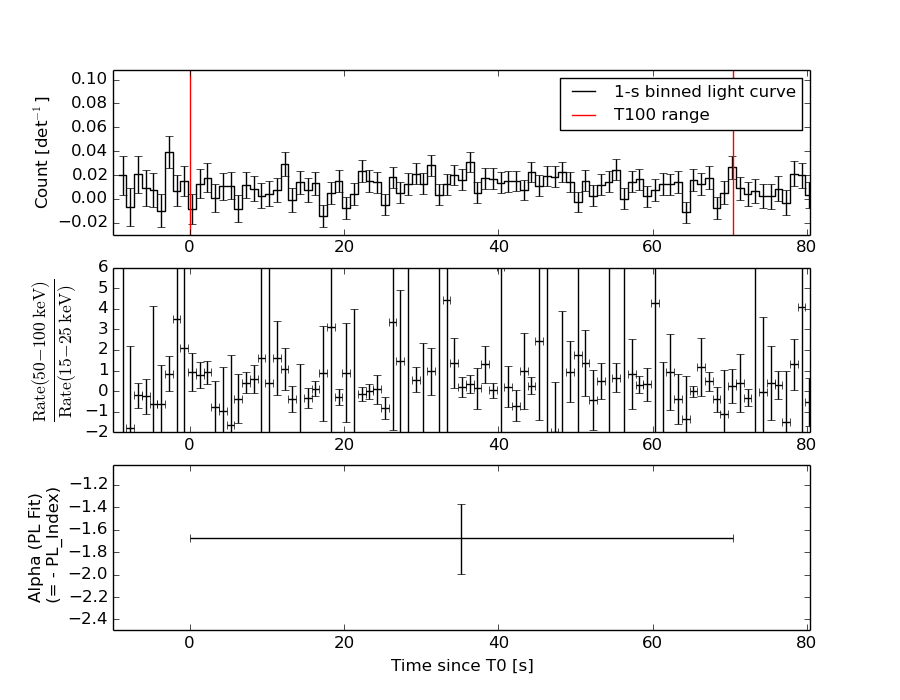
Light Curves
Note: The mask-weighted lightcurves have units of either count/det or counts/sec/det, where a det is 0.4 x 0.4 = 0.16 sq cm.
Best duration plot
Full-time range; 1 s binning
Other quick-look light curves:
- 64 ms binning (zoomed)
- 16 ms binning (zoomed)
- 8 ms binning (zoomed)
- 2 ms binning (zoomed)
- SN=5 or 10 s binning (full-time range)
- Raw light curve
Spectra
- 64 ms binning (zoomed)
- 16 ms binning (zoomed)
- 8 ms binning (zoomed)
- 2 ms binning (zoomed)
- SN=5 or 10 s binning (full-time range)
- Raw light curve
Spectra
Notes:
- 1) The fitting includes the systematic errors.
- 2) When the burst includes telescope slew time periods, the fitting uses an average response file made from multiple 5-s response files through out the slew time plus single time preiod for the non-slew times, and weighted by the total counts in the corresponding time period using addrmf. An average response file is needed becuase a spectral fit using the pre-slew DRM will introduce some errors in both a spectral shape and a normalization if the PHA file contains a lot of the slew/post-slew time interval.
- 3) For fits to more complicated models (e.g. a power-law over a cutoff power-law), the BAT team has decided to require a chi-square improvement of more than 6 for each extra dof.
Time averaged spectrum fit using the average DRM
Power-law model

Time interval is from    0.000 sec. to   70.400 sec.

Spectral model in power-law:
------------------------------------------------------------
Parameters  : value       lower 90%   higher 90%
Photon index: -1.63632     ( -0.337747   0.31727 )
Norm@50keV  : 6.62027E-04    ( -0.000126631   0.000121257 )
------------------------------------------------------------
#Fit statistic : Chi-Squared =          52.32 using 59 PHA bins.
# Reduced chi-squared =         0.9179 for     57 degrees of freedom
# Null hypothesis probability =   6.508768e-01

Photon flux (15-150 keV)    in 70.4 sec: 8.60618E-02 ( -0.0142105  0.0142192 ) ph/cm2/s
Energy fluence (15-150 keV)             : 4.34133e-07 ( -8.76494e-08  8.96875e-08 ) ergs/cm2
Cutoff power-law model
Time interval is from    0.000 sec. to   70.400 sec.
Spectral model in the cutoff power-law:
------------------------------------------------------------
Parameters  : value       lower 90%   higher 90%
Photon index: -2.10125     ( -0.337116   1.09731 )
Epeak [keV] : 39.7763      (   )
Norm@50keV  : 3.78471E-04    (     )
------------------------------------------------------------
#Fit statistic : Chi-Squared =          51.68 using 59 PHA bins.
# Reduced chi-squared =         0.9229 for     56 degrees of freedom
# Null hypothesis probability =   6.389341e-01

Photon flux (15-150 keV)    in 70.4 sec: 8.62233E-02 ( -0.01449  0.0141697 ) ph/cm2/s
Energy fluence (15-150 keV)             : 4.36549e-07 ( -7.76744e-08  8.71629e-08 ) ergs/cm2
1-s peak spectrum fit
Power-law model
Time interval is from   14.700 sec. to   15.700 sec.

Spectral model in power-law:
------------------------------------------------------------
Parameters  : value       lower 90%   higher 90%
Photon index: -1.5     ( 1.5   1.5 )
Norm@50keV  : 0.0    ( 0   0.000904021 )
------------------------------------------------------------
#Fit statistic : Chi-Squared =          43.79 using 59 PHA bins.
# Reduced chi-squared =         0.7682 for     57 degrees of freedom
# Null hypothesis probability =   9.006018e-01

Photon flux (15-150 keV)    in 1 sec: 5.17812E-02 ( -0.0517812  0.104501 ) ph/cm2/s
Energy fluence (15-150 keV)             : 1.83333e-09 ( 1  5.47083e-09 ) ergs/cm2
Cutoff power-law model
Time interval is from   14.700 sec. to   15.700 sec.
Spectral model in the cutoff power-law:
------------------------------------------------------------
Parameters  : value       lower 90%   higher 90%
Photon index: 9.14649     ( 1   1 )
Epeak [keV] : 18.2868      ( -80 -80 )
Norm@50keV  : 5.93168E+06    ( -8.51613e+06   -8.51613e+06 )
------------------------------------------------------------
#Fit statistic : Chi-Squared =          41.97 using 59 PHA bins.
# Reduced chi-squared =         0.7494 for     56 degrees of freedom
# Null hypothesis probability =   9.180597e-01

Photon flux (15-150 keV)    in 1 sec: 7.16595E-02 ( -0.0716595  0.103767 ) ph/cm2/s
Energy fluence (15-150 keV)             : 0 ( 0  0 ) ergs/cm2
Time-resolved spectra
Distribution
T90 vs. Hardness ratio plot
T90                                   = N/A sec.
Hardness ratio (energy fluence ratio) = N/A
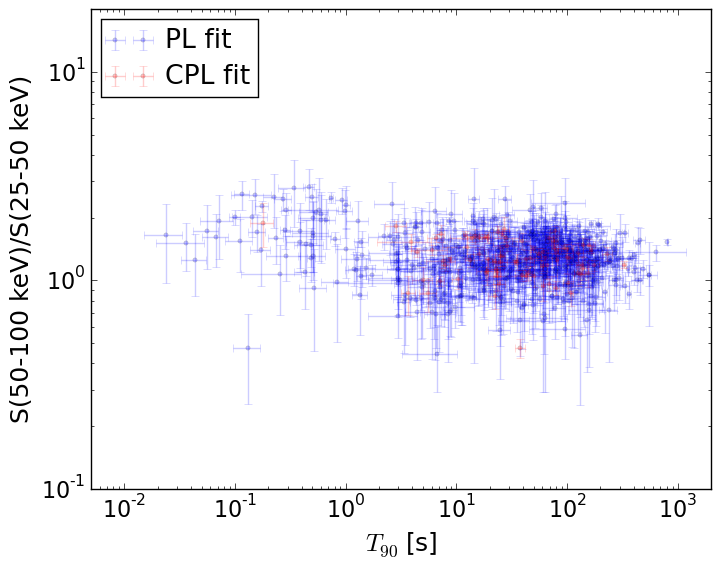
S(15-50 keV) vs. S(50-150 keV) plot
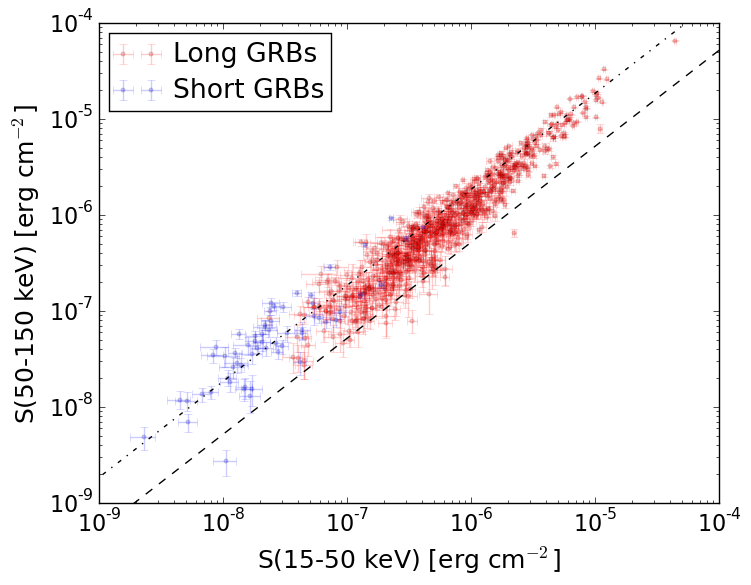
S(15-50 keV)  = N/A
S(50-150 keV) = N/A
The dash-dotted line and the dashed line traces the fluences calculated from the Band function with Epeak = 15 and 150 keV, respectively. Both lines assume a canonical values of alpha = -1 and beta = -2.5.
Mask shadow pattern
Mask shadow pattern unavailable because this burst occurs during telescope slews.Spacecraft aspect plot