Analysis Summary
Notes:
- 1) No attempt has been made to eliminate the non-significant decimal places.
- 2) This batgrbproduct analysis is done using the HEASARC data.
- 3) This batgrbproduct analysis is using the flight position for the mask-weighting calculation.
======================================================================
                  BAT GRB EVENT DATA PROCESSING REPORT
    Process Script Ver: batgrbproduct v2.46
    Process Start Time: Thu Sep 11 12:38:05 EDT 2014
             Host Name: batevent1
   Current Working Dir: /local/data/batevent/batevent_reproc/trigger337889
======================================================================

  Trigger: 00337889      Segment: 000

  BAT Trigger Time: 251569275.2   [s; MET]
      Trigger Stop: 251569275.712   [s; MET]
               UTC: 2008-12-21T16:21:11.847580    [includes UTCF correction]
       Where From?: TDRSS position message

  BAT
    RA: 15.8049817084335   Dec: -24.5258354741473  [deg; J2000]

     Catalogged Source?: NO
     Point Source?:      YES
     GRB Indicated?:     YES    [ by BAT flight software ]
     Image S/N Ratio:    8.37
     Image Trigger?:     NO
     Rate S/N Ratio:     12.8452325786651  [ if not an image trigger ]
     Image S/N Ratio:    8.37

  Analysis Position:   [ source = BAT ]
    RA: 15.8049817084335   Dec: -24.5258354741473  [deg; J2000]

  Refined Position:   [ source = BAT pre-slew burst ]
    RA: 15.8011401299552   Dec: -24.5413761046146  [deg; J2000]
        { 01h 03m 12.3s , -24d 32' 29.0" }
         +/- 0.675898739010228 [arcmin] (estimated 90% radius based on SNR)
         +/- 0.151390562887296 [arcmin] (formal 1-sigma fit error)
    SNR: 53.2285473370551

  Angular difference between the analysis and refined position is 0.955724 arcmin

  Partial Coding Fraction: 0.6171875    [ including projection effects ]

  Duration
     T90: 33.9079999923706 +/- 0.921650681212753
        Measured from: 4.61600002646446
                   to: 38.5240000188351     [s; relative to TRIGTIME]
     T50: 9.14400002360344 +/- 0.138621815705944
        Measured from: 19.9160000085831
                   to: 29.0600000321865     [s; relative to TRIGTIME]


  Fluence
     Peak Flux  (peak 1 second)
        Measured from: 21.4240000247955
                   to: 22.4240000247955     [s; relative to TRIGTIME]
     Total Fluence
        Measured from: -0.283999979496002
                   to: 112.316000014544     [s; relative to TRIGTIME]

             Band 1     Band 2     Band 3     Band 4
              15-25      25-50     50-100    100-350     keV
 Total     9.632042  12.717831   8.323238   1.446389
           0.071673   0.079141   0.071153   0.060432 [error]
 Peak      0.453024   0.817017   0.708130   0.186145
           0.012099   0.015388   0.015110   0.009494 [error]

     [ fluence units of on-axis counts / fully illuminated detector ]

======================================================================


====== Table of the duration information =============================

        Value   tstart    tstop
T100  112.600   -0.284  112.316
T90    33.908    4.616   38.524
T50     9.144   19.916   29.060
Peak    1.000   21.424   22.424


====== Spectral Analysis Summary =====================================

Model      : spectral model: simple power-law (PL) and cutoff power-law (CPL)
Ph_index   : photon index: E^{Ph_index}
Ph_90err   : 90% error of the photon index
Epeak      : Epeak in keV
Epeak_90err: 90% error of Epeak
Norm       : normalization at 50 keV in both the PL model and CPL model
Nomr_90err : 90% error of the normalization
chi2       : Chi-Squared
dof        : degree of freedo

=== Time-averaged spectral analysis ===
(Best model with acceptable fit: CPL)

Model Ph_index Ph_90err_low Ph_90err_hi  Epeak  Epeak_90err_low  Epeak_90err_hi  Norm       Nomr_90err_low    Norm_90err_hi    chi2    dof
PL      -1.751    -0.027      0.027       -           -               -         1.87e-02     -2.64e-04          2.64e-04      78.060   57
CPL     -1.298    -0.118      0.121       90.388      -7.652        11.936      2.92e-02     -3.12e-03          3.58e-03      32.710   56


=== 1-s peak spectral analysis ===
(Best model with acceptable fit: N/A)

Model Ph_index Ph_90err_low Ph_90err_hi  Epeak  Epeak_90err_low  Epeak_90err_hi  Norm       Nomr_90err_low    Norm_90err_hi    chi2    dof
PL      -1.273     -0.042     0.042       -           -               -         1.51e-01     -3.63e-03          3.63e-03     100.950   57
CPL     -0.787     -0.176     0.184      141.902     -23.948        47.468      2.50e-01     -4.07e-02          5.08e-02      77.340   56


=== Fluence/Peak Flux Summary ===

              Model    Band1     Band2     Band3     Band4     Band5     Total
                       15-25     25-50    50-100    100-350    15-150    15-350    keV
Fluence         PL   3.40e-06  5.37e-06  6.38e-06  1.47e-05  1.94e-05  2.99e-05   erg/cm2
      90%_error_low -1.04e-07 -9.64e-08 -1.01e-07 -5.35e-07 -2.72e-07 -5.70e-07   erg/cm2
      90%_error_hi   1.06e-07  9.63e-08  1.01e-07  5.48e-07  2.72e-07  5.77e-07   erg/cm2
Peak flux       PL   5.01e+00  5.77e+00  4.77e+00  6.64e+00  1.79e+01  2.22e+01   ph/cm2/s
      90%_error_low -2.38e-01 -1.69e-01 -1.28e-01 -3.71e-01 -4.59e-01 -5.40e-01   ph/cm2/s
      90%_error_hi   2.42e-01  1.68e-01  1.28e-01  3.84e-01  4.60e-01  5.41e-01   ph/cm2/s

Fluence        CPL   2.98e-06  5.42e-06  6.64e-06  9.22e-06  1.89e-05  2.43e-05   erg/cm2
      90%_error_low -1.41e-07 -1.01e-07 -1.21e-07 -9.70e-07 -3.03e-07 -1.03e-06   erg/cm2
      90%_error_hi   1.44e-07  1.01e-07  1.22e-07  1.12e-06  3.03e-07  1.16e-06   erg/cm2
Peak flux      CPL   4.41e+00  5.91e+00  5.05e+00  4.28e+00  1.75e+01  1.97e+01   ph/cm2/s
      90%_error_low -3.02e-01 -1.82e-01 -1.62e-01 -5.96e-01 -4.79e-01 -7.87e-01   ph/cm2/s
      90%_error_hi   3.09e-01  1.83e-01  1.63e-01  7.11e-01  4.80e-01  8.66e-01   ph/cm2/s

======================================================================
Image
Pre-slew 15.0-350.0 keV image (Event data)
#   RAcent    DECcent   POSerr    Theta     Phi              Peak Cts       SNR   Name
   15.8011   -24.5414   0.0036    27.1282    37.5053         3.1141926     53.229 TRIG_00337889

Foreground time interval of the image:
 -0.284  10.101 (delta_t =  10.385 [sec])
Background time interval of the image:
-239.200  -0.284 (delta_t = 238.916 [sec])
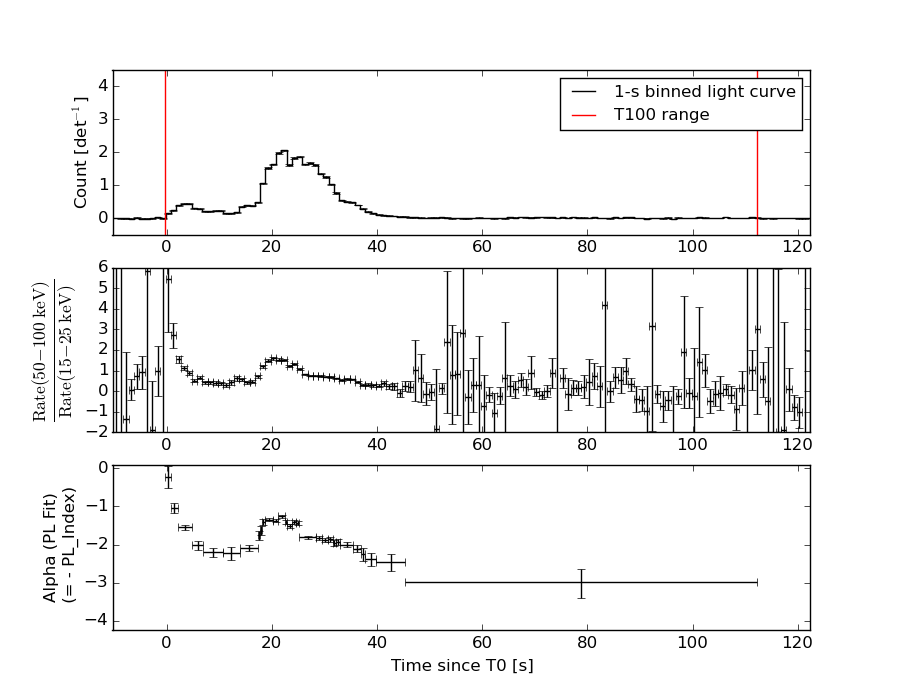
Light Curves
Note: The mask-weighted lightcurves have units of either count/det or counts/sec/det, where a det is 0.4 x 0.4 = 0.16 sq cm.
Full-time range; 1 s binning
Other quick-look light curves:
- 64 ms binning (zoomed)
- 16 ms binning (zoomed)
- 8 ms binning (zoomed)
- 2 ms binning (zoomed)
- SN=5 or 10 s binning (full-time range)
- Raw light curve
Spectra
- 64 ms binning (zoomed)
- 16 ms binning (zoomed)
- 8 ms binning (zoomed)
- 2 ms binning (zoomed)
- SN=5 or 10 s binning (full-time range)
- Raw light curve
Spectra
Notes:
- 1) The fitting includes the systematic errors.
- 2) When the burst includes telescope slew time periods, the fitting uses an average response file made from multiple 5-s response files through out the slew time plus single time preiod for the non-slew times, and weighted by the total counts in the corresponding time period using addrmf. An average response file is needed becuase a spectral fit using the pre-slew DRM will introduce some errors in both a spectral shape and a normalization if the PHA file contains a lot of the slew/post-slew time interval.
- 3) For fits to more complicated models (e.g. a power-law over a cutoff power-law), the BAT team has decided to require a chi-square improvement of more than 6 for each extra dof.
Time averaged spectrum fit using the average DRM
Power-law model
Time interval is from   -0.284 sec. to  112.316 sec.

Spectral model in power-law:
------------------------------------------------------------
Parameters  : value       lower 90%   higher 90%
Photon index: -1.75092     ( -0.0268029   0.0268375 )
Norm@50keV  : 1.86933E-02    ( -0.000264354   0.000264261 )
------------------------------------------------------------
#Fit statistic : Chi-Squared =          78.06 using 59 PHA bins.
# Reduced chi-squared =          1.369 for     57 degrees of freedom
# Null hypothesis probability =   3.348131e-02

Photon flux (15-150 keV)    in 112.6 sec: 2.52863 ( -0.04667  0.0469 ) ph/cm2/s
Energy fluence (15-150 keV)             : 1.94244e-05 ( -2.71772e-07  2.71615e-07 ) ergs/cm2
Cutoff power-law model
Time interval is from   -0.284 sec. to  112.316 sec.
Spectral model in the cutoff power-law:
------------------------------------------------------------
Parameters  : value       lower 90%   higher 90%
Photon index: -1.29812     ( -0.118054   0.120914 )
Epeak [keV] : 90.3880      ( -7.65198 11.9362 )
Norm@50keV  : 2.91617E-02    ( -0.00311993   0.00357767 )
------------------------------------------------------------
#Fit statistic : Chi-Squared =          32.71 using 59 PHA bins.
# Reduced chi-squared =         0.5841 for     56 degrees of freedom
# Null hypothesis probability =   9.945452e-01

Photon flux (15-150 keV)    in 112.6 sec: 2.40695 ( -0.05402  0.05451 ) ph/cm2/s
Energy fluence (15-150 keV)             : 1.88799e-05 ( -3.02746e-07  3.02774e-07 ) ergs/cm2
1-s peak spectrum fit
Power-law model
Time interval is from   21.424 sec. to   22.424 sec.

Spectral model in power-law:
------------------------------------------------------------
Parameters  : value       lower 90%   higher 90%
Photon index: -1.27298     ( -0.0416145   0.0416825 )
Norm@50keV  : 0.151181    ( -0.00363302   0.00363243 )
------------------------------------------------------------
#Fit statistic : Chi-Squared =         100.95 using 59 PHA bins.
# Reduced chi-squared =         1.7710 for     57 degrees of freedom
# Null hypothesis probability =   3.005099e-04

Photon flux (15-150 keV)    in 1 sec: 17.9496 ( -0.4591  0.4598 ) ph/cm2/s
Energy fluence (15-150 keV)             : 1.50422e-06 ( -3.83684e-08  3.83682e-08 ) ergs/cm2
Cutoff power-law model
Time interval is from   21.424 sec. to   22.424 sec.
Spectral model in the cutoff power-law:
------------------------------------------------------------
Parameters  : value       lower 90%   higher 90%
Photon index: -0.786642     ( -0.176343   0.183537 )
Epeak [keV] : 141.902      ( -23.9481 47.4676 )
Norm@50keV  : 0.250023    ( -0.0407368   0.0507861 )
------------------------------------------------------------
#Fit statistic : Chi-Squared =          77.34 using 59 PHA bins.
# Reduced chi-squared =          1.381 for     56 degrees of freedom
# Null hypothesis probability =   3.098637e-02

Photon flux (15-150 keV)    in 1 sec: 17.5238 ( -0.4793  0.4803 ) ph/cm2/s
Energy fluence (15-150 keV)             : 1.47302e-06 ( -4.07002e-08  4.05412e-08 ) ergs/cm2
Time-resolved spectra
Distribution
T90 vs. Hardness ratio plot
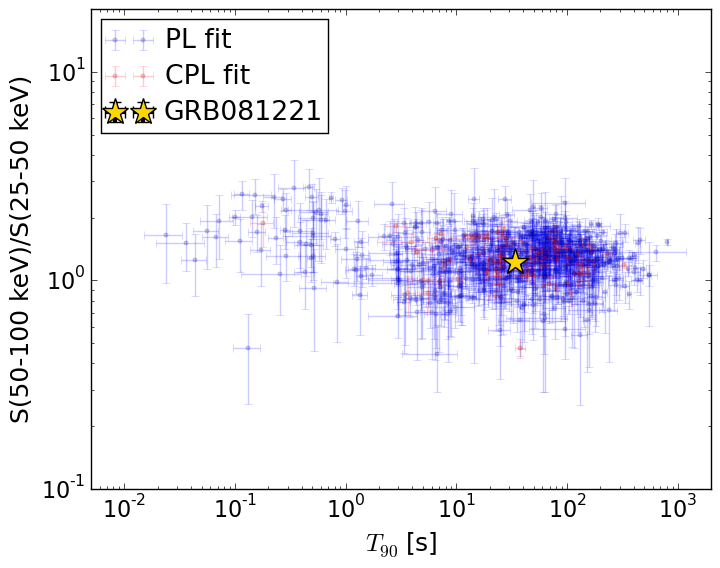
T90                                   = 33.908 sec.
Hardness ratio (energy fluence ratio) = 1.22549085619
S(15-50 keV) vs. S(50-150 keV) plot
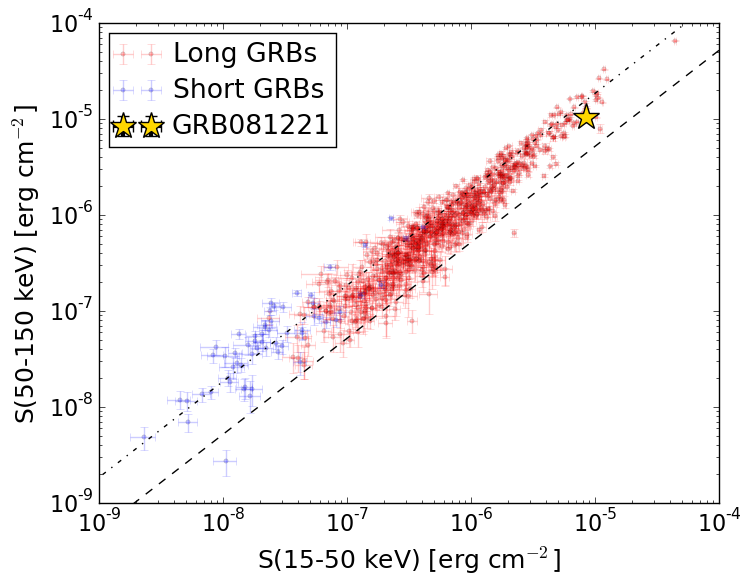
S(15-50 keV)  = 8.396408e-06
S(50-150 keV) = 1.0483433e-05
The dash-dotted line and the dashed line traces the fluences calculated from the Band function with Epeak = 15 and 150 keV, respectively. Both lines assume a canonical values of alpha = -1 and beta = -2.5.
Mask shadow pattern
IMX = 4.064442062771055E-01, IMY = -3.119349231663726E-01
Spacecraft aspect plot
Bright source in the pre-burst/pre-slew/post-slew images
Pre-burst image of 15-350 keV band
Time interval of the image:
-239.200000 -0.284000

# RAcent  DECcent POSerr Theta    Phi  PeakCts   SNR AngSep     Name
#  [deg]    [deg]    ['] [deg]  [deg]                   [']
 23.6112 -37.5464    3.0  16.8   66.2   0.7686   3.9 ------	UNKNOWN
322.8780 -79.0908    2.6  32.1 -139.4   0.9495   4.4 ------	UNKNOWN
329.4885 -46.5972    2.6  26.5  -70.4   1.0243   4.4 ------	UNKNOWN
Pre-slew background subtracted image of 15-350 keV band
Time interval of the image:
-0.284000 10.100580

# RAcent  DECcent POSerr Theta    Phi  PeakCts   SNR AngSep     Name
#  [deg]    [deg]    ['] [deg]  [deg]                   [']
 74.3773 -47.0763    2.3  41.0  136.0   0.6428   5.1 ------	UNKNOWN
  5.5161  -6.8684    2.7  44.6   19.4   0.4199   4.3  528.1	UNKNOWN
 15.8011 -24.5414    0.2  27.1   37.5   3.1142  53.2 ------	UNKNOWN
329.3329 -60.0040    2.3  24.0 -101.6   0.2593   5.1 ------	UNKNOWN
Post-slew image of 15-350 keV band
Time interval of the image:
57.500600 784.500600

# RAcent  DECcent POSerr Theta    Phi  PeakCts   SNR AngSep     Name
#  [deg]    [deg]    ['] [deg]  [deg]                   [']
 51.7884 -21.2512    2.2  33.2  119.7   3.9071   5.1 ------	UNKNOWN
 35.3107  -1.5484    2.5  29.7   70.3   2.8980   4.6 ------	UNKNOWN
357.2430   7.0106    2.4  36.3   -4.3   2.5899   4.8  451.8	UNKNOWN
357.7401   5.7042    2.6  35.0   -4.6   2.3906   4.3  368.0	UNKNOWN
354.6919 -47.6952    2.9  28.6 -121.6   1.7650   4.0 ------	UNKNOWN
328.4714 -10.2938    4.1  47.1  -53.1   6.2996   2.8 ------	UNKNOWN