Analysis Summary
Notes:
- 1) No attempt has been made to eliminate the non-significant decimal places.
- 2) This batgrbproduct analysis is done using the HEASARC data.
- 3) This batgrbproduct analysis is using the flight position for the mask-weighting calculation.
======================================================================
BAT GRB EVENT DATA PROCESSING REPORT
Process Script Ver: batgrbproduct v2.46
Process Start Time: Sun Jan 19 19:49:40 EST 2014
Host Name: batevent1
Current Working Dir: /local/data/batevent/batevent_reproc/trigger337914
======================================================================
Trigger: 00337914 Segment: 000
BAT Trigger Time: 251614443.328 [s; MET]
Trigger Stop: 251614443.584 [s; MET]
UTC: 2008-12-22T04:53:59.974180 [includes UTCF correction]
Where From?: TDRSS position message
BAT
RA: 22.7514205034355 Dec: -34.1283751474552 [deg; J2000]
Catalogged Source?: NO
Point Source?: YES
GRB Indicated?: YES [ by BAT flight software ]
Image S/N Ratio: 8.08
Image Trigger?: NO
Rate S/N Ratio: 22.0454076850486 [ if not an image trigger ]
Image S/N Ratio: 8.08
Analysis Position: [ source = BAT ]
RA: 22.7514205034355 Dec: -34.1283751474552 [deg; J2000]
Refined Position: [ source = BAT pre-slew burst ]
RA: 22.7485251076996 Dec: -34.0943365765093 [deg; J2000]
{ 01h 30m 59.6s , -34d 05' 39.6" }
+/- 0.439601297412941 [arcmin] (estimated 90% radius based on SNR)
+/- 0.135195703253786 [arcmin] (formal 1-sigma fit error)
SNR: 98.4088470214885
Angular difference between the analysis and refined position is 2.047373 arcmin
Partial Coding Fraction: 1.015625 [ including projection effects ]
Duration
T90: 33 +/- 4
Measured from: 0.671999990940094
to: 33.6719999909401 [s; relative to TRIGTIME]
T50: 6 +/- 1
Measured from: 2.67199999094009
to: 8.67199999094009 [s; relative to TRIGTIME]
Fluence
Peak Flux (peak 1 second)
Measured from: 3.67199999094009
to: 4.67199999094009 [s; relative to TRIGTIME]
Total Fluence
Measured from: -1.32800000905991
to: 63.6719999909401 [s; relative to TRIGTIME]
Band 1 Band 2 Band 3 Band 4
15-25 25-50 50-100 100-350 keV
Total 2.132176 3.049748 2.520448 0.608099
0.041278 0.044379 0.040031 0.032145 [error]
Peak 0.211433 0.353157 0.334227 0.088667
0.007539 0.009080 0.008855 0.006119 [error]
[ fluence units of on-axis counts / fully illuminated detector ]
======================================================================
====== Table of the duration information =============================
Value tstart tstop
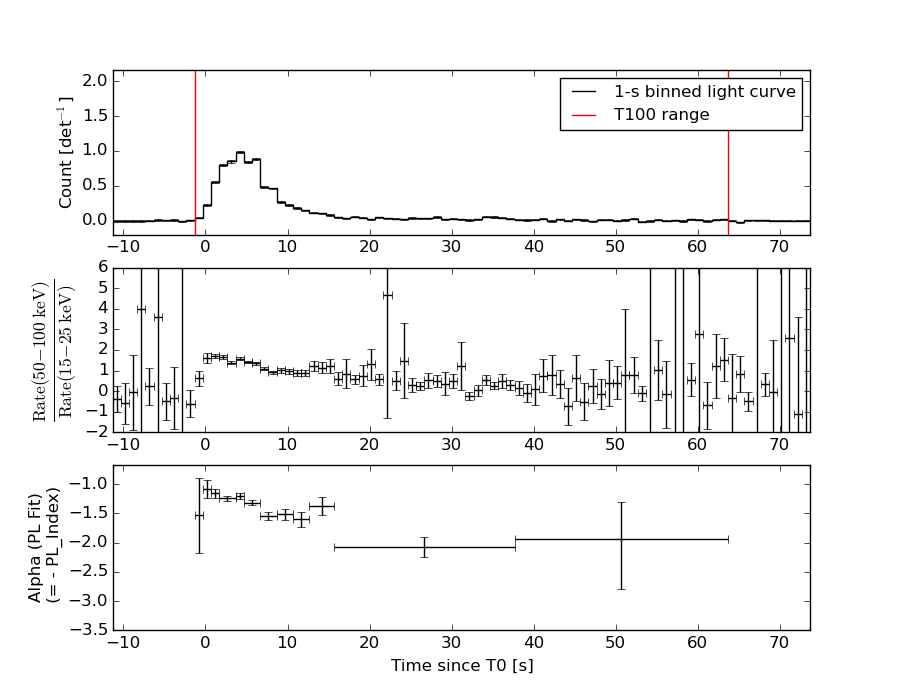
T100 65.000 -1.328 63.672
T90 33.000 0.672 33.672
T50 6.000 2.672 8.672
Peak 1.000 3.672 4.672
====== Spectral Analysis Summary =====================================
Model : spectral model: simple power-law (PL) and cutoff power-law (CPL)
Ph_index : photon index: E^{Ph_index}
Ph_90err : 90% error of the photon index
Epeak : Epeak in keV
Epeak_90err: 90% error of Epeak
Norm : normalization at 50 keV in both the PL model and CPL model
Nomr_90err : 90% error of the normalization
chi2 : Chi-Squared
dof : degree of freedo
=== Time-averaged spectral analysis ===
(Best model with acceptable fit: PL)
Model Ph_index Ph_90err_low Ph_90err_hi Epeak Epeak_90err_low Epeak_90err_hi Norm Nomr_90err_low Norm_90err_hi chi2 dof
PL -1.410 -0.038 0.038 - - - 8.33e-03 -1.65e-04 1.65e-04 43.990 57
CPL -1.198 -0.152 0.157 217.875 -68.097 366.114 1.03e-02 -1.42e-03 1.71e-03 38.290 56
=== 1-s peak spectral analysis ===
(Best model with acceptable fit: CPL)
Model Ph_index Ph_90err_low Ph_90err_hi Epeak Epeak_90err_low Epeak_90err_hi Norm Nomr_90err_low Norm_90err_hi chi2 dof
PL -1.197 -0.053 0.053 - - - 6.50e-02 -1.93e-03 1.93e-03 57.560 57
CPL -0.786 -0.215 0.226 166.289 -39.599 114.974 9.96e-02 -1.95e-02 2.56e-02 46.490 56
=== Fluence/Peak Flux Summary ===
Model Band1 Band2 Band3 Band4 Band5 Total
15-25 25-50 50-100 100-350 15-150 15-350 keV
Fluence PL 6.36e-07 1.23e-06 1.86e-06 6.06e-06 5.22e-06 9.78e-06 erg/cm2
90%_error_low -2.68e-08 -3.01e-08 -4.31e-08 -3.28e-07 -1.07e-07 -3.45e-07 erg/cm2
90%_error_hi 2.73e-08 3.01e-08 4.31e-08 3.40e-07 1.07e-07 3.56e-07 erg/cm2
Peak flux PL 2.00e+00 2.41e+00 2.10e+00 3.15e+00 7.62e+00 9.66e+00 ph/cm2/s
90%_error_low -1.18e-01 -8.66e-02 -7.20e-02 -2.27e-01 -2.36e-01 -3.02e-01 ph/cm2/s
90%_error_hi 1.21e-01 8.63e-02 7.17e-02 2.38e-01 2.36e-01 3.04e-01 ph/cm2/s
Fluence CPL 5.99e-07 1.24e-06 1.89e-06 4.65e-06 5.16e-06 8.39e-06 erg/cm2
90%_error_low -3.61e-08 -3.13e-08 -5.00e-08 -7.75e-07 -1.18e-07 -7.80e-07 erg/cm2
90%_error_hi 3.68e-08 3.14e-08 5.03e-08 9.64e-07 1.18e-07 9.64e-07 erg/cm2
Peak flux CPL 1.80e+00 2.46e+00 2.20e+00 2.11e+00 7.46e+00 8.57e+00 ph/cm2/s
90%_error_low -1.51e-01 -9.31e-02 -8.74e-02 -3.79e-01 -2.49e-01 -4.67e-01 ph/cm2/s
90%_error_hi 1.55e-01 9.35e-02 8.82e-02 4.82e-01 2.49e-01 5.45e-01 ph/cm2/s
======================================================================
Image
Pre-slew 15.0-350.0 keV image (Event data)
#   RAcent    DECcent   POSerr    Theta     Phi              Peak Cts       SNR   Name
   22.7485   -34.0943   0.0019    11.3178   177.1952         6.6018555     98.409 TRIG_00337914

Foreground time interval of the image:
 -1.328   9.773 (delta_t =  11.101 [sec])
Background time interval of the image:
-239.328  -1.328 (delta_t = 238.000 [sec])
Light Curves
Note: The mask-weighted lightcurves have units of either count/det or counts/sec/det, where a det is 0.4 x 0.4 = 0.16 sq cm.
Full-time range; 1 s binning
Other quick-look light curves:
- 64 ms binning (zoomed)
- 16 ms binning (zoomed)
- 8 ms binning (zoomed)
- 2 ms binning (zoomed)
- SN=5 or 10 s binning (full-time range)
- Raw light curve
Spectra
- 64 ms binning (zoomed)
- 16 ms binning (zoomed)
- 8 ms binning (zoomed)
- 2 ms binning (zoomed)
- SN=5 or 10 s binning (full-time range)
- Raw light curve
Spectra
Notes:
- 1) The fitting includes the systematic errors.
- 2) When the burst includes telescope slew time periods, the fitting uses an average response file made from multiple 5-s response files through out the slew time plus single time preiod for the non-slew times, and weighted by the total counts in the corresponding time period using addrmf. An average response file is needed becuase a spectral fit using the pre-slew DRM will introduce some errors in both a spectral shape and a normalization if the PHA file contains a lot of the slew/post-slew time interval.
- 3) For fits to more complicated models (e.g. a power-law over a cutoff power-law), the BAT team has decided to require a chi-square improvement of more than 6 for each extra dof.
Time averaged spectrum fit using the average DRM
Power-law model
Time interval is from   -1.328 sec. to   63.672 sec.

Spectral model in power-law:
------------------------------------------------------------
Parameters  : value       lower 90%   higher 90%
Photon index: -1.41002     ( -0.0382673   0.038309 )
Norm@50keV  : 8.33358E-03    ( -0.000165216   0.000165182 )
------------------------------------------------------------
#Fit statistic : Chi-Squared =          43.99 using 59 PHA bins.
# Reduced chi-squared =         0.7718 for     57 degrees of freedom
# Null hypothesis probability =   8.964580e-01

Photon flux (15-150 keV)    in 65 sec: 1.01722 ( -0.02284  0.02292 ) ph/cm2/s
Energy fluence (15-150 keV)             : 5.22412e-06 ( -1.07264e-07  1.07304e-07 ) ergs/cm2
Cutoff power-law model
Time interval is from   -1.328 sec. to   63.672 sec.
Spectral model in the cutoff power-law:
------------------------------------------------------------
Parameters  : value       lower 90%   higher 90%
Photon index: -1.19803     ( -0.152203   0.157448 )
Epeak [keV] : 217.875      ( -68.0971 366.114 )
Norm@50keV  : 1.03043E-02    ( -0.00142233   0.00170757 )
------------------------------------------------------------
#Fit statistic : Chi-Squared =          38.29 using 59 PHA bins.
# Reduced chi-squared =         0.6838 for     56 degrees of freedom
# Null hypothesis probability =   9.661298e-01

Photon flux (15-150 keV)    in 65 sec: 0.999556 ( -0.025747  0.025874 ) ph/cm2/s
Energy fluence (15-150 keV)             : 5.15553e-06 ( -1.18053e-07  1.17898e-07 ) ergs/cm2
1-s peak spectrum fit
Power-law model
Time interval is from    3.672 sec. to    4.672 sec.

Spectral model in power-law:
------------------------------------------------------------
Parameters  : value       lower 90%   higher 90%
Photon index: -1.1966     ( -0.0531021   0.0531976 )
Norm@50keV  : 6.49538E-02    ( -0.00193208   0.00193196 )
------------------------------------------------------------
#Fit statistic : Chi-Squared =          57.56 using 59 PHA bins.
# Reduced chi-squared =          1.010 for     57 degrees of freedom
# Null hypothesis probability =   4.543199e-01

Photon flux (15-150 keV)    in 1 sec: 7.62066 ( -0.23565  0.23588 ) ph/cm2/s
Energy fluence (15-150 keV)             : 6.5969e-07 ( -2.16028e-08  2.16596e-08 ) ergs/cm2
Cutoff power-law model
Time interval is from    3.672 sec. to    4.672 sec.
Spectral model in the cutoff power-law:
------------------------------------------------------------
Parameters  : value       lower 90%   higher 90%
Photon index: -0.785548     ( -0.21542   0.226475 )
Epeak [keV] : 166.289      ( -39.5988 114.974 )
Norm@50keV  : 9.96149E-02    ( -0.0195116   0.0255905 )
------------------------------------------------------------
#Fit statistic : Chi-Squared =          46.49 using 59 PHA bins.
# Reduced chi-squared =         0.8301 for     56 degrees of freedom
# Null hypothesis probability =   8.137136e-01

Photon flux (15-150 keV)    in 1 sec: 7.45987 ( -0.24874  0.24898 ) ph/cm2/s
Energy fluence (15-150 keV)             : 6.44956e-07 ( -2.32429e-08  2.31879e-08 ) ergs/cm2
Time-resolved spectra
Distribution
T90 vs. Hardness ratio plot

T90                                   = 33.0 sec.
Hardness ratio (energy fluence ratio) = 1.50525533797
S(15-50 keV) vs. S(50-150 keV) plot
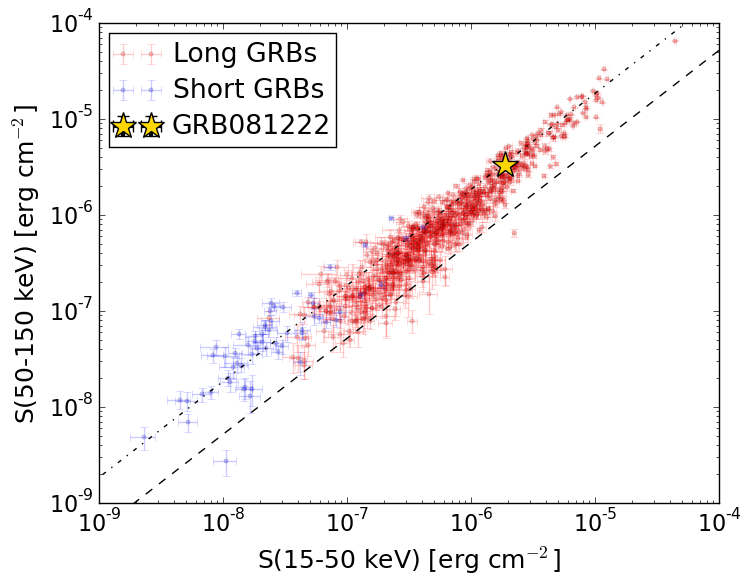
S(15-50 keV)  = 1.8701243e-06
S(50-150 keV) = 3.354039e-06
The dash-dotted line and the dashed line traces the fluences calculated from the Band function with Epeak = 15 and 150 keV, respectively. Both lines assume a canonical values of alpha = -1 and beta = -2.5.
Mask shadow pattern
IMX = -1.999025555549942E-01, IMY = -9.793488143692878E-03
Spacecraft aspect plot
Bright source in the pre-burst/pre-slew/post-slew images
Pre-burst image of 15-350 keV band
Time interval of the image:
-239.328000 -1.328000

# RAcent  DECcent POSerr Theta    Phi  PeakCts   SNR AngSep     Name
#  [deg]    [deg]    ['] [deg]  [deg]                   [']
 56.0987 -33.1744    2.5  36.1  141.2   1.3390   4.6 ------	UNKNOWN
 52.9960 -50.8219    2.7  38.8  170.3   1.0603   4.3 ------	UNKNOWN
358.6813   3.6627    2.0  32.7   -5.0   1.1304   5.7  233.6	UNKNOWN
Pre-slew background subtracted image of 15-350 keV band
Time interval of the image:
-1.328000 9.772590

# RAcent  DECcent POSerr Theta    Phi  PeakCts   SNR AngSep     Name
#  [deg]    [deg]    ['] [deg]  [deg]                   [']
 29.8956   9.8769    2.1  37.1   51.4   0.8007   5.6 ------	UNKNOWN
 22.7485 -34.0943    0.1  11.3  177.2   6.6018  98.4 ------	UNKNOWN
 27.5840 -51.5693    2.5  28.5 -167.5   0.3344   4.7 ------	UNKNOWN
342.0148 -15.4260    2.5  32.9  -52.5   0.4273   4.6 ------	UNKNOWN
327.9618  -3.4163    1.9  50.6  -45.2   1.8695   5.9 ------	UNKNOWN
Post-slew image of 15-350 keV band
Time interval of the image:
41.172590 962.775200

# RAcent  DECcent POSerr Theta    Phi  PeakCts   SNR AngSep     Name
#  [deg]    [deg]    ['] [deg]  [deg]                   [']
  3.7709  -6.5825    2.7  32.6   -5.1   2.2596   4.3  454.9	UNKNOWN
351.9699  12.9890    2.8  55.5   -5.5   5.8376   4.2 ------	UNKNOWN
 11.7039 -44.9014    2.3  13.7 -113.4   2.0909   5.0 ------	UNKNOWN
346.6504 -48.6096    2.9  30.3  -97.8   2.3700   4.0 ------	UNKNOWN
332.1966 -19.0877    4.0  47.1  -53.1   6.1514   2.9 ------	UNKNOWN
330.3708 -46.7781    5.2  41.0  -92.5   5.4521   2.2 ------	UNKNOWN
328.8770 -60.0872    2.6  43.1 -112.2  10.1298   4.5 ------	UNKNOWN