Analysis Summary
Notes:
- 1) No attempt has been made to eliminate the non-significant decimal places.
- 2) This batgrbproduct analysis is done using the HEASARC data.
- 3) This batgrbproduct analysis is using the flight position for the mask-weighting calculation.
======================================================================
BAT GRB EVENT DATA PROCESSING REPORT
Process Script Ver: batgrbproduct v2.46
Process Start Time: Sun Jan 19 19:44:23 EST 2014
Host Name: batevent1
Current Working Dir: /local/data/batevent/batevent_reproc/trigger338177
======================================================================
Trigger: 00338177 Segment: 000
BAT Trigger Time: 251946220.736 [s; MET]
Trigger Stop: 251946220.992 [s; MET]
UTC: 2008-12-26T01:03:37.372040 [includes UTCF correction]
Where From?: TDRSS position message
BAT
RA: 120.526759597338 Dec: -69.0057732552917 [deg; J2000]
Catalogged Source?: NO
Point Source?: YES
GRB Indicated?: YES [ by BAT flight software ]
Image S/N Ratio: 7.6
Image Trigger?: NO
Rate S/N Ratio: 19.9749843554382 [ if not an image trigger ]
Image S/N Ratio: 7.6
Analysis Position: [ source = BAT ]
RA: 120.526759597338 Dec: -69.0057732552917 [deg; J2000]
Refined Position: [ source = BAT pre-slew burst ]
RA: 120.483039862506 Dec: -69.0159725121132 [deg; J2000]
{ 08h 01m 55.9s , -69d 00' 57.5" }
+/- 2.12670613782388 [arcmin] (estimated 90% radius based on SNR)
+/- 1.17900972090809 [arcmin] (formal 1-sigma fit error)
SNR: 10.3505834402121
Angular difference between the analysis and refined position is 1.121311 arcmin
Partial Coding Fraction: 0.328125 [ including projection effects ]
Duration
T90: 0.435999989509583 +/- 0.075153169006516
Measured from: -0.0279999971389771
to: 0.407999992370605 [s; relative to TRIGTIME]
T50: 0.196000009775162 +/- 0.0948261490152567
Measured from: 0.0439999997615814
to: 0.240000009536743 [s; relative to TRIGTIME]
Fluence
Peak Flux (peak 1 second)
Measured from: -0.300000011920929
to: 0.699999988079071 [s; relative to TRIGTIME]
Total Fluence
Measured from: -0.0520000159740448
to: 0.451999992132187 [s; relative to TRIGTIME]
Band 1 Band 2 Band 3 Band 4
15-25 25-50 50-100 100-350 keV
Total 0.031160 0.040306 0.051488 0.033053
0.007205 0.007965 0.007746 0.006579 [error]
Peak 0.026473 0.034637 0.054571 0.043159
0.009711 0.010435 0.009537 0.008335 [error]
[ fluence units of on-axis counts / fully illuminated detector ]
======================================================================
====== Table of the duration information =============================
Value tstart tstop
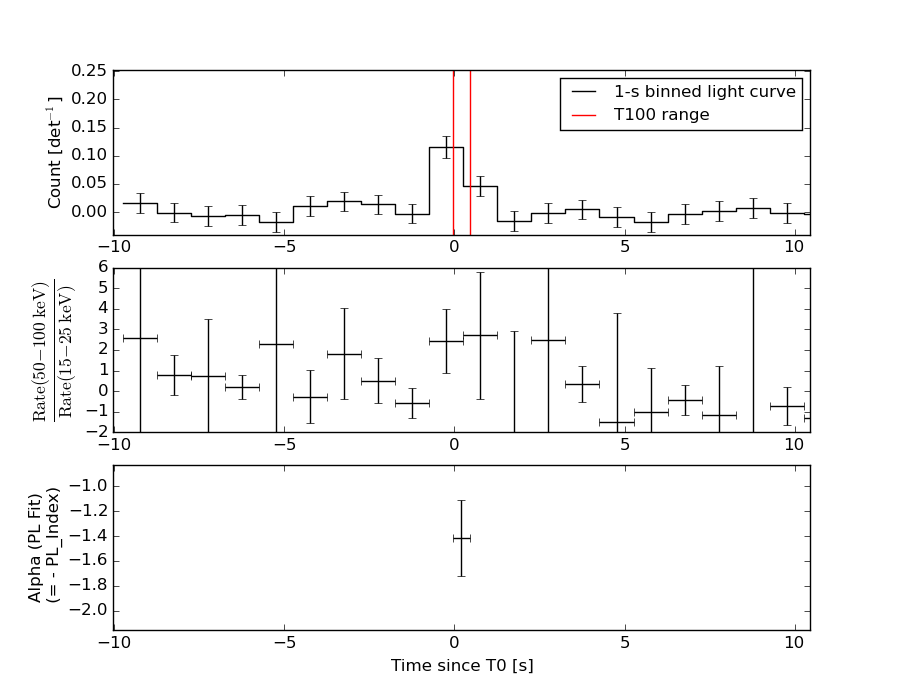
T100 0.504 -0.052 0.452
T90 0.436 -0.028 0.408
T50 0.196 0.044 0.240
Peak 1.000 -0.300 0.700
====== Spectral Analysis Summary =====================================
Model : spectral model: simple power-law (PL) and cutoff power-law (CPL)
Ph_index : photon index: E^{Ph_index}
Ph_90err : 90% error of the photon index
Epeak : Epeak in keV
Epeak_90err: 90% error of Epeak
Norm : normalization at 50 keV in both the PL model and CPL model
Nomr_90err : 90% error of the normalization
chi2 : Chi-Squared
dof : degree of freedo
=== Time-averaged spectral analysis ===
(Best model with acceptable fit: PL)
Model Ph_index Ph_90err_low Ph_90err_hi Epeak Epeak_90err_low Epeak_90err_hi Norm Nomr_90err_low Norm_90err_hi chi2 dof
PL -1.414 -0.310 0.307 - - - 1.88e-02 -3.37e-03 3.36e-03 69.980 57
CPL -1.213 -1.605 1.276 210.055 -210.055 -210.055 2.34e-02 -7.92e-03 6.81e-02 69.870 56
=== 1-s peak spectral analysis ===
(Best model with acceptable fit: PL)
Model Ph_index Ph_90err_low Ph_90err_hi Epeak Epeak_90err_low Epeak_90err_hi Norm Nomr_90err_low Norm_90err_hi chi2 dof
PL -1.028 -0.408 0.457 - - - 9.35e-03 -2.33e-03 2.24e-03 67.440 57
CPL -1.021 -5.563 1.709 9991.660 -9991.660 -9991.660 9.41e-03 -2.16e-03 4.16e-02 67.440 56
=== Fluence/Peak Flux Summary ===
Model Band1 Band2 Band3 Band4 Band5 Total
15-25 25-50 50-100 100-350 15-150 15-350 keV
Fluence PL 1.11e-08 2.16e-08 3.24e-08 1.05e-07 9.11e-08 1.70e-07 erg/cm2
90%_error_low -3.35e-09 -4.21e-09 -7.31e-09 -4.32e-08 -1.78e-08 -4.99e-08 erg/cm2
90%_error_hi 3.64e-09 4.12e-09 7.15e-09 5.90e-08 1.79e-08 6.25e-08 erg/cm2
Peak flux PL 2.45e-01 3.27e-01 3.21e-01 5.64e-01 1.08e+00 1.46e+00 ph/cm2/s
90%_error_low -1.17e-01 -1.08e-01 -7.58e-02 -2.46e-01 -2.71e-01 -3.38e-01 ph/cm2/s
90%_error_hi 1.42e-01 1.04e-01 7.49e-02 3.57e-01 2.75e-01 3.48e-01 ph/cm2/s
Fluence CPL 1.07e-08 2.20e-08 3.31e-08 7.94e-08 9.03e-08 1.45e-07 erg/cm2
90%_error_low -4.04e-09 -4.54e-09 -7.85e-09 -5.97e-08 -1.86e-08 -6.32e-08 erg/cm2
90%_error_hi 3.60e-09 4.92e-09 8.39e-09 3.76e-08 1.84e-08 4.26e-08 erg/cm2
Peak flux CPL 2.57e-01 3.27e-01 3.20e-01 5.78e-01 1.08e+00 1.47e+00 ph/cm2/s
90%_error_low -1.56e-01 -9.24e-02 -7.52e-02 N/A -2.75e-01 -5.57e-01 ph/cm2/s
90%_error_hi 1.19e-01 1.09e-01 9.69e-02 N/A 2.73e-01 3.30e-01 ph/cm2/s
======================================================================
Image
Pre-slew 15.0-350.0 keV image (Event data)
#   RAcent    DECcent   POSerr    Theta     Phi              Peak Cts       SNR   Name
  120.4830   -69.0160   0.0186    47.2667  -159.1419         0.1620785     10.351 TRIG_00338177

Foreground time interval of the image:
 -0.052   0.452 (delta_t =   0.504 [sec])
Background time interval of the image:
-239.736  -0.052 (delta_t = 239.684 [sec])
Light Curves
Note: The mask-weighted lightcurves have units of either count/det or counts/sec/det, where a det is 0.4 x 0.4 = 0.16 sq cm.
Full-time range; 1 s binning
Other quick-look light curves:
- 64 ms binning (zoomed)
- 16 ms binning (zoomed)
- 8 ms binning (zoomed)
- 2 ms binning (zoomed)
- SN=5 or 10 s binning (full-time range)
- Raw light curve
Spectra
- 64 ms binning (zoomed)
- 16 ms binning (zoomed)
- 8 ms binning (zoomed)
- 2 ms binning (zoomed)
- SN=5 or 10 s binning (full-time range)
- Raw light curve
Spectra
Notes:
- 1) The fitting includes the systematic errors.
- 2) When the burst includes telescope slew time periods, the fitting uses an average response file made from multiple 5-s response files through out the slew time plus single time preiod for the non-slew times, and weighted by the total counts in the corresponding time period using addrmf. An average response file is needed becuase a spectral fit using the pre-slew DRM will introduce some errors in both a spectral shape and a normalization if the PHA file contains a lot of the slew/post-slew time interval.
- 3) For fits to more complicated models (e.g. a power-law over a cutoff power-law), the BAT team has decided to require a chi-square improvement of more than 6 for each extra dof.
Time averaged spectrum fit using the average DRM
Power-law model
Time interval is from   -0.052 sec. to    0.452 sec.

Spectral model in power-law:
------------------------------------------------------------
Parameters  : value       lower 90%   higher 90%
Photon index: -1.41444     ( -0.309796   0.306767 )
Norm@50keV  : 1.87511E-02    ( -0.00337048   0.00335884 )
------------------------------------------------------------
#Fit statistic : Chi-Squared =          69.98 using 59 PHA bins.
# Reduced chi-squared =          1.228 for     57 degrees of freedom
# Null hypothesis probability =   1.159956e-01

Photon flux (15-150 keV)    in 0.504 sec: 2.29117 ( -0.42093  0.42261 ) ph/cm2/s
Energy fluence (15-150 keV)             : 9.10627e-08 ( -1.77903e-08  1.79433e-08 ) ergs/cm2
Cutoff power-law model
Time interval is from   -0.052 sec. to    0.452 sec.
Spectral model in the cutoff power-law:
------------------------------------------------------------
Parameters  : value       lower 90%   higher 90%
Photon index: -1.21263     ( -1.60531   1.27575 )
Epeak [keV] : 210.055      ( -209.658 -209.658 )
Norm@50keV  : 2.34481E-02    ( -0.00793699   0.068098 )
------------------------------------------------------------
#Fit statistic : Chi-Squared =          69.87 using 59 PHA bins.
# Reduced chi-squared =          1.248 for     56 degrees of freedom
# Null hypothesis probability =   1.006747e-01

Photon flux (15-150 keV)    in 0.504 sec: 2.27440 ( -0.4307  0.43052 ) ph/cm2/s
Energy fluence (15-150 keV)             : 9.02694e-08 ( -1.85593e-08  1.83933e-08 ) ergs/cm2
1-s peak spectrum fit
Power-law model
Time interval is from   -0.300 sec. to    0.700 sec.

Spectral model in power-law:
------------------------------------------------------------
Parameters  : value       lower 90%   higher 90%
Photon index: -1.02822     ( -0.407785   0.457233 )
Norm@50keV  : 9.35324E-03    ( -0.00232546   0.00224096 )
------------------------------------------------------------
#Fit statistic : Chi-Squared =          67.44 using 59 PHA bins.
# Reduced chi-squared =          1.183 for     57 degrees of freedom
# Null hypothesis probability =   1.623204e-01

Photon flux (15-150 keV)    in 1 sec: 1.07862 ( -0.270587  0.27478 ) ph/cm2/s
Energy fluence (15-150 keV)             : 1.00159e-07 ( -2.34158e-08  2.34642e-08 ) ergs/cm2
Cutoff power-law model

Time interval is from   -0.300 sec. to    0.700 sec.
Spectral model in the cutoff power-law:
------------------------------------------------------------
Parameters  : value       lower 90%   higher 90%
Photon index: -1.0214     ( -5.56251   1.70892 )
Epeak [keV] : 9991.66      ( -9996.11 -9996.11 )
Norm@50keV  : 9.41482E-03    ( -0.00215496   0.0416316 )
------------------------------------------------------------
#Fit statistic : Chi-Squared =          67.44 using 59 PHA bins.
# Reduced chi-squared =          1.204 for     56 degrees of freedom
# Null hypothesis probability =   1.407734e-01

Photon flux (15-150 keV)    in 1 sec: 1.08043 ( -0.274619  0.27281 ) ph/cm2/s
Energy fluence (15-150 keV)             : 1.00367e-07 ( -2.52376e-08  2.20777e-08 ) ergs/cm2
Time-resolved spectra
Distribution
T90 vs. Hardness ratio plot
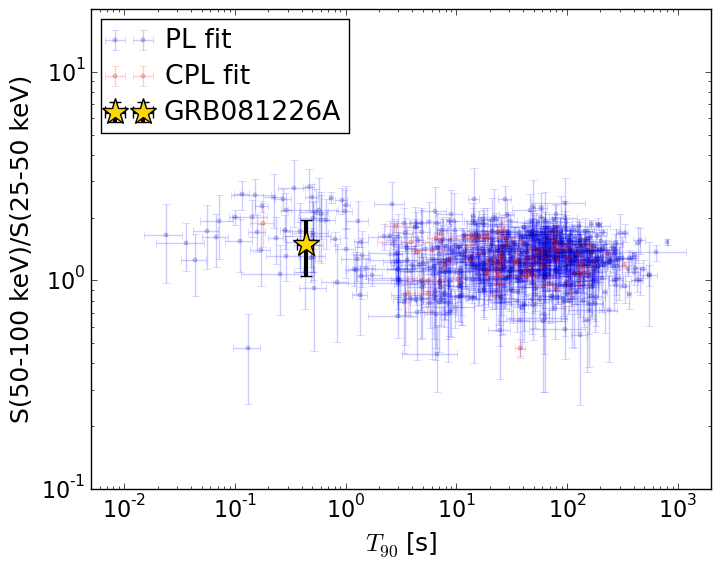
T90                                   = 0.436 sec.
Hardness ratio (energy fluence ratio) = 1.50065241463
S(15-50 keV) vs. S(50-150 keV) plot
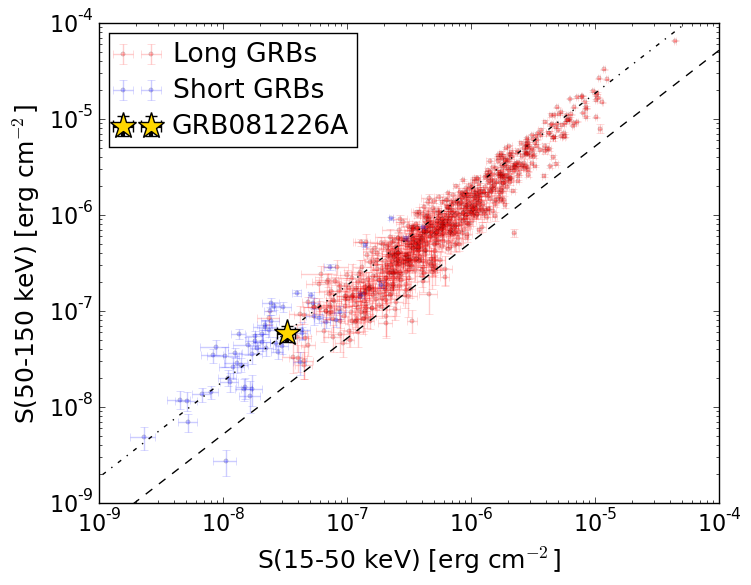
S(15-50 keV)  = 3.270387e-08
S(50-150 keV) = 5.835877e-08
The dash-dotted line and the dashed line traces the fluences calculated from the Band function with Epeak = 15 and 150 keV, respectively. Both lines assume a canonical values of alpha = -1 and beta = -2.5.
Mask shadow pattern
IMX = -1.011490977071833E+00, IMY = 3.854032440361417E-01
Spacecraft aspect plot
Bright source in the pre-burst/pre-slew/post-slew images
Pre-burst image of 15-350 keV band
Time interval of the image:
-239.736000 -0.052000

# RAcent  DECcent POSerr Theta    Phi  PeakCts   SNR AngSep     Name
#  [deg]    [deg]    ['] [deg]  [deg]                   [']
 28.1340   3.2928    2.0  47.0   11.8   2.0538   5.6 ------	UNKNOWN
Pre-slew background subtracted image of 15-350 keV band
Time interval of the image:
-0.052000 0.452000

# RAcent  DECcent POSerr Theta    Phi  PeakCts   SNR AngSep     Name
#  [deg]    [deg]    ['] [deg]  [deg]                   [']
 54.4277   7.6104    2.2  45.0   48.8   0.1575   5.2 ------	UNKNOWN
 79.4774 -10.6437    2.5  35.5   95.3   0.0793   4.6 ------	UNKNOWN
 19.3620   8.2995    2.4  55.8    5.3   0.1898   4.8 ------	UNKNOWN
136.0873 -51.1004    2.1  57.5  179.9   0.2425   5.6 ------	UNKNOWN
120.4831 -69.0160    1.1  47.3 -159.1   0.1621  10.4 ------	UNKNOWN
147.9854 -70.2264    2.2  56.6 -156.3   0.1851   5.2 ------	UNKNOWN
Post-slew image of 15-350 keV band
Time interval of the image:
78.564620 962.431200

# RAcent  DECcent POSerr Theta    Phi  PeakCts   SNR AngSep     Name
#  [deg]    [deg]    ['] [deg]  [deg]                   [']
135.5506 -40.5616    1.4  29.6  137.1   5.2786   8.5    1.1	Vela X-1
170.2718 -60.6197    1.4  22.0 -154.0   3.6421   8.3    1.3	Cen X-3
186.6506 -62.8194    2.1  26.3 -137.2   2.6621   5.5    3.0	GX 301-2
184.6763 -66.6179    3.3  23.2 -131.4   1.4652   3.6 ------	UNKNOWN
223.6233 -70.6724    2.8  31.3 -104.8   2.5338   4.2 ------	UNKNOWN
228.7143 -57.4100    2.7  43.4 -114.6   8.9487   4.2 ------	UNKNOWN