Analysis Summary
Notes:
- 1) No attempt has been made to eliminate the non-significant decimal places.
- 2) This batgrbproduct analysis is done using the HEASARC data.
- 3) This batgrbproduct analysis is using the flight position for the mask-weighting calculation.
======================================================================
                  BAT GRB EVENT DATA PROCESSING REPORT
    Process Script Ver: batgrbproduct v2.46
    Process Start Time: Sun Jan 19 19:33:32 EST 2014
             Host Name: batevent1
   Current Working Dir: /local/data/batevent/batevent_reproc/trigger338338
======================================================================

  Trigger: 00338338      Segment: 000

  BAT Trigger Time: 252119864.128   [s; MET]
      Trigger Stop: 252119865.152   [s; MET]
               UTC: 2008-12-28T01:17:40.758740    [includes UTCF correction]
       Where From?: TDRSS position message

  BAT
    RA: 39.4673999801958   Dec: 30.842582797203  [deg; J2000]

     Catalogged Source?: NO
     Point Source?:      YES
     GRB Indicated?:     YES    [ by BAT flight software ]
     Image S/N Ratio:    7.61
     Image Trigger?:     NO
     Rate S/N Ratio:     10.6770782520313  [ if not an image trigger ]
     Image S/N Ratio:    7.61

  Analysis Position:   [ source = BAT ]
    RA: 39.4673999801958   Dec: 30.842582797203  [deg; J2000]

  Refined Position:   [ source = BAT pre-slew burst ]
    RA: 39.4759056331836   Dec: 30.8348263027381  [deg; J2000]
        { 02h 37m 54.2s , +30d 50' 05.4" }
         +/- 2.30200780377269 [arcmin] (estimated 90% radius based on SNR)
         +/- 1.0858514668772 [arcmin] (formal 1-sigma fit error)
    SNR: 9.24321305285686

  Angular difference between the analysis and refined position is 0.639213 arcmin

  Partial Coding Fraction: 0.859375    [ including projection effects ]

  Duration
     T90: 3 +/- 1.4142135623731
        Measured from: -0.127999991178513
                   to: 2.87200000882149     [s; relative to TRIGTIME]
     T50: 2 +/- 1
        Measured from: -0.127999991178513
                   to: 1.87200000882149     [s; relative to TRIGTIME]


  Fluence
     Peak Flux  (peak 1 second)
        Measured from: -0.127999991178513
                   to: 0.872000008821487     [s; relative to TRIGTIME]
     Total Fluence
        Measured from: -0.127999991178513
                   to: 2.87200000882149     [s; relative to TRIGTIME]

             Band 1     Band 2     Band 3     Band 4
              15-25      25-50     50-100    100-350     keV
 Total     0.064128   0.085566   0.022239   0.001518
           0.009476   0.010039   0.008531   0.007280 [error]
 Peak      0.024167   0.036959   0.011511  -0.001401
           0.005495   0.005914   0.005126   0.004201 [error]

     [ fluence units of on-axis counts / fully illuminated detector ]

======================================================================


====== Table of the duration information =============================

        Value   tstart    tstop
T100    3.000   -0.128    2.872
T90     3.000   -0.128    2.872
T50     2.000   -0.128    1.872
Peak    1.000   -0.128    0.872


====== Spectral Analysis Summary =====================================

Model      : spectral model: simple power-law (PL) and cutoff power-law (CPL)
Ph_index   : photon index: E^{Ph_index}
Ph_90err   : 90% error of the photon index
Epeak      : Epeak in keV
Epeak_90err: 90% error of Epeak
Norm       : normalization at 50 keV in both the PL model and CPL model
Nomr_90err : 90% error of the normalization
chi2       : Chi-Squared
dof        : degree of freedo

=== Time-averaged spectral analysis ===
(Best model with acceptable fit: PL)

Model Ph_index Ph_90err_low Ph_90err_hi  Epeak  Epeak_90err_low  Epeak_90err_hi  Norm       Nomr_90err_low    Norm_90err_hi    chi2    dof
PL      -1.999    -0.309      0.284       -           -               -         3.35e-03     -7.09e-04          6.86e-04      56.290   57
CPL     -1.014    -1.118      2.672       37.428      N/A           N/A         1.37e-02        N/A               N/A         55.420   56


=== 1-s peak spectral analysis ===
(Best model with acceptable fit: PL)

Model Ph_index Ph_90err_low Ph_90err_hi  Epeak  Epeak_90err_low  Epeak_90err_hi  Norm       Nomr_90err_low    Norm_90err_hi    chi2    dof
PL      -1.816     -0.399     0.365       -           -               -         4.49e-03     -1.20e-03          1.16e-03      54.070   57
CPL      0.642     -2.451     4.945       41.633      -9.136        93.501      1.32e-01     -1.32e-01          1.36e+02      51.250   56


=== Fluence/Peak Flux Summary ===

              Model    Band1     Band2     Band3     Band4     Band5     Total
                       15-25     25-50    50-100    100-350    15-150    15-350    keV
Fluence         PL   2.06e-08  2.79e-08  2.79e-08  5.05e-08  9.27e-08  1.27e-07   erg/cm2
      90%_error_low -4.29e-09 -4.51e-09 -7.75e-09 -2.29e-08 -1.80e-08 -3.33e-08   erg/cm2
      90%_error_hi   4.38e-09  4.48e-09  8.09e-09  3.30e-08  1.87e-08  4.12e-08   erg/cm2
Peak flux       PL   2.51e-01  2.09e-01  1.19e-01  1.00e-01  6.23e-01  6.79e-01   ph/cm2/s
      90%_error_low -7.50e-02 -4.59e-02 -3.97e-02 -5.19e-02 -1.37e-01 -1.52e-01   ph/cm2/s
      90%_error_hi   7.90e-02  4.59e-02  4.07e-02  7.69e-02  1.37e-01  1.54e-01   ph/cm2/s

Fluence        CPL    N/A      N/A      N/A      N/A      N/A      N/A      erg/cm2
      90%_error_low -4.29e-09 -4.51e-09 -7.75e-09 -2.29e-08 -1.80e-08 -3.33e-08   erg/cm2
      90%_error_hi   4.38e-09  4.48e-09  8.09e-09  3.30e-08  1.87e-08  4.12e-08   erg/cm2
Peak flux      CPL   2.05e-01  2.73e-01  9.58e-02  5.21e-03  5.79e-01  5.79e-01   ph/cm2/s
      90%_error_low -9.37e-02 -7.23e-02 -9.58e-02 -5.21e-03 -1.39e-01 -1.39e-01   ph/cm2/s
      90%_error_hi   9.38e-02  8.05e-02  5.86e-02  9.32e-02  1.42e-01  1.46e-01   ph/cm2/s

======================================================================
Image
Pre-slew 15.0-350.0 keV image (Event data)
#   RAcent    DECcent   POSerr    Theta     Phi              Peak Cts       SNR   Name
   39.4759    30.8348   0.0208    25.9023     4.7075         0.1629767      9.243 TRIG_00338338

Foreground time interval of the image:
 -0.128   2.872 (delta_t =   3.000 [sec])
Background time interval of the image:
-266.827  -0.128 (delta_t = 266.699 [sec])
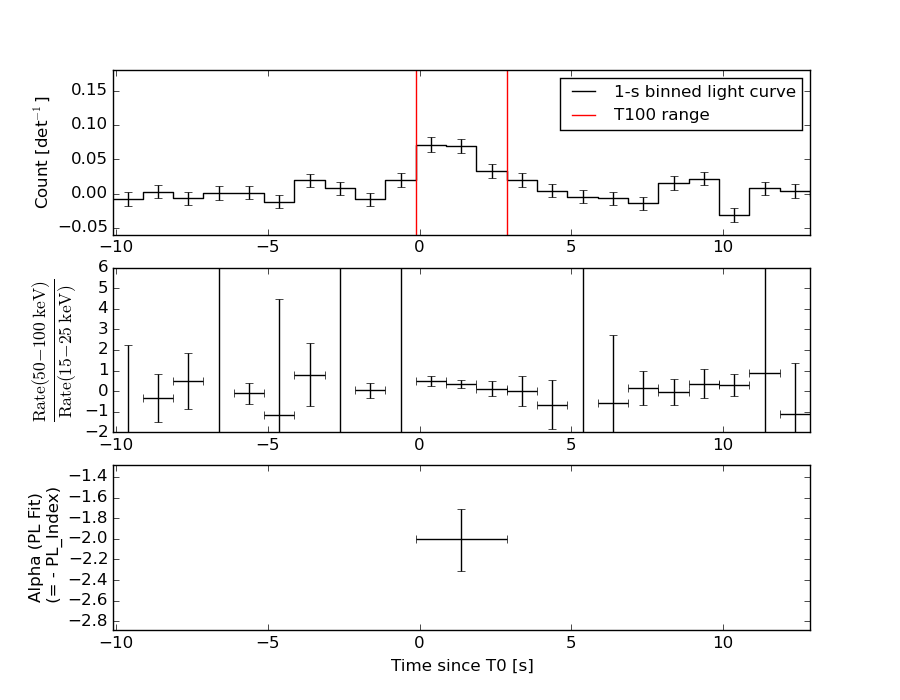
Light Curves
Note: The mask-weighted lightcurves have units of either count/det or counts/sec/det, where a det is 0.4 x 0.4 = 0.16 sq cm.
Full-time range; 1 s binning
Other quick-look light curves:
- 64 ms binning (zoomed)
- 16 ms binning (zoomed)
- 8 ms binning (zoomed)
- 2 ms binning (zoomed)
- SN=5 or 10 s binning (full-time range)
- Raw light curve
Spectra
- 64 ms binning (zoomed)
- 16 ms binning (zoomed)
- 8 ms binning (zoomed)
- 2 ms binning (zoomed)
- SN=5 or 10 s binning (full-time range)
- Raw light curve
Spectra
Notes:
- 1) The fitting includes the systematic errors.
- 2) When the burst includes telescope slew time periods, the fitting uses an average response file made from multiple 5-s response files through out the slew time plus single time preiod for the non-slew times, and weighted by the total counts in the corresponding time period using addrmf. An average response file is needed becuase a spectral fit using the pre-slew DRM will introduce some errors in both a spectral shape and a normalization if the PHA file contains a lot of the slew/post-slew time interval.
- 3) For fits to more complicated models (e.g. a power-law over a cutoff power-law), the BAT team has decided to require a chi-square improvement of more than 6 for each extra dof.
Time averaged spectrum fit using the average DRM
Power-law model
Time interval is from   -0.128 sec. to    2.872 sec.

Spectral model in power-law:
------------------------------------------------------------
Parameters  : value       lower 90%   higher 90%
Photon index: -1.99891     ( -0.309248   0.283642 )
Norm@50keV  : 3.35209E-03    ( -0.000709289   0.0006864 )
------------------------------------------------------------
#Fit statistic : Chi-Squared =          56.29 using 59 PHA bins.
# Reduced chi-squared =         0.9875 for     57 degrees of freedom
# Null hypothesis probability =   5.018691e-01

Photon flux (15-150 keV)    in 3 sec: 0.502599 ( -0.078992  0.078993 ) ph/cm2/s
Energy fluence (15-150 keV)             : 9.27474e-08 ( -1.80352e-08  1.86901e-08 ) ergs/cm2
Cutoff power-law model
Time interval is from   -0.128 sec. to    2.872 sec.
Spectral model in the cutoff power-law:
------------------------------------------------------------
Parameters  : value       lower 90%   higher 90%
Photon index: -1.0142     ( -1.12531   2.66476 )
Epeak [keV] : 37.4280      (   )
Norm@50keV  : 1.36890E-02    (     )
------------------------------------------------------------
#Fit statistic : Chi-Squared =          55.42 using 59 PHA bins.
# Reduced chi-squared =         0.9897 for     56 degrees of freedom
# Null hypothesis probability =   4.966080e-01

Photon flux (15-150 keV)    in 3 sec: 0.486886 ( -0.083335  0.084122 ) ph/cm2/s
Energy fluence (15-150 keV)             : 0 ( 0  0 ) ergs/cm2
1-s peak spectrum fit
Power-law model
Time interval is from   -0.128 sec. to    0.872 sec.

Spectral model in power-law:
------------------------------------------------------------
Parameters  : value       lower 90%   higher 90%
Photon index: -1.8161     ( -0.399346   0.365052 )
Norm@50keV  : 4.49016E-03    ( -0.00119946   0.0011587 )
------------------------------------------------------------
#Fit statistic : Chi-Squared =          54.07 using 59 PHA bins.
# Reduced chi-squared =         0.9485 for     57 degrees of freedom
# Null hypothesis probability =   5.858775e-01

Photon flux (15-150 keV)    in 1 sec: 0.622671 ( -0.136615  0.136619 ) ph/cm2/s
Energy fluence (15-150 keV)             : 4.13228e-08 ( -1.08094e-08  1.12644e-08 ) ergs/cm2
Cutoff power-law model
Time interval is from   -0.128 sec. to    0.872 sec.
Spectral model in the cutoff power-law:
------------------------------------------------------------
Parameters  : value       lower 90%   higher 90%
Photon index: 0.642037     ( -2.53519   4.86066 )
Epeak [keV] : 41.6333      ( -8.8385 93.7984 )
Norm@50keV  : 0.131763    ( -0.168833   136.094 )
------------------------------------------------------------
#Fit statistic : Chi-Squared =          51.25 using 59 PHA bins.
# Reduced chi-squared =         0.9151 for     56 degrees of freedom
# Null hypothesis probability =   6.550274e-01

Photon flux (15-150 keV)    in 1 sec: 0.578799 ( -0.138729  0.142003 ) ph/cm2/s
Energy fluence (15-150 keV)             : 3.26829e-08 ( -9.0346e-09  1.32782e-08 ) ergs/cm2
Time-resolved spectra
Distribution
T90 vs. Hardness ratio plot
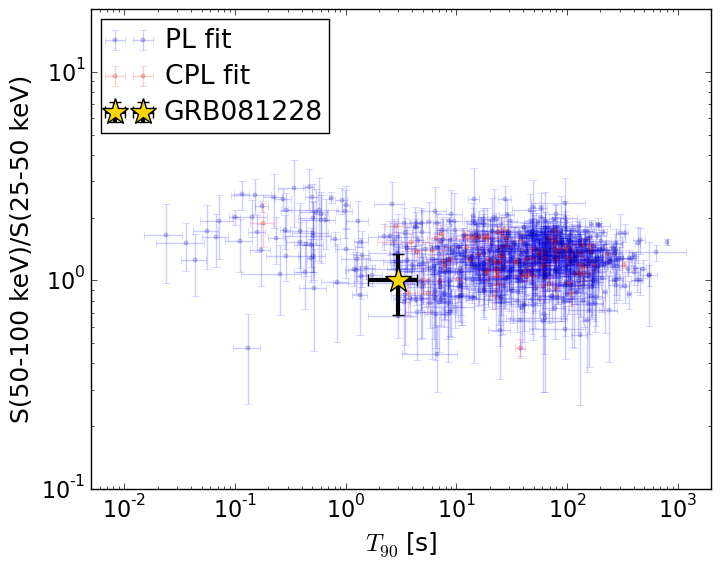
T90                                   = 3.0 sec.
Hardness ratio (energy fluence ratio) = 1.00080616007
S(15-50 keV) vs. S(50-150 keV) plot
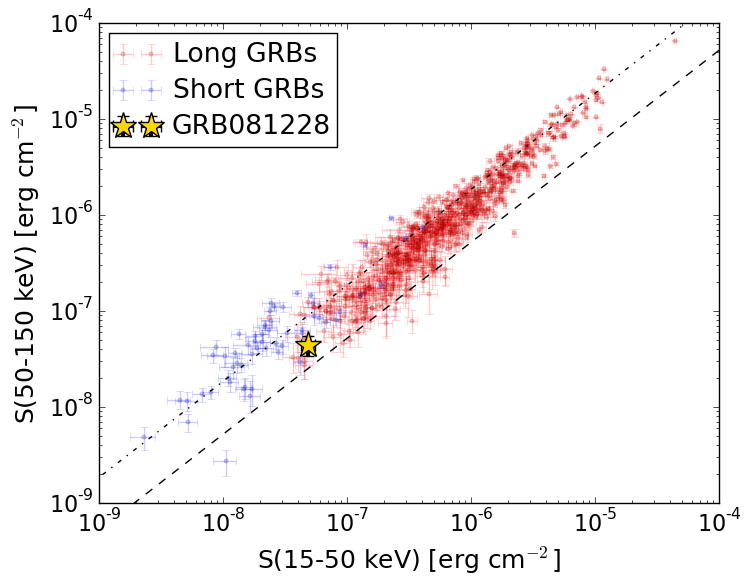
S(15-50 keV)  = 4.846811e-08
S(50-150 keV) = 4.428122e-08
The dash-dotted line and the dashed line traces the fluences calculated from the Band function with Epeak = 15 and 150 keV, respectively. Both lines assume a canonical values of alpha = -1 and beta = -2.5.
Mask shadow pattern
IMX = 4.839855197255994E-01, IMY = -3.985472905366623E-02
Spacecraft aspect plot
Bright source in the pre-burst/pre-slew/post-slew images
Pre-burst image of 15-350 keV band
Time interval of the image:
-266.827400 -0.128000

# RAcent  DECcent POSerr Theta    Phi  PeakCts   SNR AngSep     Name
#  [deg]    [deg]    ['] [deg]  [deg]                   [']
 83.6482  21.9887    0.8  39.4   80.5  10.6897  14.4    1.8	Crab
 58.5796 -17.1100    2.2  25.8  171.1   1.0297   5.2 ------	UNKNOWN
 23.5281  54.1909    2.1  51.8    1.7   2.9489   5.6 ------	UNKNOWN
 16.5506   0.6626    2.8  30.3  -80.1   1.1146   4.0 ------	UNKNOWN
Pre-slew background subtracted image of 15-350 keV band
Time interval of the image:
-0.128000 2.872000

# RAcent  DECcent POSerr Theta    Phi  PeakCts   SNR AngSep     Name
#  [deg]    [deg]    ['] [deg]  [deg]                   [']
 83.6424  22.0237  164.7  39.4   80.5   0.0049   0.1    0.8	Crab
 76.8603  -1.7759    2.5  31.3  121.6   0.1338   4.6 ------	UNKNOWN
 39.4759  30.8349    1.2  25.9    4.7   0.1630   9.2 ------	UNKNOWN
 42.8218 -29.8312    2.4  35.8 -156.0   0.1007   4.9 ------	UNKNOWN
Post-slew image of 15-350 keV band
Time interval of the image:
61.972590 119.572590

# RAcent  DECcent POSerr Theta    Phi  PeakCts   SNR AngSep     Name
#  [deg]    [deg]    ['] [deg]  [deg]                   [']
 53.5882 -19.3789    2.1  52.0  169.7   1.4407   5.5 ------	UNKNOWN
343.6584  63.4051    2.4  47.6  -23.4   0.6928   4.8 ------	UNKNOWN
 10.8435  -7.4790    3.2  47.1 -132.9   0.9329   3.6 ------	UNKNOWN