Analysis Summary
Notes:
- 1) No attempt has been made to eliminate the non-significant decimal places.
- 2) This batgrbproduct analysis is done using the HEASARC data.
- 3) This batgrbproduct analysis is using the flight position for the mask-weighting calculation.
======================================================================
BAT GRB EVENT DATA PROCESSING REPORT
Process Script Ver: batgrbproduct v2.46
Process Start Time: Sun Jan 19 19:28:26 EST 2014
Host Name: batevent1
Current Working Dir: /local/data/batevent/batevent_reproc/trigger338633
======================================================================
Trigger: 00338633 Segment: 000
BAT Trigger Time: 252362176 [s; MET]
Trigger Stop: 252362240 [s; MET]
UTC: 2008-12-30T20:36:12.623340 [includes UTCF correction]
Where From?: TDRSS position message
BAT
RA: 37.3152367645834 Dec: -25.1417564760223 [deg; J2000]
Catalogged Source?: NO
Point Source?: YES
GRB Indicated?: YES [ by BAT flight software ]
Image S/N Ratio: 16.75
Image Trigger?: YES
Rate S/N Ratio: 0 [ if not an image trigger ]
Image S/N Ratio: 16.75
Analysis Position: [ source = BAT ]
RA: 37.3152367645834 Dec: -25.1417564760223 [deg; J2000]
Refined Position: [ source = BAT pre-slew burst ]
RA: 37.3288399927385 Dec: -25.1448324239261 [deg; J2000]
{ 02h 29m 18.9s , -25d 08' 41.4" }
+/- 1.41449278620275 [arcmin] (estimated 90% radius based on SNR)
+/- 0.746061551724216 [arcmin] (formal 1-sigma fit error)
SNR: 18.5342266712082
Angular difference between the analysis and refined position is 0.761559 arcmin
Partial Coding Fraction: 1 [ including projection effects ]
Duration
T90: 60.6920000314713 +/- 13.4261312506135
Measured from: -0.904000014066696
to: 59.7880000174046 [s; relative to TRIGTIME]
T50: 21.4160000085831 +/- 3.70535829583426
Measured from: 31.1319999992847
to: 52.5480000078678 [s; relative to TRIGTIME]
Fluence
Peak Flux (peak 1 second)
Measured from: 46.6279999911785
to: 47.6279999911785 [s; relative to TRIGTIME]
Total Fluence
Measured from: -14.4320000112057
to: 62.4280000030994 [s; relative to TRIGTIME]
Band 1 Band 2 Band 3 Band 4
15-25 25-50 50-100 100-350 keV
Total 0.570028 0.637352 0.330430 0.042289
0.041498 0.043259 0.037976 0.033052 [error]
Peak 0.026244 0.032503 0.026378 0.006827
0.004949 0.005239 0.004540 0.003777 [error]
[ fluence units of on-axis counts / fully illuminated detector ]
======================================================================
====== Table of the duration information =============================
Value tstart tstop
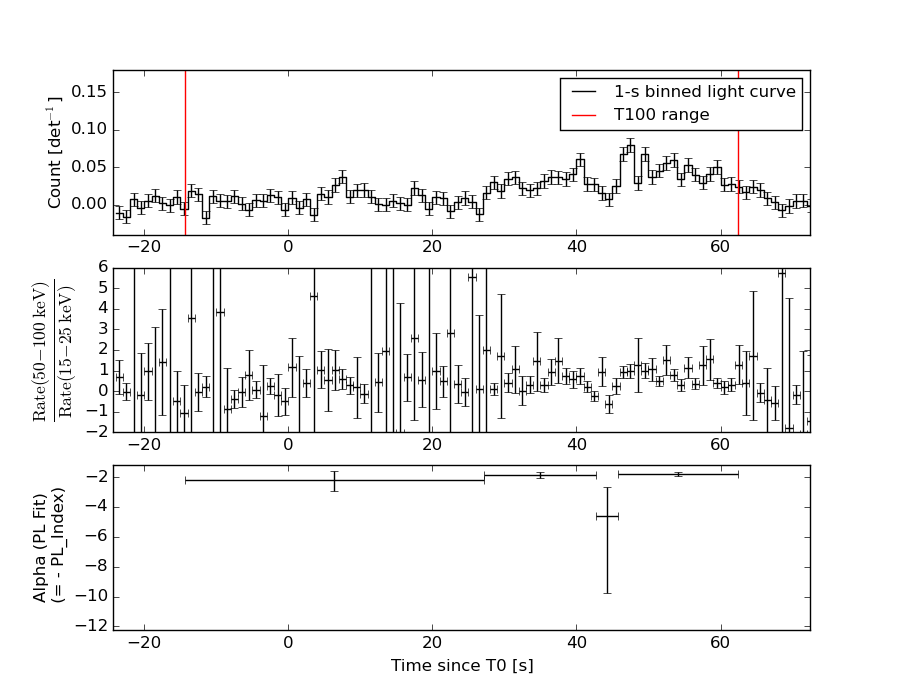
T100 76.860 -14.432 62.428
T90 60.692 -0.904 59.788
T50 21.416 31.132 52.548
Peak 1.000 46.628 47.628
====== Spectral Analysis Summary =====================================
Model : spectral model: simple power-law (PL) and cutoff power-law (CPL)
Ph_index : photon index: E^{Ph_index}
Ph_90err : 90% error of the photon index
Epeak : Epeak in keV
Epeak_90err: 90% error of Epeak
Norm : normalization at 50 keV in both the PL model and CPL model
Nomr_90err : 90% error of the normalization
chi2 : Chi-Squared
dof : degree of freedo
=== Time-averaged spectral analysis ===
(Best model with acceptable fit: PL)
Model Ph_index Ph_90err_low Ph_90err_hi Epeak Epeak_90err_low Epeak_90err_hi Norm Nomr_90err_low Norm_90err_hi chi2 dof
PL -1.914 -0.159 0.153 - - - 1.21e-03 -1.21e-04 1.19e-04 43.100 57
CPL -1.487 -0.589 0.690 52.164 -40.052 -52.164 2.11e-03 -1.09e-03 3.00e-03 41.590 56
=== 1-s peak spectral analysis ===
(Best model with acceptable fit: PL)
Model Ph_index Ph_90err_low Ph_90err_hi Epeak Epeak_90err_low Epeak_90err_hi Norm Nomr_90err_low Norm_90err_hi chi2 dof
PL -1.431 -0.290 0.289 - - - 5.76e-03 -9.96e-04 9.86e-04 56.840 57
CPL -1.265 N/A N/A 214.026 N/A N/A 7.05e-03 N/A N/A 56.770 56
=== Fluence/Peak Flux Summary ===
Model Band1 Band2 Band3 Band4 Band5 Total
15-25 25-50 50-100 100-350 15-150 15-350 keV
Fluence PL 1.76e-07 2.52e-07 2.67e-07 5.25e-07 8.59e-07 1.22e-06 erg/cm2
90%_error_low -2.08e-08 -2.01e-08 -3.64e-08 -1.32e-07 -8.25e-08 -1.72e-07 erg/cm2
90%_error_hi 2.14e-08 2.01e-08 3.69e-08 1.59e-07 8.40e-08 1.93e-07 erg/cm2
Peak flux PL 2.22e-01 2.33e-01 1.73e-01 2.07e-01 7.07e-01 8.34e-01 ph/cm2/s
90%_error_low -6.10e-02 -4.17e-02 -3.73e-02 -7.83e-02 -1.19e-01 -1.44e-01 ph/cm2/s
90%_error_hi 6.50e-02 4.11e-02 3.68e-02 1.04e-01 1.19e-01 1.46e-01 ph/cm2/s
Fluence CPL 1.68e-07 2.64e-07 2.64e-07 2.53e-07 8.21e-07 9.49e-07 erg/cm2
90%_error_low -2.39e-08 -2.61e-08 -4.03e-08 -1.55e-07 -9.57e-08 -1.88e-07 erg/cm2
90%_error_hi 2.40e-08 2.70e-08 3.93e-08 3.16e-07 9.82e-08 3.46e-07 erg/cm2
Peak flux CPL 2.17e-01 2.37e-01 1.75e-01 1.66e-01 7.03e-01 7.95e-01 ph/cm2/s
90%_error_low -7.07e-02 -4.55e-02 -3.90e-02 -1.66e-01 -1.22e-01 -1.85e-01 ph/cm2/s
90%_error_hi 6.54e-02 5.28e-02 4.12e-02 8.80e-02 1.21e-01 1.82e-01 ph/cm2/s
======================================================================
Image
Pre-slew 15.0-350.0 keV image (Event data)
#   RAcent    DECcent   POSerr    Theta     Phi              Peak Cts       SNR   Name
   37.3288   -25.1448   0.0103    18.4624   -14.1208         1.6045877     18.534 TRIG_00338633

Foreground time interval of the image:
-14.432  62.428 (delta_t =  76.860 [sec])
Background time interval of the image:
-263.899 -14.432 (delta_t = 249.467 [sec])
Light Curves
Note: The mask-weighted lightcurves have units of either count/det or counts/sec/det, where a det is 0.4 x 0.4 = 0.16 sq cm.
Full-time range; 1 s binning
Other quick-look light curves:
- 64 ms binning (zoomed)
- 16 ms binning (zoomed)
- 8 ms binning (zoomed)
- 2 ms binning (zoomed)
- SN=5 or 10 s binning (full-time range)
- Raw light curve
Spectra
- 64 ms binning (zoomed)
- 16 ms binning (zoomed)
- 8 ms binning (zoomed)
- 2 ms binning (zoomed)
- SN=5 or 10 s binning (full-time range)
- Raw light curve
Spectra
Notes:
- 1) The fitting includes the systematic errors.
- 2) When the burst includes telescope slew time periods, the fitting uses an average response file made from multiple 5-s response files through out the slew time plus single time preiod for the non-slew times, and weighted by the total counts in the corresponding time period using addrmf. An average response file is needed becuase a spectral fit using the pre-slew DRM will introduce some errors in both a spectral shape and a normalization if the PHA file contains a lot of the slew/post-slew time interval.
- 3) For fits to more complicated models (e.g. a power-law over a cutoff power-law), the BAT team has decided to require a chi-square improvement of more than 6 for each extra dof.
Time averaged spectrum fit using the average DRM
Power-law model

Time interval is from  -14.432 sec. to   62.428 sec.

Spectral model in power-law:
------------------------------------------------------------
Parameters  : value       lower 90%   higher 90%
Photon index: -1.91432     ( -0.159018   0.152891 )
Norm@50keV  : 1.21458E-03    ( -0.000120747   0.000118532 )
------------------------------------------------------------
#Fit statistic : Chi-Squared =          43.10 using 59 PHA bins.
# Reduced chi-squared =         0.7562 for     57 degrees of freedom
# Null hypothesis probability =   9.133322e-01

Photon flux (15-150 keV)    in 76.86 sec: 0.175385 ( -0.014082  0.014089 ) ph/cm2/s
Energy fluence (15-150 keV)             : 8.58557e-07 ( -8.25054e-08  8.40495e-08 ) ergs/cm2
Cutoff power-law model
Time interval is from  -14.432 sec. to   62.428 sec.
Spectral model in the cutoff power-law:
------------------------------------------------------------
Parameters  : value       lower 90%   higher 90%
Photon index: -1.48688     ( -0.588989   0.689562 )
Epeak [keV] : 52.1641      ( -40.0524 -52.1641 )
Norm@50keV  : 2.10617E-03    ( -0.00109238   0.00299553 )
------------------------------------------------------------
#Fit statistic : Chi-Squared =          41.59 using 59 PHA bins.
# Reduced chi-squared =         0.7427 for     56 degrees of freedom
# Null hypothesis probability =   9.243762e-01

Photon flux (15-150 keV)    in 76.86 sec: 0.171779 ( -0.014922  0.014909 ) ph/cm2/s
Energy fluence (15-150 keV)             : 8.20557e-07 ( -9.56538e-08  9.81564e-08 ) ergs/cm2
1-s peak spectrum fit
Power-law model

Time interval is from   46.628 sec. to   47.628 sec.

Spectral model in power-law:
------------------------------------------------------------
Parameters  : value       lower 90%   higher 90%
Photon index: -1.43109     ( -0.290112   0.288864 )
Norm@50keV  : 5.76227E-03    ( -0.00099621   0.000986198 )
------------------------------------------------------------
#Fit statistic : Chi-Squared =          56.84 using 59 PHA bins.
# Reduced chi-squared =         0.9972 for     57 degrees of freedom
# Null hypothesis probability =   4.810769e-01

Photon flux (15-150 keV)    in 1 sec: 0.706865 ( -0.119131  0.119243 ) ph/cm2/s
Energy fluence (15-150 keV)             : 5.53439e-08 ( -1.05571e-08  1.07361e-08 ) ergs/cm2
Cutoff power-law model
Time interval is from   46.628 sec. to   47.628 sec.
Spectral model in the cutoff power-law:
------------------------------------------------------------
Parameters  : value       lower 90%   higher 90%
Photon index: -1.26533     (       )
Epeak [keV] : 214.026      (   )
Norm@50keV  : 7.04881E-03    (     )
------------------------------------------------------------
#Fit statistic : Chi-Squared =          56.77 using 59 PHA bins.
# Reduced chi-squared =          1.014 for     56 degrees of freedom
# Null hypothesis probability =   4.460756e-01

Photon flux (15-150 keV)    in 1 sec: 0.702986 ( -0.12215  0.121347 ) ph/cm2/s
Energy fluence (15-150 keV)             : 5.45444e-08 ( -1.18855e-08  1.13381e-08 ) ergs/cm2
Time-resolved spectra
Distribution
T90 vs. Hardness ratio plot
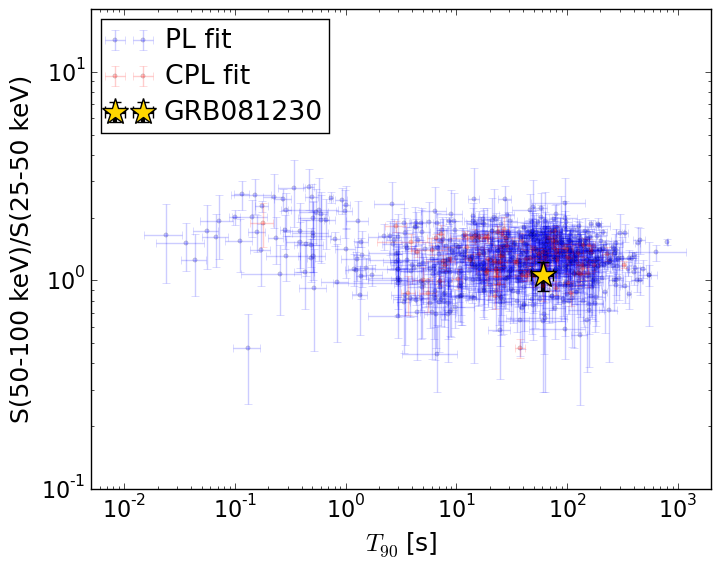
T90                                   = 60.692 sec.
Hardness ratio (energy fluence ratio) = 1.06125566483
S(15-50 keV) vs. S(50-150 keV) plot
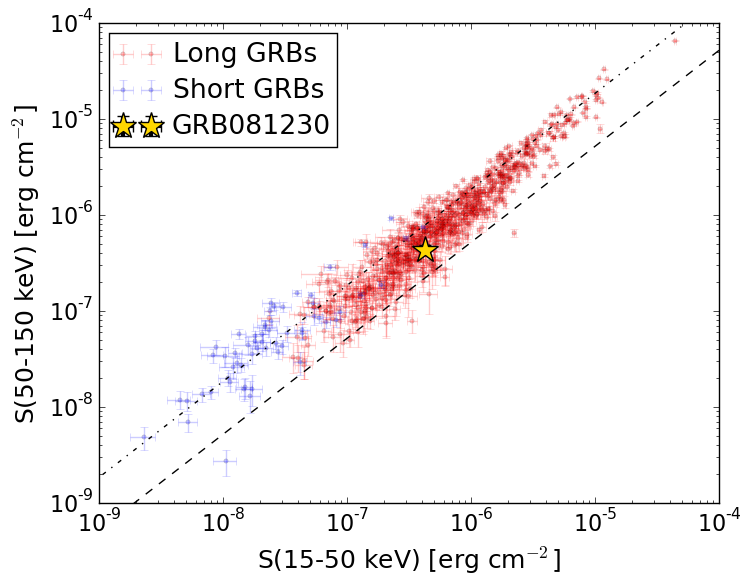
S(15-50 keV)  = 4.277692e-07
S(50-150 keV) = 4.307818e-07
The dash-dotted line and the dashed line traces the fluences calculated from the Band function with Epeak = 15 and 150 keV, respectively. Both lines assume a canonical values of alpha = -1 and beta = -2.5.
Mask shadow pattern
IMX = 3.237772217447339E-01, IMY = 8.145229681387896E-02
Spacecraft aspect plot
Bright source in the pre-burst/pre-slew/post-slew images
Pre-burst image of 15-350 keV band
Time interval of the image:
-263.899410 -14.432000

# RAcent  DECcent POSerr Theta    Phi  PeakCts   SNR AngSep     Name
#  [deg]    [deg]    ['] [deg]  [deg]                   [']
126.8207 -44.5284    2.4  53.9  161.1   4.9071   4.7 ------	UNKNOWN
 21.8153   0.5255    2.3  47.9   -6.3   1.6255   5.0 ------	UNKNOWN
Pre-slew background subtracted image of 15-350 keV band
Time interval of the image:
-14.432000 62.428000

# RAcent  DECcent POSerr Theta    Phi  PeakCts   SNR AngSep     Name
#  [deg]    [deg]    ['] [deg]  [deg]                   [']
136.7863 -60.2387    2.1  55.0 -178.2   1.9253   5.4 ------	UNKNOWN
 37.3288 -25.1449    0.6  18.5  -14.1   1.6051  18.5 ------	UNKNOWN
Post-slew image of 15-350 keV band
Time interval of the image:
113.300600 789.700590

# RAcent  DECcent POSerr Theta    Phi  PeakCts   SNR AngSep     Name
#  [deg]    [deg]    ['] [deg]  [deg]                   [']
 45.8204   8.6484    2.4  34.8   48.0   2.7793   4.7 ------	UNKNOWN
 30.2910  24.4842    3.2  50.1   24.8   4.8447   3.7 ------	UNKNOWN