Analysis Summary
Notes:
- 1) No attempt has been made to eliminate the non-significant decimal places.
- 2) This batgrbproduct analysis is done using the HEASARC data.
- 3) This batgrbproduct analysis is using the flight position for the mask-weighting calculation.
======================================================================
BAT GRB EVENT DATA PROCESSING REPORT
Process Script Ver: batgrbproduct v2.46
Process Start Time: Sat May 9 19:04:13 EDT 2015
Host Name: bat1
Current Working Dir: /local/data/bat1/alien/Swift_3rdBATcatalog/event/batevent_reproc/trigger338895
======================================================================
Trigger: 00338895 Segment: 000
BAT Trigger Time: 252557749.248 [s; MET]
Trigger Stop: 252557751.296 [s; MET]
UTC: 2009-01-02T02:55:44.865380 [includes UTCF correction]
Where From?: TDRSS position message
BAT
RA: 128.258919212618 Dec: 33.0915130874167 [deg; J2000]
Catalogged Source?: NO
Point Source?: YES
GRB Indicated?: YES [ by BAT flight software ]
Image S/N Ratio: 9.37
Image Trigger?: NO
Rate S/N Ratio: 77.517739905134 [ if not an image trigger ]
Image S/N Ratio: 9.37
Analysis Position: [ source = BAT ]
RA: 128.258919212618 Dec: 33.0915130874167 [deg; J2000]
Refined Position: [ source = BAT pre-slew burst ]
RA: 128.247387036973 Dec: 33.1077849115167 [deg; J2000]
{ 08h 32m 59.4s , +33d 06' 28.0" }
+/- 1.26481692995552 [arcmin] (estimated 90% radius based on SNR)
+/- 0.550582427740074 [arcmin] (formal 1-sigma fit error)
SNR: 21.7452580368133
Angular difference between the analysis and refined position is 1.135416 arcmin
Partial Coding Fraction: 0.06835938 [ including projection effects ]
Duration
T90: 28.3199999928474 +/- 2.34567860066996
Measured from: -11.6960000097752
to: 16.6239999830723 [s; relative to TRIGTIME]
T50: 12.0639999806881 +/- 1.51898913226029
Measured from: -6.52799999713898
to: 5.53599998354912 [s; relative to TRIGTIME]
Fluence
Peak Flux (peak 1 second)
Measured from: 1.68400001525879
to: 2.68400001525879 [s; relative to TRIGTIME]
Total Fluence
Measured from: -14.255999982357
to: 22.7520000040531 [s; relative to TRIGTIME]
Band 1 Band 2 Band 3 Band 4
15-25 25-50 50-100 100-350 keV
Total 2.059411 3.418273 3.105243 1.472189
0.142032 0.155431 0.148263 0.125256 [error]
Peak 0.084086 0.234566 0.285712 0.135476
0.024096 0.030848 0.034590 0.030165 [error]
[ fluence units of on-axis counts / fully illuminated detector ]
======================================================================
====== Table of the duration information =============================
Value tstart tstop
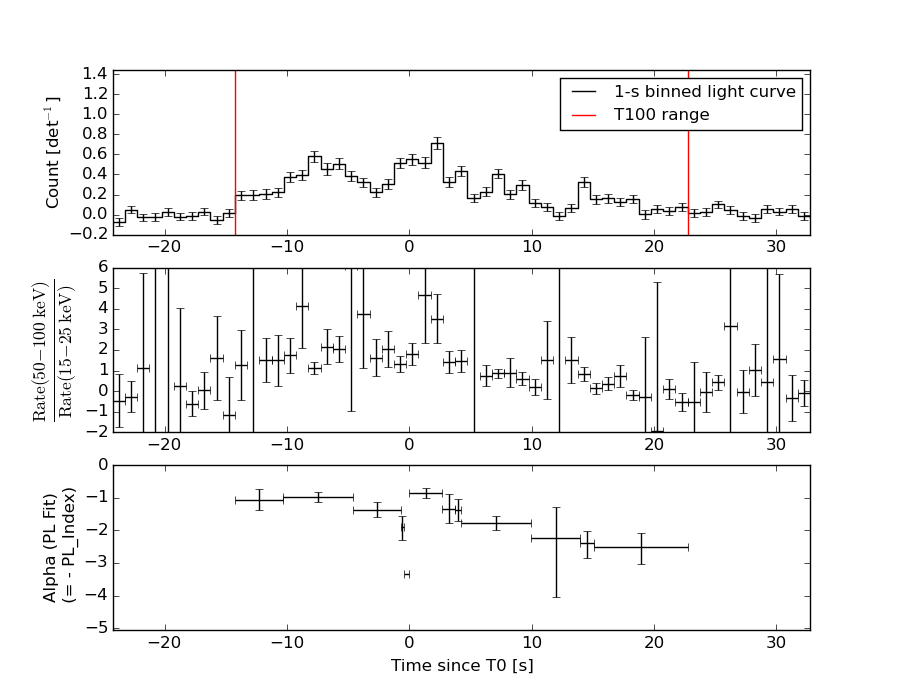
T100 37.008 -14.256 22.752
T90 28.320 -11.696 16.624
T50 12.064 -6.528 5.536
Peak 1.000 1.684 2.684
====== Spectral Analysis Summary =====================================
Model : spectral model: simple power-law (PL) and cutoff power-law (CPL)
Ph_index : photon index: E^{Ph_index}
Ph_90err : 90% error of the photon index
Epeak : Epeak in keV
Epeak_90err: 90% error of Epeak
Norm : normalization at 50 keV in both the PL model and CPL model
Nomr_90err : 90% error of the normalization
chi2 : Chi-Squared
dof : degree of freedo
=== Time-averaged spectral analysis ===
(Best model with acceptable fit: PL)
Model Ph_index Ph_90err_low Ph_90err_hi Epeak Epeak_90err_low Epeak_90err_hi Norm Nomr_90err_low Norm_90err_hi chi2 dof
PL -1.326 -0.087 0.088 - - - 1.94e-02 -9.40e-04 9.40e-04 55.840 57
CPL -1.238 -0.131 0.315 443.773 -292.877 -443.773 2.13e-02 -2.68e-03 7.87e-03 55.900 56
=== 1-s peak spectral analysis ===
(Best model with acceptable fit: N/A)
Model Ph_index Ph_90err_low Ph_90err_hi Epeak Epeak_90err_low Epeak_90err_hi Norm Nomr_90err_low Norm_90err_hi chi2 dof
PL -0.914 -0.230 0.238 - - - 4.82e-02 -6.85e-03 6.81e-03 64.670 57
CPL -0.322 -0.700 1.165 162.108 -162.108 -162.108 8.93e-02 -4.60e-02 2.00e-01 63.540 56
=== Fluence/Peak Flux Summary ===
Model Band1 Band2 Band3 Band4 Band5 Total
15-25 25-50 50-100 100-350 15-150 15-350 keV
Fluence PL 7.80e-07 1.60e-06 2.54e-06 9.04e-06 7.06e-06 1.40e-05 erg/cm2
90%_error_low -7.35e-08 -9.03e-08 -1.47e-07 -1.13e-06 -3.67e-07 -1.22e-06 erg/cm2
90%_error_hi 7.60e-08 8.97e-08 1.46e-07 1.24e-06 3.68e-07 1.31e-06 erg/cm2
Peak flux PL 3.56e-04 4.45e-03 4.64e-02 4.31e+00 2.09e-01 3.98e+00 ph/cm2/s
90%_error_low -4.73e-05 -6.30e-04 -3.22e-03 -5.57e-01 -1.33e-02 -3.18e-01 ph/cm2/s
90%_error_hi 5.48e-04 5.56e-03 5.47e-02 2.92e+00 2.24e-01 4.41e+00 ph/cm2/s
Fluence CPL 7.71e-07 1.60e-06 2.56e-06 8.41e-06 7.04e-06 1.33e-05 erg/cm2
90%_error_low -9.21e-08 -9.06e-08 -1.57e-07 -3.03e-06 -3.87e-07 -3.00e-06 erg/cm2
90%_error_hi 7.14e-08 9.89e-08 1.71e-07 9.21e-07 3.47e-07 7.38e-07 erg/cm2
Peak flux CPL 9.81e-01 1.69e+00 1.85e+00 1.93e+00 5.45e+00 6.46e+00 ph/cm2/s
90%_error_low -3.65e-01 -3.15e-01 -3.31e-01 -1.11e+00 -7.97e-01 -1.38e+00 ph/cm2/s
90%_error_hi 4.08e-01 3.25e-01 3.41e-01 1.85e+00 7.98e-01 2.07e+00 ph/cm2/s
======================================================================
Image
Pre-slew 15.0-350.0 keV image (Event data)
#   RAcent    DECcent   POSerr    Theta     Phi              Peak Cts       SNR   Name
  128.2474    33.1078   0.0089    45.2149    46.1530        10.7360376     21.745 TRIG_00338895

Foreground time interval of the image:
-14.256  22.752 (delta_t =  37.008 [sec])
Background time interval of the image:
-239.248 -14.256 (delta_t = 224.992 [sec])
Light Curves
Note: The mask-weighted lightcurves have units of either count/det or counts/sec/det, where a det is 0.4 x 0.4 = 0.16 sq cm.
Full-time range; 1 s binning
Other quick-look light curves:
- 64 ms binning (zoomed)
- 16 ms binning (zoomed)
- 8 ms binning (zoomed)
- 2 ms binning (zoomed)
- SN=5 or 10 s binning (full-time range)
- Raw light curve
Spectra
- 64 ms binning (zoomed)
- 16 ms binning (zoomed)
- 8 ms binning (zoomed)
- 2 ms binning (zoomed)
- SN=5 or 10 s binning (full-time range)
- Raw light curve
Spectra
Notes:
- 1) The fitting includes the systematic errors.
- 2) When the burst includes telescope slew time periods, the fitting uses an average response file made from multiple 5-s response files through out the slew time plus single time preiod for the non-slew times, and weighted by the total counts in the corresponding time period using addrmf. An average response file is needed becuase a spectral fit using the pre-slew DRM will introduce some errors in both a spectral shape and a normalization if the PHA file contains a lot of the slew/post-slew time interval.
- 3) For fits to more complicated models (e.g. a power-law over a cutoff power-law), the BAT team has decided to require a chi-square improvement of more than 6 for each extra dof.
Time averaged spectrum fit using the average DRM
Power-law model
Time interval is from  -14.256 sec. to   22.752 sec.

Spectral model in power-law:
------------------------------------------------------------
Parameters  : value       lower 90%   higher 90%
Photon index: -1.32607     ( -0.0873017   0.0875823 )
Norm@50keV  : 1.94311E-02    ( -0.000939982   0.000939932 )
------------------------------------------------------------
#Fit statistic : Chi-Squared =          55.84 using 59 PHA bins.
# Reduced chi-squared =         0.9797 for     57 degrees of freedom
# Null hypothesis probability =   5.186218e-01

Photon flux (15-150 keV)    in 37.01 sec: 2.32971 ( -0.12029  0.12071 ) ph/cm2/s
Energy fluence (15-150 keV)             : 7.06317e-06 ( -3.66963e-07  3.67858e-07 ) ergs/cm2
Cutoff power-law model
Time interval is from  -14.256 sec. to   22.752 sec.
Spectral model in the cutoff power-law:
------------------------------------------------------------
Parameters  : value       lower 90%   higher 90%
Photon index: -1.23758     ( -0.0958236   0.35009 )
Epeak [keV] : 443.773      ( -622.221 -773.117 )
Norm@50keV  : 2.13419E-02    ( -0.00186135   0.00868258 )
------------------------------------------------------------
#Fit statistic : Chi-Squared =          55.90 using 59 PHA bins.
# Reduced chi-squared =         0.9983 for     56 degrees of freedom
# Null hypothesis probability =   4.784851e-01

Photon flux (15-150 keV)    in 37.01 sec: 2.32347 ( -0.12618  0.1219 ) ph/cm2/s
Energy fluence (15-150 keV)             : 7.04463e-06 ( -3.86703e-07  3.46979e-07 ) ergs/cm2
1-s peak spectrum fit
Power-law model
Time interval is from    1.684 sec. to    2.684 sec.

Spectral model in power-law:
------------------------------------------------------------
Parameters  : value       lower 90%   higher 90%
Photon index: -0.914033     ( -0.229788   0.23827 )
Norm@50keV  : 4.81874E-02    ( -0.00684933   0.00681353 )
------------------------------------------------------------
#Fit statistic : Chi-Squared =          64.67 using 59 PHA bins.
# Reduced chi-squared =          1.135 for     57 degrees of freedom
# Null hypothesis probability =   2.265948e-01

Photon flux (15-150 keV)    in 1 sec: 0.209247 0.233176 0.230057 0.227737 0.143366 3.00678E-02 (    ) ph/cm2/s
Energy fluence (15-150 keV)             : 5.37935e-07 ( -8.14148e-08  8.18628e-08 ) ergs/cm2
Cutoff power-law model
Time interval is from    1.684 sec. to    2.684 sec.
Spectral model in the cutoff power-law:
------------------------------------------------------------
Parameters  : value       lower 90%   higher 90%
Photon index: -0.322115     ( -0.700481   1.16481 )
Epeak [keV] : 162.108      ( -162.109 -162.109 )
Norm@50keV  : 8.92581E-02    ( -0.04599   0.200043 )
------------------------------------------------------------
#Fit statistic : Chi-Squared =          63.54 using 59 PHA bins.
# Reduced chi-squared =          1.135 for     56 degrees of freedom
# Null hypothesis probability =   2.279862e-01

Photon flux (15-150 keV)    in 1 sec: 5.45168 ( -0.79749  0.79841 ) ph/cm2/s
Energy fluence (15-150 keV)             : 0 ( 0  0 ) ergs/cm2
Time-resolved spectra
Distribution
T90 vs. Hardness ratio plot
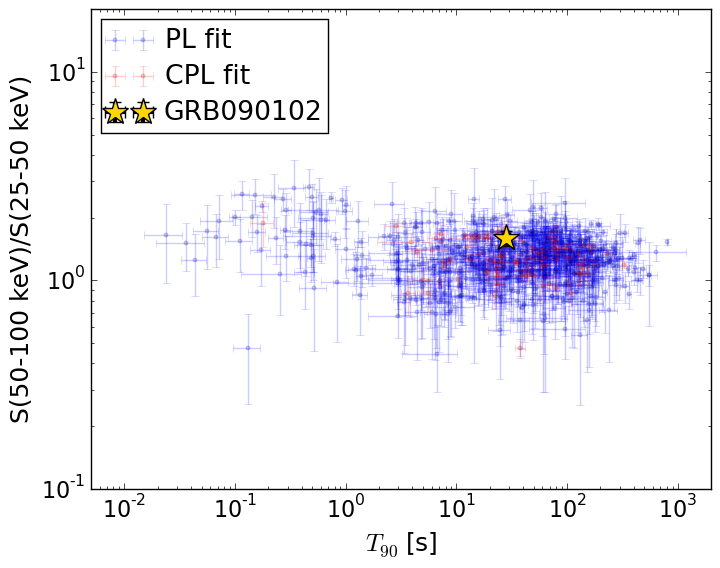
T90                                   = 28.32 sec.
Hardness ratio (energy fluence ratio) = 1.5954382716
S(15-50 keV) vs. S(50-150 keV) plot
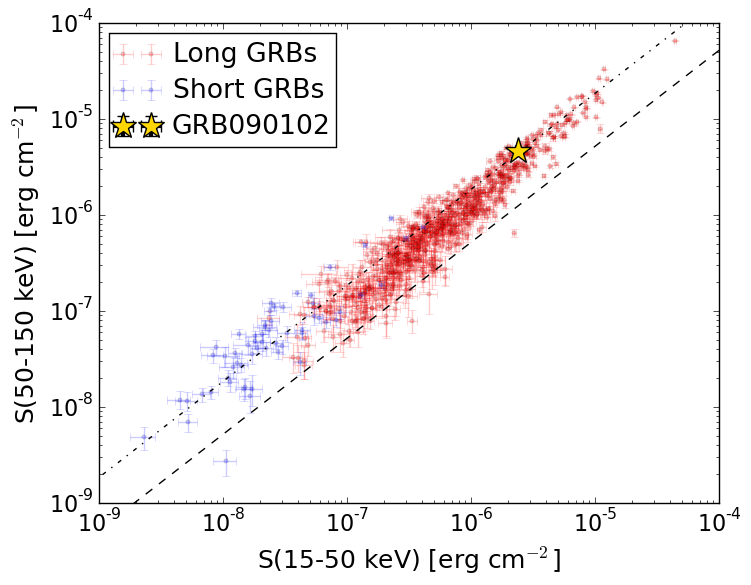
S(15-50 keV)  = 2.3754724e-06
S(50-150 keV) = 4.687687e-06
The dash-dotted line and the dashed line traces the fluences calculated from the Band function with Epeak = 15 and 150 keV, respectively. Both lines assume a canonical values of alpha = -1 and beta = -2.5.
Mask shadow pattern
IMX = 6.979517698096455E-01, IMY = -7.266237093925275E-01
Spacecraft aspect plot
Bright source in the pre-burst/pre-slew/post-slew images
Pre-burst image of 15-350 keV band
Time interval of the image:
-239.248000 -14.256000

# RAcent  DECcent POSerr Theta    Phi  PeakCts   SNR AngSep     Name
#  [deg]    [deg]    ['] [deg]  [deg]                   [']
158.1936  44.4091    4.2  46.5   10.0   0.9803   2.8 ------	UNKNOWN
 24.1922  23.8122    3.0  54.3  177.0   2.6067   3.8 ------	UNKNOWN
179.8395  49.5272    2.7  49.6  -10.6   1.5505   4.2 ------	UNKNOWN
353.1461  68.7216    2.2  28.8 -115.4   1.1970   5.3 ------	UNKNOWN
201.1524  56.8802    2.5  48.9  -29.9   1.8208   4.6 ------	UNKNOWN
Pre-slew background subtracted image of 15-350 keV band
Time interval of the image:
-14.256000 22.752000

# RAcent  DECcent POSerr Theta    Phi  PeakCts   SNR AngSep     Name
#  [deg]    [deg]    ['] [deg]  [deg]                   [']
128.2473  33.1078    0.6  45.2   46.2  10.7396  18.5 ------	UNKNOWN
163.7785  37.0060    3.5  55.0    9.9   2.0457   3.3 ------	UNKNOWN
  5.8930  35.0414    2.4  50.8 -158.8   0.7782   4.8 ------	UNKNOWN
274.8408  70.3363    2.1  41.5  -75.8   1.3632   5.5 ------	UNKNOWN
Post-slew image of 15-350 keV band
Time interval of the image:
375.352620 962.783300

# RAcent  DECcent POSerr Theta    Phi  PeakCts   SNR AngSep     Name
#  [deg]    [deg]    ['] [deg]  [deg]                   [']
 72.3160  36.8611    2.3  45.4  129.5   6.9552   5.0 ------	UNKNOWN
142.9070 -18.8049    3.1  53.7    0.9   4.4450   3.7 ------	UNKNOWN
186.2254  57.6262    2.6  45.7 -122.4   7.3549   4.5 ------	UNKNOWN