Analysis Summary
Notes:
- 1) No attempt has been made to eliminate the non-significant decimal places.
- 2) This batgrbproduct analysis is done using the HEASARC data.
- 3) This batgrbproduct analysis is using the flight position for the mask-weighting calculation.
======================================================================
BAT GRB EVENT DATA PROCESSING REPORT
Process Script Ver: batgrbproduct v2.46
Process Start Time: Sun Jan 19 19:13:41 EST 2014
Host Name: batevent1
Current Working Dir: /local/data/batevent/batevent_reproc/trigger339295
======================================================================
Trigger: 00339295 Segment: 000
BAT Trigger Time: 252996488.704 [s; MET]
Trigger Stop: 252996489.728 [s; MET]
UTC: 2009-01-07T04:48:04.308060 [includes UTCF correction]
Where From?: TDRSS position message
BAT
RA: 302.42575240314 Dec: 4.72746160298767 [deg; J2000]
Catalogged Source?: NO
Point Source?: YES
GRB Indicated?: YES [ by BAT flight software ]
Image S/N Ratio: 8.58
Image Trigger?: NO
Rate S/N Ratio: 14.5258390463339 [ if not an image trigger ]
Image S/N Ratio: 8.58
Analysis Position: [ source = BAT ]
RA: 302.42575240314 Dec: 4.72746160298767 [deg; J2000]
Refined Position: [ source = BAT pre-slew burst ]
RA: 302.408099686857 Dec: 4.74714950259026 [deg; J2000]
{ 20h 09m 37.9s , +04d 44' 49.7" }
+/- 2.39365055667552 [arcmin] (estimated 90% radius based on SNR)
+/- 1.00073482208502 [arcmin] (formal 1-sigma fit error)
SNR: 8.74184343645847
Angular difference between the analysis and refined position is 1.584166 arcmin
Partial Coding Fraction: 0.7421875 [ including projection effects ]
Duration
T90: 12.0840000212193 +/- 0.687069143455587
Measured from: 0.495999991893768
to: 12.580000013113 [s; relative to TRIGTIME]
T50: 10.472000002861 +/- 7.21137879261201
Measured from: 1.06400001049042
to: 11.5360000133514 [s; relative to TRIGTIME]
Fluence
Peak Flux (peak 1 second)
Measured from: 0.296000003814697
to: 1.2960000038147 [s; relative to TRIGTIME]
Total Fluence
Measured from: 0.303999990224838
to: 12.8959999978542 [s; relative to TRIGTIME]
Band 1 Band 2 Band 3 Band 4
15-25 25-50 50-100 100-350 keV
Total 0.121868 0.169589 0.091084 0.021532
0.021842 0.022806 0.020348 0.019389 [error]
Peak 0.035155 0.049337 0.039704 0.004337
0.006440 0.007042 0.006269 0.005548 [error]
[ fluence units of on-axis counts / fully illuminated detector ]
======================================================================
====== Table of the duration information =============================
Value tstart tstop
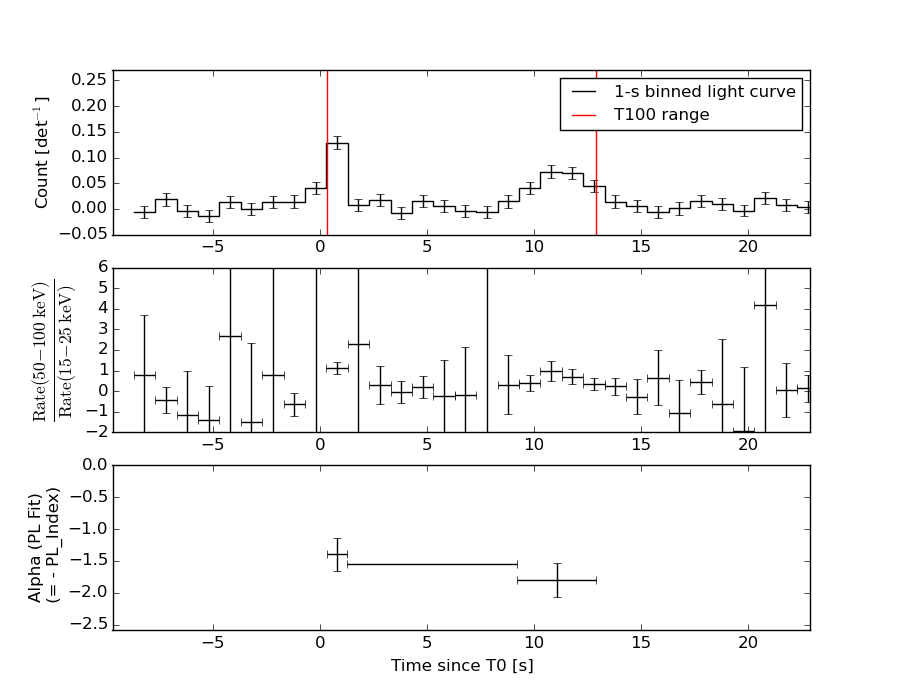
T100 12.592 0.304 12.896
T90 12.084 0.496 12.580
T50 10.472 1.064 11.536
Peak 1.000 0.296 1.296
====== Spectral Analysis Summary =====================================
Model : spectral model: simple power-law (PL) and cutoff power-law (CPL)
Ph_index : photon index: E^{Ph_index}
Ph_90err : 90% error of the photon index
Epeak : Epeak in keV
Epeak_90err: 90% error of Epeak
Norm : normalization at 50 keV in both the PL model and CPL model
Nomr_90err : 90% error of the normalization
chi2 : Chi-Squared
dof : degree of freedo
=== Time-averaged spectral analysis ===
(Best model with acceptable fit: PL)
Model Ph_index Ph_90err_low Ph_90err_hi Epeak Epeak_90err_low Epeak_90err_hi Norm Nomr_90err_low Norm_90err_hi chi2 dof
PL -1.637 -0.276 0.267 - - - 1.96e-03 -3.64e-04 3.58e-04 69.120 57
CPL 0.290 -1.430 2.467 48.770 -10.478 29.722 2.58e-02 -2.58e-02 8.41e-01 63.230 56
=== 1-s peak spectral analysis ===
(Best model with acceptable fit: PL)
Model Ph_index Ph_90err_low Ph_90err_hi Epeak Epeak_90err_low Epeak_90err_hi Norm Nomr_90err_low Norm_90err_hi chi2 dof
PL -1.406 -0.262 0.259 - - - 8.59e-03 -1.36e-03 1.35e-03 47.180 57
CPL -0.810 -0.782 1.138 98.535 -39.258 -98.535 1.74e-02 -9.78e-03 4.71e-02 45.980 56
=== Fluence/Peak Flux Summary ===
Model Band1 Band2 Band3 Band4 Band5 Total
15-25 25-50 50-100 100-350 15-150 15-350 keV
Fluence PL 3.59e-08 6.07e-08 7.81e-08 2.02e-07 2.30e-07 3.77e-07 erg/cm2
90%_error_low -8.36e-09 -1.00e-08 -1.86e-08 -8.19e-08 -4.47e-08 -1.04e-07 erg/cm2
90%_error_hi 8.70e-09 1.00e-08 1.90e-08 1.13e-07 4.61e-08 1.29e-07 erg/cm2
Peak flux PL 3.23e-01 3.44e-01 2.60e-01 3.19e-01 1.05e+00 1.25e+00 ph/cm2/s
90%_error_low -7.97e-02 -5.57e-02 -5.16e-02 -1.11e-01 -1.61e-01 -1.99e-01 ph/cm2/s
90%_error_hi 8.48e-02 5.51e-02 5.11e-02 1.44e-01 1.61e-01 2.03e-01 ph/cm2/s
Fluence CPL 3.09e-08 7.59e-08 6.89e-08 1.56e-08 1.89e-07 1.91e-07 erg/cm2
90%_error_low -9.50e-09 -1.51e-08 -3.14e-08 -1.46e-08 -4.45e-08 -4.67e-08 erg/cm2
90%_error_hi 9.74e-09 1.65e-08 2.58e-08 7.37e-08 5.20e-08 8.49e-08 erg/cm2
Peak flux CPL 2.93e-01 3.65e-01 2.72e-01 1.64e-01 1.02e+00 1.09e+00 ph/cm2/s
90%_error_low -9.30e-02 -6.50e-02 -5.67e-02 -1.64e-01 -1.65e-01 -2.04e-01 ph/cm2/s
90%_error_hi 9.65e-02 6.85e-02 5.86e-02 2.03e-01 1.65e-01 2.75e-01 ph/cm2/s
======================================================================
Image
Pre-slew 15.0-350.0 keV image (Event data)
#   RAcent    DECcent   POSerr    Theta     Phi              Peak Cts       SNR   Name
  302.4081     4.7471   0.0220    22.4968   -63.6512         0.3837651      8.742 TRIG_00339295

Foreground time interval of the image:
  0.304  12.896 (delta_t =  12.592 [sec])
Background time interval of the image:
-239.704   0.304 (delta_t = 240.008 [sec])
Light Curves
Note: The mask-weighted lightcurves have units of either count/det or counts/sec/det, where a det is 0.4 x 0.4 = 0.16 sq cm.
Full-time range; 1 s binning
Other quick-look light curves:
- 64 ms binning (zoomed)
- 16 ms binning (zoomed)
- 8 ms binning (zoomed)
- 2 ms binning (zoomed)
- SN=5 or 10 s binning (full-time range)
- Raw light curve
Spectra
- 64 ms binning (zoomed)
- 16 ms binning (zoomed)
- 8 ms binning (zoomed)
- 2 ms binning (zoomed)
- SN=5 or 10 s binning (full-time range)
- Raw light curve
Spectra
Notes:
- 1) The fitting includes the systematic errors.
- 2) When the burst includes telescope slew time periods, the fitting uses an average response file made from multiple 5-s response files through out the slew time plus single time preiod for the non-slew times, and weighted by the total counts in the corresponding time period using addrmf. An average response file is needed becuase a spectral fit using the pre-slew DRM will introduce some errors in both a spectral shape and a normalization if the PHA file contains a lot of the slew/post-slew time interval.
- 3) For fits to more complicated models (e.g. a power-law over a cutoff power-law), the BAT team has decided to require a chi-square improvement of more than 6 for each extra dof.
Time averaged spectrum fit using the average DRM
Power-law model
Time interval is from    0.304 sec. to   12.896 sec.

Spectral model in power-law:
------------------------------------------------------------
Parameters  : value       lower 90%   higher 90%
Photon index: -1.63677     ( -0.27627   0.266597 )
Norm@50keV  : 1.96367E-03    ( -0.000363724   0.00035791 )
------------------------------------------------------------
#Fit statistic : Chi-Squared =          69.12 using 59 PHA bins.
# Reduced chi-squared =          1.213 for     57 degrees of freedom
# Null hypothesis probability =   1.302737e-01

Photon flux (15-150 keV)    in 12.59 sec: 0.255308 ( -0.042191  0.042199 ) ph/cm2/s
Energy fluence (15-150 keV)             : 2.3029e-07 ( -4.47379e-08  4.61022e-08 ) ergs/cm2
Cutoff power-law model
Time interval is from    0.304 sec. to   12.896 sec.
Spectral model in the cutoff power-law:
------------------------------------------------------------
Parameters  : value       lower 90%   higher 90%
Photon index: 0.289647     ( -1.44305   2.45427 )
Epeak [keV] : 48.7701      ( -10.3306 29.8696 )
Norm@50keV  : 2.58351E-02    ( -0.0266397   0.840602 )
------------------------------------------------------------
#Fit statistic : Chi-Squared =          63.23 using 59 PHA bins.
# Reduced chi-squared =          1.129 for     56 degrees of freedom
# Null hypothesis probability =   2.362983e-01

Photon flux (15-150 keV)    in 12.59 sec: 0.240567 ( -0.042597  0.043058 ) ph/cm2/s
Energy fluence (15-150 keV)             : 1.89084e-07 ( -4.45083e-08  5.20317e-08 ) ergs/cm2
1-s peak spectrum fit
Power-law model
Time interval is from    0.296 sec. to    1.296 sec.

Spectral model in power-law:
------------------------------------------------------------
Parameters  : value       lower 90%   higher 90%
Photon index: -1.40571     ( -0.26206   0.258618 )
Norm@50keV  : 8.59270E-03    ( -0.00136388   0.00135129 )
------------------------------------------------------------
#Fit statistic : Chi-Squared =          47.18 using 59 PHA bins.
# Reduced chi-squared =         0.8277 for     57 degrees of freedom
# Null hypothesis probability =   8.199289e-01

Photon flux (15-150 keV)    in 1 sec: 1.04781 ( -0.160601  0.16071 ) ph/cm2/s
Energy fluence (15-150 keV)             : 8.2943e-08 ( -1.46573e-08  1.49361e-08 ) ergs/cm2
Cutoff power-law model
Time interval is from    0.296 sec. to    1.296 sec.
Spectral model in the cutoff power-law:
------------------------------------------------------------
Parameters  : value       lower 90%   higher 90%
Photon index: -0.80992     ( -0.781798   1.13823 )
Epeak [keV] : 98.5355      ( -39.2468 -98.524 )
Norm@50keV  : 1.73830E-02    ( -0.0097869   0.0470747 )
------------------------------------------------------------
#Fit statistic : Chi-Squared =          45.98 using 59 PHA bins.
# Reduced chi-squared =         0.8211 for     56 degrees of freedom
# Null hypothesis probability =   8.278934e-01

Photon flux (15-150 keV)    in 1 sec: 1.02494 ( -0.164519  0.16452 ) ph/cm2/s
Energy fluence (15-150 keV)             : 7.91444e-08 ( -1.5718e-08  1.60453e-08 ) ergs/cm2
Time-resolved spectra
Distribution
T90 vs. Hardness ratio plot
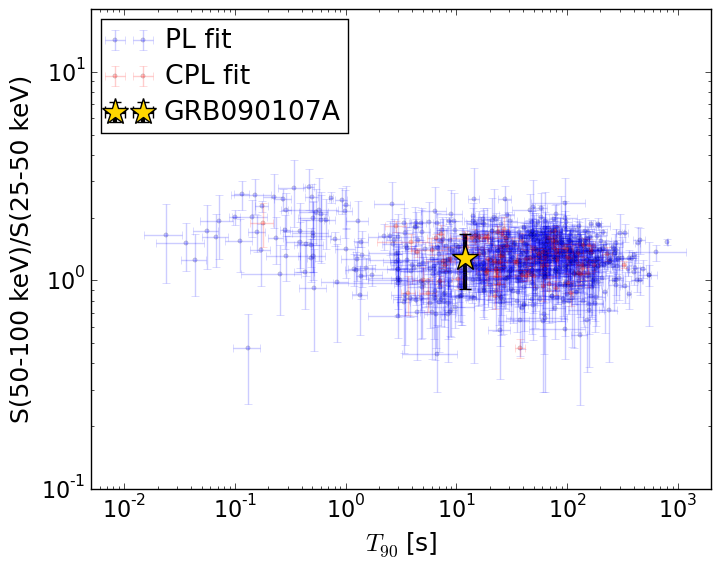
T90                                   = 12.084 sec.
Hardness ratio (energy fluence ratio) = 1.28650072956
S(15-50 keV) vs. S(50-150 keV) plot
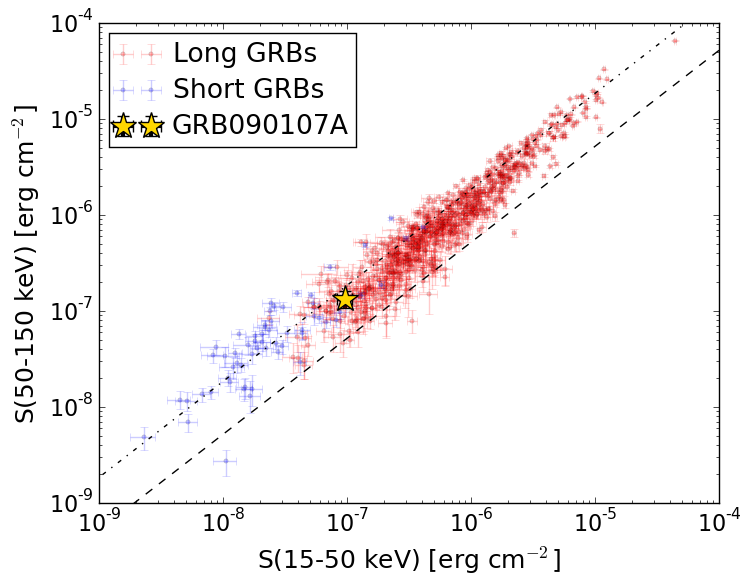
S(15-50 keV)  = 9.657269e-08
S(50-150 keV) = 1.3372136e-07
The dash-dotted line and the dashed line traces the fluences calculated from the Band function with Epeak = 15 and 150 keV, respectively. Both lines assume a canonical values of alpha = -1 and beta = -2.5.
Mask shadow pattern

IMX = 1.838131844421850E-01, IMY = 3.711207899623837E-01
Spacecraft aspect plot
Bright source in the pre-burst/pre-slew/post-slew images
Pre-burst image of 15-350 keV band
Time interval of the image:
-239.704000 0.304000

# RAcent  DECcent POSerr Theta    Phi  PeakCts   SNR AngSep     Name
#  [deg]    [deg]    ['] [deg]  [deg]                   [']
288.7764  10.9486    1.2  31.4  -36.8   2.3661   9.2    1.3	GRS 1915+105
299.5834  35.2056    0.4  24.4   19.3   6.7163  30.8    0.4	Cyg X-1
308.0854  40.9848    1.5  24.3   40.9   1.7815   7.8    2.2	Cyg X-3
326.2165  38.2234    5.9  19.9   77.6   0.4670   1.9    6.3	Cyg X-2
291.1140  57.4075    2.9  44.0   41.4   2.4341   4.0 ------	UNKNOWN
 13.4975   3.5339    2.9  54.3  163.3   4.5756   4.0 ------	UNKNOWN
269.2900  29.6840    2.8  47.2   -3.2   1.6774   4.1 ------	UNKNOWN
273.3747  -1.7047    3.0  50.5  -45.4   4.5677   3.9 ------	UNKNOWN
303.9722 -18.5668    3.7  40.9  -92.5   3.4882   3.2 ------	UNKNOWN
Pre-slew background subtracted image of 15-350 keV band
Time interval of the image:
0.304000 12.896000

# RAcent  DECcent POSerr Theta    Phi  PeakCts   SNR AngSep     Name
#  [deg]    [deg]    ['] [deg]  [deg]                   [']
288.7902  10.9942   14.4  31.3  -36.7  -0.0372  -0.8    3.0	GRS 1915+105
299.5548  35.1749    6.3  24.4   19.2   0.0771   1.8    2.4	Cyg X-1
308.1380  40.8330   10.8  24.1   40.8   0.0504   1.1    7.3	Cyg X-3
326.1090  38.5187    0.0  20.1   77.1  -0.1023  -2.1   12.2	Cyg X-2
359.1220  42.7505    2.5  40.4  109.0   0.7263   4.7 ------	UNKNOWN
277.6106  16.2390    2.5  40.6  -23.5   0.2495   4.6 ------	UNKNOWN
302.4081   4.7472    1.3  22.5  -63.7   0.3837   8.7 ------	UNKNOWN
Post-slew image of 15-350 keV band
Time interval of the image:
368.396600 962.416000

# RAcent  DECcent POSerr Theta    Phi  PeakCts   SNR AngSep     Name
#  [deg]    [deg]    ['] [deg]  [deg]                   [']
 83.6355  22.0080    0.2  24.3  122.7  26.1086  48.9    0.4	Crab
122.1008  28.7485    2.5  40.2   59.7   6.3705   4.7 ------	UNKNOWN
 52.1811   2.7798    2.7  47.1  174.1   3.8073   4.2 ------	UNKNOWN
107.0907  56.2953    2.8  22.6   11.3   1.7051   4.0 ------	UNKNOWN
178.7683  64.5774    3.3  55.1   -7.6   5.6271   3.5 ------	UNKNOWN
 32.7373  -0.0620    2.8  58.8 -166.0  12.1613   4.1 ------	UNKNOWN
234.8645  83.2232    4.3  51.1  -35.1   4.4877   2.7 ------	UNKNOWN
 11.5817  53.2742    3.8  40.9  -93.2   7.8230   3.1 ------	UNKNOWN