Analysis Summary
Notes:
- 1) No attempt has been made to eliminate the non-significant decimal places.
- 2) This batgrbproduct analysis is done using the HEASARC data.
- 3) This batgrbproduct analysis is using the flight position for the mask-weighting calculation.
==========================================================================
BAT GROUND-DETECTED GRB DATA PROCESSING REPORT
(This burst occurred during telescope slew)
Process Script Ver: batgrbproduct v2.46
Process Start Time: Tue Nov 11 09:31:06 EST 2014
Host Name: bat1
Current Working Dir: /local/data/bat1/alien/Swift_3rdBATcatalog/event/batevent_reproc/GRB090118
======================================================================
Trigger: 00031292 Segment: 054
BAT Trigger Time: 253979710.024
UTC: 2009-01-18T13:55:05.598 [includes UTCF correction]
Where From?: Ground analysis (best_duration.txt)
NOTE: BAT trigger time for ground-detected burst during slew is the T100 start time.
Refined Position: [ source = BAT mosaic image ]
RA: 49.8046534226055 Dec: 18.4471554872135 [deg; J2000]
{ 03h 19m 13.1s , +18d 26' 49.8" }
+/- 1.53851109659 [arcmin] (estimated 90% radius based on SNR)
SNR: 16.439499039
Angular difference between the analysis and refined position is Usage: arcmin
Partial Coding Fraction: Unavailable because the burst occurred during slew.
Duration
T90: 13.5239999890327 +/- 1.88347870037055
Measured from: 0.82
to: 14.344 [s; relative to TRIGTIME]
T50: 6.85600000619888 +/- 1.77082128086336
Measured from: 3.128
to: 9.984 [s; relative to TRIGTIME]
====== Table of the duration information =============================
Value tstart tstop
T100 15.240 0.000 15.240
T90 13.524 0.820 14.344
T50 6.856 3.128 9.984
Peak 1.000 2.976 3.976
====== Spectral Analysis Summary =====================================
Model : spectral model: simple power-law (PL) and cutoff power-law (CPL)
Ph_index : photon index: E^{Ph_index}
Ph_90err : 90% error of the photon index
Epeak : Epeak in keV
Epeak_90err: 90% error of Epeak
Norm : normalization at 50 keV in both the PL model and CPL model
Nomr_90err : 90% error of the normalization
chi2 : Chi-Squared
dof : degree of freedo
=== Time-averaged spectral analysis ===
(Best model with acceptable fit: PL)
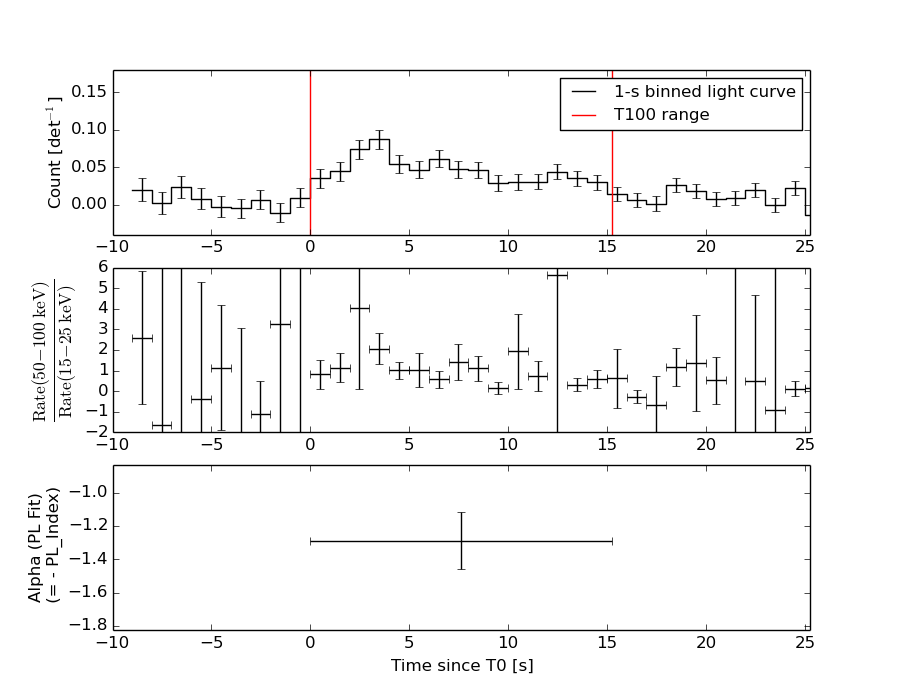
Model Ph_index Ph_90err_low Ph_90err_hi Epeak Epeak_90err_low Epeak_90err_hi Norm Nomr_90err_low Norm_90err_hi chi2 dof
PL -1.277 -0.180 0.181 - - - 3.14e-03 -3.08e-04 3.08e-04 45.480 57
CPL -1.231 -0.227 0.470 910.862 -910.862 -910.862 3.31e-03 -4.60e-04 1.57e-04 45.610 56
=== 1-s peak spectral analysis ===
(Best model with acceptable fit: PL)
Model Ph_index Ph_90err_low Ph_90err_hi Epeak Epeak_90err_low Epeak_90err_hi Norm Nomr_90err_low Norm_90err_hi chi2 dof
PL -0.790 -0.386 0.434 - - - 6.01e-03 -1.44e-03 1.36e-03 62.750 57
CPL -0.794 -0.378 0.597 9999.360 -9999.360 -9999.360 6.07e-03 -1.33e-03 1.73e-02 62.760 56
=== Fluence/Peak Flux Summary ===
Model Band1 Band2 Band3 Band4 Band5 Total
15-25 25-50 50-100 100-350 15-150 15-350 keV
Fluence PL 4.97e-08 1.05e-07 1.73e-07 6.46e-07 4.76e-07 9.73e-07 erg/cm2
90%_error_low -8.99e-09 -1.15e-08 -2.15e-08 -1.64e-07 -5.29e-08 -1.80e-07 erg/cm2
90%_error_hi 9.47e-09 1.13e-08 2.12e-08 2.00e-07 5.34e-08 2.11e-07 erg/cm2
Peak flux PL 1.26e-01 1.94e-01 2.24e-01 4.98e-01 6.91e-01 1.04e+00 ph/cm2/s
90%_error_low -5.85e-02 -6.17e-02 -4.77e-02 -2.04e-01 -1.54e-01 -2.37e-01 ph/cm2/s
90%_error_hi 7.16e-02 5.98e-02 4.73e-02 2.91e-01 1.56e-01 2.64e-01 ph/cm2/s
Fluence CPL 4.96e-08 1.04e-07 1.73e-07 6.77e-07 4.78e-07 9.78e-07 erg/cm2
90%_error_low N/A N/A N/A -3.60e-07 -6.03e-08 -3.43e-07 erg/cm2
90%_error_hi N/A N/A N/A 6.68e-08 5.72e-08 9.05e-08 erg/cm2
Peak flux CPL 1.26e-01 1.94e-01 2.24e-01 4.95e-01 6.91e-01 1.06e+00 ph/cm2/s
90%_error_low N/A N/A N/A N/A N/A -4.17e-01 ph/cm2/s
90%_error_hi N/A N/A N/A N/A N/A 2.47e-01 ph/cm2/s
======================================================================
Image
Note1: The mosaic image is made with timebin = 0.10 s; energybin = 15-350 keV
Note2: The mosaic image uses Galactic coordinate.
#RAcent DECcent POSerr Theta  Phi  Peak_Cts  SNR Name
49.805 18.447 0.004 30.993 112.207 0.044 16.439 UNKNOWN

Image time interval: 0.000 to 15.240 [sec]
Light Curves
Note: The mask-weighted lightcurves have units of either count/det or counts/sec/det, where a det is 0.4 x 0.4 = 0.16 sq cm.
Best duration plot
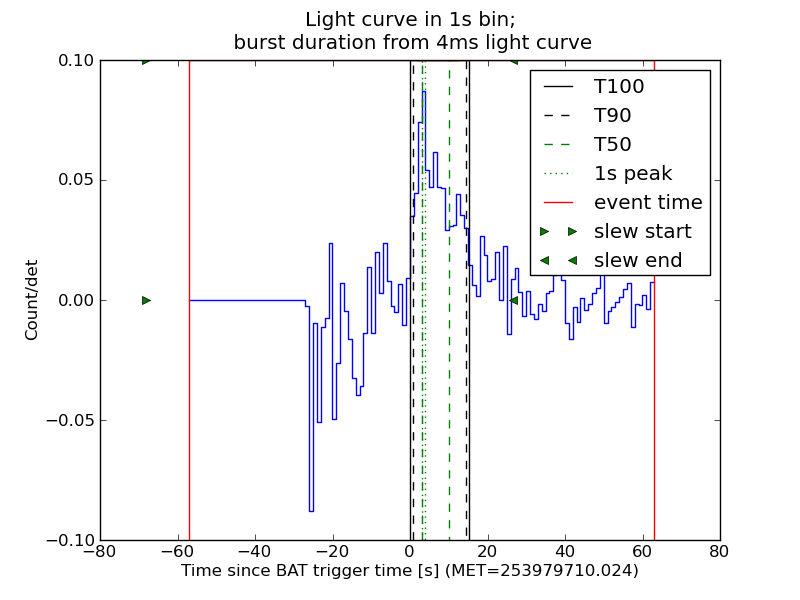
Full-time range; 1 s binning
Other quick-look light curves:
- 64 ms binning (zoomed)
- 16 ms binning (zoomed)
- 8 ms binning (zoomed)
- 2 ms binning (zoomed)
- SN=5 or 10 s binning (full-time range)
- Raw light curve
Spectra
- 64 ms binning (zoomed)
- 16 ms binning (zoomed)
- 8 ms binning (zoomed)
- 2 ms binning (zoomed)
- SN=5 or 10 s binning (full-time range)
- Raw light curve
Spectra
Notes:
- 1) The fitting includes the systematic errors.
- 2) When the burst includes telescope slew time periods, the fitting uses an average response file made from multiple 5-s response files through out the slew time plus single time preiod for the non-slew times, and weighted by the total counts in the corresponding time period using addrmf. An average response file is needed becuase a spectral fit using the pre-slew DRM will introduce some errors in both a spectral shape and a normalization if the PHA file contains a lot of the slew/post-slew time interval.
- 3) For fits to more complicated models (e.g. a power-law over a cutoff power-law), the BAT team has decided to require a chi-square improvement of more than 6 for each extra dof.
Time averaged spectrum fit using the average DRM
Power-law model
Time interval is from    0.000 sec. to   15.240 sec.

Spectral model in power-law:
------------------------------------------------------------
Parameters  : value       lower 90%   higher 90%
Photon index: -1.27706     ( -0.17998   0.181033 )
Norm@50keV  : 3.14450E-03    ( -0.000308222   0.000307586 )
------------------------------------------------------------
#Fit statistic : Chi-Squared =          45.48 using 59 PHA bins.
# Reduced chi-squared =         0.7980 for     57 degrees of freedom
# Null hypothesis probability =   8.638064e-01

Photon flux (15-150 keV)    in 15.24 sec: 0.373612 ( -0.037297  0.037401 ) ph/cm2/s
Energy fluence (15-150 keV)             : 4.76316e-07 ( -5.28823e-08  5.33662e-08 ) ergs/cm2
Cutoff power-law model

Time interval is from    0.000 sec. to   15.240 sec.
Spectral model in the cutoff power-law:
------------------------------------------------------------
Parameters  : value       lower 90%   higher 90%
Photon index: -1.27321     ( -0.224647   0.471801 )
Epeak [keV] : 1.00000E+04      ( -10000 -10000 )
Norm@50keV  : 3.15803E-03    ( -0.000309612   0.000307438 )
------------------------------------------------------------
#Fit statistic : Chi-Squared =          45.49 using 59 PHA bins.
# Reduced chi-squared =         0.8124 for     56 degrees of freedom
# Null hypothesis probability =   8.410031e-01

Photon flux (15-150 keV)    in 15.24 sec: 0.375057 (    ) ph/cm2/s
Energy fluence (15-150 keV)             : 4.78051e-07 ( -6.03125e-08  5.71841e-08 ) ergs/cm2
1-s peak spectrum fit
Power-law model
Time interval is from    2.976 sec. to    3.976 sec.

Spectral model in power-law:
------------------------------------------------------------
Parameters  : value       lower 90%   higher 90%
Photon index: -0.790134     ( -0.386445   0.433769 )
Norm@50keV  : 6.01303E-03    ( -0.00143684   0.00136464 )
------------------------------------------------------------
#Fit statistic : Chi-Squared =          62.75 using 59 PHA bins.
# Reduced chi-squared =          1.101 for     57 degrees of freedom
# Null hypothesis probability =   2.798247e-01

Photon flux (15-150 keV)    in 1 sec: 0.691338 ( -0.154359  0.155612 ) ph/cm2/s
Energy fluence (15-150 keV)             : 7.05684e-08 ( -1.53823e-08  1.54121e-08 ) ergs/cm2
Cutoff power-law model

Time interval is from    2.976 sec. to    3.976 sec.
Spectral model in the cutoff power-law:
------------------------------------------------------------
Parameters  : value       lower 90%   higher 90%
Photon index: -0.79365     ( -0.381536   0.593663 )
Epeak [keV] : 9999.36      ( -9999.36 -9999.36 )
Norm@50keV  : 6.06691E-03    ( -0.00132484   0.0173236 )
------------------------------------------------------------
#Fit statistic : Chi-Squared =          62.76 using 59 PHA bins.
# Reduced chi-squared =          1.121 for     56 degrees of freedom
# Null hypothesis probability =   2.492625e-01

Photon flux (15-150 keV)    in 1 sec: 0.691170 (    ) ph/cm2/s
Energy fluence (15-150 keV)             : 7.06529e-08 ( -1.61048e-08  1.59595e-08 ) ergs/cm2
Time-resolved spectra
Distribution
T90 vs. Hardness ratio plot
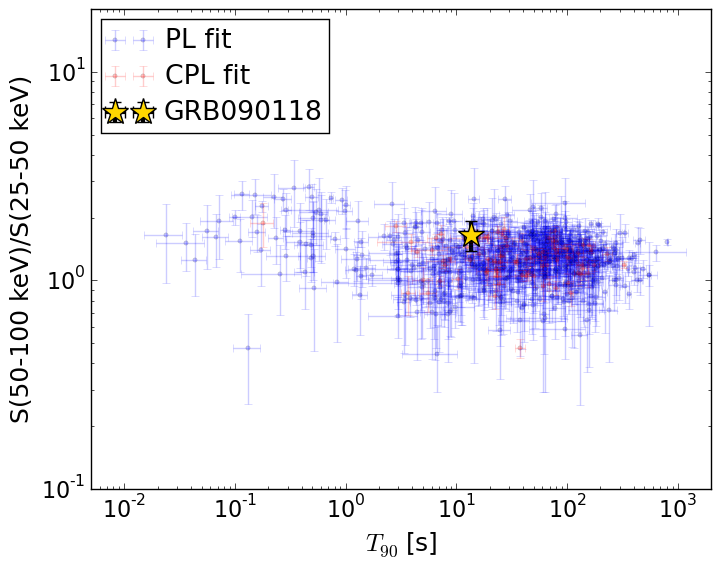
T90                                   = 13.524 sec.
Hardness ratio (energy fluence ratio) = 1.65059293448
S(15-50 keV) vs. S(50-150 keV) plot
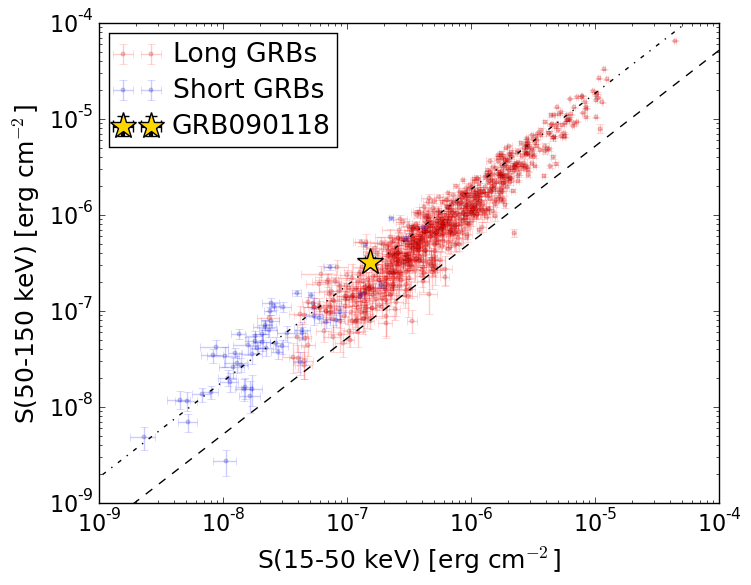
S(15-50 keV)  = 1.5432253e-07
S(50-150 keV) = 3.220003e-07
The dash-dotted line and the dashed line traces the fluences calculated from the Band function with Epeak = 15 and 150 keV, respectively. Both lines assume a canonical values of alpha = -1 and beta = -2.5.
Mask shadow pattern
Mask shadow pattern unavailable because this burst occurs during telescope slews.Spacecraft aspect plot