Analysis Summary
Notes:
- 1) No attempt has been made to eliminate the non-significant decimal places.
- 2) This batgrbproduct analysis is done using the HEASARC data.
- 3) This batgrbproduct analysis is using the flight position for the mask-weighting calculation.
======================================================================
                  BAT GRB EVENT DATA PROCESSING REPORT
    Process Script Ver: batgrbproduct v2.46
    Process Start Time: Sun Jan 19 18:59:30 EST 2014
             Host Name: batevent1
   Current Working Dir: /local/data/batevent/batevent_reproc/trigger340895
======================================================================

  Trigger: 00340895      Segment: 000

  BAT Trigger Time: 254389920.768   [s; MET]
      Trigger Stop: 254389921.792   [s; MET]
               UTC: 2009-01-23T07:51:56.329040    [includes UTCF correction]
       Where From?: TDRSS position message

  BAT
    RA: 6.77522560443211   Dec: -23.5140158661529  [deg; J2000]

     Catalogged Source?: NO
     Point Source?:      YES
     GRB Indicated?:     YES    [ by BAT flight software ]
     Image S/N Ratio:    7.15
     Image Trigger?:     NO
     Rate S/N Ratio:     7.93725393319377  [ if not an image trigger ]
     Image S/N Ratio:    7.15

  Analysis Position:   [ source = BAT ]
    RA: 6.77522560443211   Dec: -23.5140158661529  [deg; J2000]

  Refined Position:   [ source = BAT pre-slew burst ]
    RA: 6.79375297916738   Dec: -23.5094268234327  [deg; J2000]
        { 00h 27m 10.5s , -23d 30' 33.9" }
         +/- 1.58575250684554 [arcmin] (estimated 90% radius based on SNR)
         +/- 0.666184719688261 [arcmin] (formal 1-sigma fit error)
    SNR: 15.7422860311212

  Angular difference between the analysis and refined position is 1.055885 arcmin

  Partial Coding Fraction: 0.3632812    [ including projection effects ]

  Duration
     T90: 137.344000011683 +/- 22.9818726839213
        Measured from: -44.2960000038147
                   to: 93.0480000078678     [s; relative to TRIGTIME]
     T50: 38.2360000014305 +/- 13.4404339138368
        Measured from: -15.7840000092983
                   to: 22.4519999921322     [s; relative to TRIGTIME]


  Fluence
     Peak Flux  (peak 1 second)
        Measured from: 0.0839999914169312
                   to: 1.08399999141693     [s; relative to TRIGTIME]
     Total Fluence
        Measured from: -54.7360000014305
                   to: 117.928000003099     [s; relative to TRIGTIME]

             Band 1     Band 2     Band 3     Band 4
              15-25      25-50     50-100    100-350     keV
 Total     1.299818   1.657996   1.146163   0.294130
           0.096491   0.100839   0.089028   0.077714 [error]
 Peak      0.049577   0.074894   0.049429   0.009835
           0.009937   0.010739   0.009648   0.007858 [error]

     [ fluence units of on-axis counts / fully illuminated detector ]

======================================================================


====== Table of the duration information =============================

        Value   tstart    tstop
T100  172.664  -54.736  117.928
T90   137.344  -44.296   93.048
T50    38.236  -15.784   22.452
Peak    1.000    0.084    1.084


====== Spectral Analysis Summary =====================================

Model      : spectral model: simple power-law (PL) and cutoff power-law (CPL)
Ph_index   : photon index: E^{Ph_index}
Ph_90err   : 90% error of the photon index
Epeak      : Epeak in keV
Epeak_90err: 90% error of Epeak
Norm       : normalization at 50 keV in both the PL model and CPL model
Nomr_90err : 90% error of the normalization
chi2       : Chi-Squared
dof        : degree of freedo

=== Time-averaged spectral analysis ===
(Best model with acceptable fit: PL)

Model Ph_index Ph_90err_low Ph_90err_hi  Epeak  Epeak_90err_low  Epeak_90err_hi  Norm       Nomr_90err_low    Norm_90err_hi    chi2    dof
PL      -1.591    -0.124      0.123       -           -               -         1.80e-03     -1.24e-04          1.23e-04      52.370   57
CPL     -1.566     1.566      0.344      909.402      N/A           N/A         1.85e-03        N/A               N/A         52.470   56


=== 1-s peak spectral analysis ===
(Best model with acceptable fit: PL)

Model Ph_index Ph_90err_low Ph_90err_hi  Epeak  Epeak_90err_low  Epeak_90err_hi  Norm       Nomr_90err_low    Norm_90err_hi    chi2    dof
PL      -1.701     -0.286     0.272       -           -               -         1.30e-02     -2.31e-03          2.27e-03      54.880   57
CPL     -0.954     -0.615     1.419       67.633     -40.611       -67.633      3.20e-02     -3.20e-02          1.42e-01      53.570   56


=== Fluence/Peak Flux Summary ===

              Model    Band1     Band2     Band3     Band4     Band5     Total
                       15-25     25-50    50-100    100-350    15-150    15-350    keV
Fluence         PL   4.31e-07  7.50e-07  9.96e-07  2.70e-06  2.91e-06  4.88e-06   erg/cm2
      90%_error_low -5.10e-08 -5.38e-08 -8.95e-08 -4.94e-07 -2.13e-07 -5.66e-07   erg/cm2
      90%_error_hi   5.29e-08  5.35e-08  8.91e-08  5.65e-07  2.14e-07  6.20e-07   erg/cm2
Peak flux       PL   6.51e-01  5.81e-01  3.57e-01  3.34e-01  1.73e+00  1.92e+00   ph/cm2/s
      90%_error_low -1.63e-01 -9.81e-02 -8.00e-02 -1.27e-01 -2.88e-01 -3.16e-01   ph/cm2/s
      90%_error_hi   1.74e-01  9.75e-02  7.91e-02  1.64e-01  2.89e-01  3.17e-01   ph/cm2/s

Fluence        CPL   4.31e-07  7.43e-07  9.90e-07  2.99e-06  2.93e-06  4.91e-06   erg/cm2
      90%_error_low    N/A    -6.51e-08    N/A    -1.42e-06 -2.50e-07 -1.20e-06   erg/cm2
      90%_error_hi     N/A     8.40e-08    N/A     5.09e-09  2.08e-07  2.69e-07   erg/cm2
Peak flux      CPL   5.79e-01  6.28e-01  3.78e-01  1.55e-01  1.69e+00  1.74e+00   ph/cm2/s
      90%_error_low -1.93e-01 -1.20e-01 -9.05e-02 -1.55e-01 -2.96e-01 -3.28e-01   ph/cm2/s
      90%_error_hi   2.02e-01  1.27e-01  9.33e-02  2.36e-01  2.96e-01  4.03e-01   ph/cm2/s

======================================================================
Image
Pre-slew 15.0-350.0 keV image (Event data)
#   RAcent    DECcent   POSerr    Theta     Phi              Peak Cts       SNR   Name
    6.7938   -23.5094   0.0122    45.7815  -158.2147         3.2905073     15.742 TRIG_00340895

Foreground time interval of the image:
-54.736  12.333 (delta_t =  67.069 [sec])
Background time interval of the image:
-115.867 -54.736 (delta_t =  61.131 [sec])
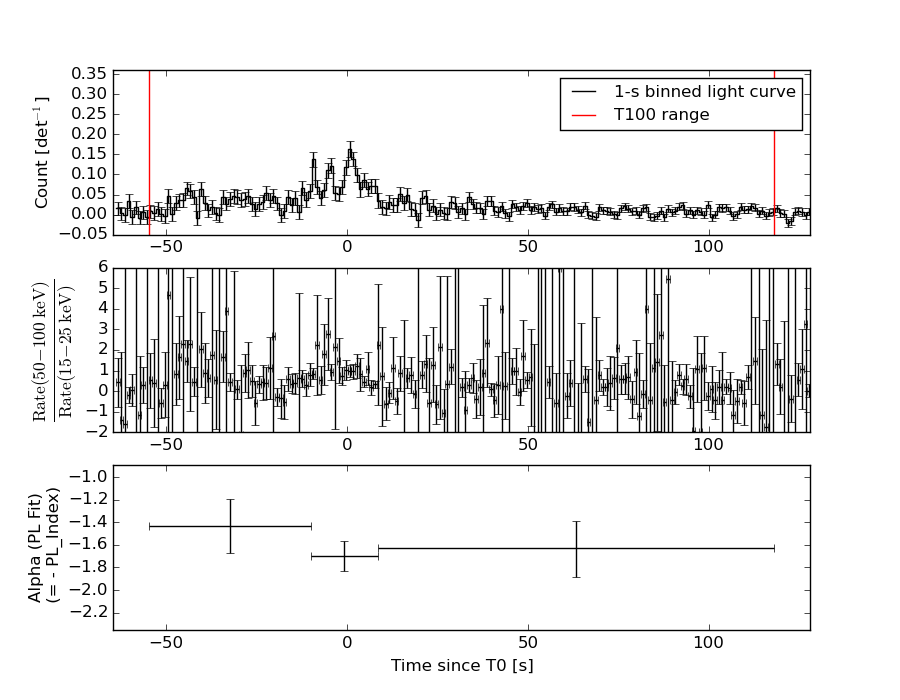
Light Curves
Note: The mask-weighted lightcurves have units of either count/det or counts/sec/det, where a det is 0.4 x 0.4 = 0.16 sq cm.
Full-time range; 1 s binning
Other quick-look light curves:
- 64 ms binning (zoomed)
- 16 ms binning (zoomed)
- 8 ms binning (zoomed)
- 2 ms binning (zoomed)
- SN=5 or 10 s binning (full-time range)
- Raw light curve
Spectra
- 64 ms binning (zoomed)
- 16 ms binning (zoomed)
- 8 ms binning (zoomed)
- 2 ms binning (zoomed)
- SN=5 or 10 s binning (full-time range)
- Raw light curve
Spectra
Notes:
- 1) The fitting includes the systematic errors.
- 2) When the burst includes telescope slew time periods, the fitting uses an average response file made from multiple 5-s response files through out the slew time plus single time preiod for the non-slew times, and weighted by the total counts in the corresponding time period using addrmf. An average response file is needed becuase a spectral fit using the pre-slew DRM will introduce some errors in both a spectral shape and a normalization if the PHA file contains a lot of the slew/post-slew time interval.
- 3) For fits to more complicated models (e.g. a power-law over a cutoff power-law), the BAT team has decided to require a chi-square improvement of more than 6 for each extra dof.
Time averaged spectrum fit using the average DRM
Power-law model
Time interval is from  -54.736 sec. to  117.928 sec.

Spectral model in power-law:
------------------------------------------------------------
Parameters  : value       lower 90%   higher 90%
Photon index: -1.59054     ( -0.12352   0.122656 )
Norm@50keV  : 1.79701E-03    ( -0.000123608   0.000123158 )
------------------------------------------------------------
#Fit statistic : Chi-Squared =          52.37 using 59 PHA bins.
# Reduced chi-squared =         0.9188 for     57 degrees of freedom
# Null hypothesis probability =   6.491192e-01

Photon flux (15-150 keV)    in 172.7 sec: 0.230261 ( -0.016235  0.016289 ) ph/cm2/s
Energy fluence (15-150 keV)             : 2.90618e-06 ( -2.13203e-07  2.14379e-07 ) ergs/cm2
Cutoff power-law model
Time interval is from  -54.736 sec. to  117.928 sec.
Spectral model in the cutoff power-law:
------------------------------------------------------------
Parameters  : value       lower 90%   higher 90%
Photon index: -2.01211     ( 2.01211   0.790109 )
Epeak [keV] : 5.01721      (   )
Norm@50keV  : 1.03564E-03    (     )
------------------------------------------------------------
#Fit statistic : Chi-Squared =          51.76 using 59 PHA bins.
# Reduced chi-squared =         0.9242 for     56 degrees of freedom
# Null hypothesis probability =   6.360897e-01

Photon flux (15-150 keV)    in 172.7 sec: 0.231442 ( -0.023481  0.020836 ) ph/cm2/s
Energy fluence (15-150 keV)             : 2.92592e-06 ( -2.49942e-07  2.07817e-07 ) ergs/cm2
1-s peak spectrum fit
Power-law model
Time interval is from    0.084 sec. to    1.084 sec.

Spectral model in power-law:
------------------------------------------------------------
Parameters  : value       lower 90%   higher 90%
Photon index: -1.70148     ( -0.285864   0.271758 )
Norm@50keV  : 1.30217E-02    ( -0.0023121   0.00227119 )
------------------------------------------------------------
#Fit statistic : Chi-Squared =          54.88 using 59 PHA bins.
# Reduced chi-squared =         0.9629 for     57 degrees of freedom
# Null hypothesis probability =   5.549331e-01

Photon flux (15-150 keV)    in 1 sec: 1.73039 ( -0.28827  0.28882 ) ph/cm2/s
Energy fluence (15-150 keV)             : 1.2057e-07 ( -2.20759e-08  2.23655e-08 ) ergs/cm2
Cutoff power-law model
Time interval is from    0.084 sec. to    1.084 sec.
Spectral model in the cutoff power-law:
------------------------------------------------------------
Parameters  : value       lower 90%   higher 90%
Photon index: -0.954246     ( -0.614946   1.41944 )
Epeak [keV] : 67.6326      ( -40.6111 -67.6326 )
Norm@50keV  : 3.20044E-02    ( -0.0320043   0.142352 )
------------------------------------------------------------
#Fit statistic : Chi-Squared =          53.57 using 59 PHA bins.
# Reduced chi-squared =         0.9567 for     56 degrees of freedom
# Null hypothesis probability =   5.672393e-01

Photon flux (15-150 keV)    in 1 sec: 1.68741 ( -0.29616  0.29609 ) ph/cm2/s
Energy fluence (15-150 keV)             : 1.1529e-07 ( -2.35265e-08  2.38301e-08 ) ergs/cm2
Time-resolved spectra
Distribution
T90 vs. Hardness ratio plot
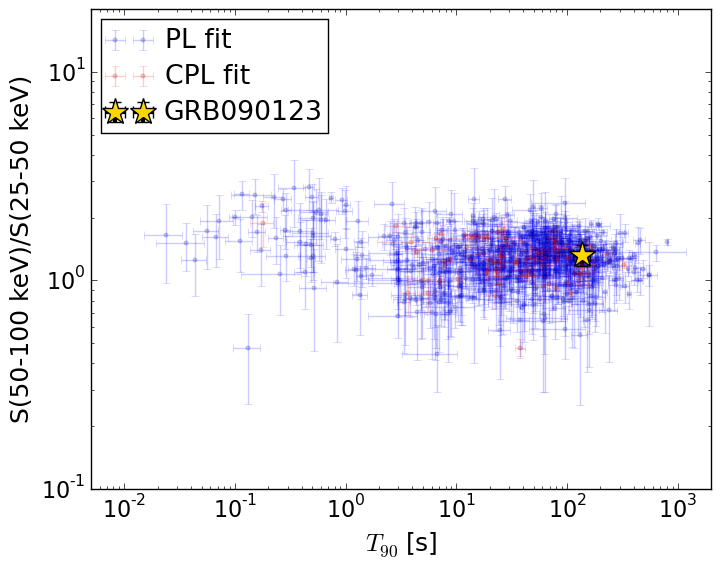
T90                                   = 137.344 sec.
Hardness ratio (energy fluence ratio) = 1.32821982803
S(15-50 keV) vs. S(50-150 keV) plot
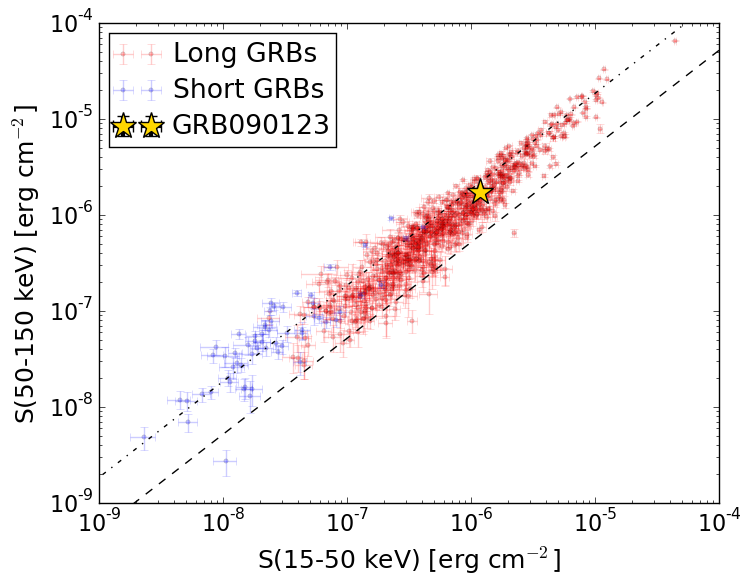
S(15-50 keV)  = 1.1815894e-06
S(50-150 keV) = 1.7245766e-06
The dash-dotted line and the dashed line traces the fluences calculated from the Band function with Epeak = 15 and 150 keV, respectively. Both lines assume a canonical values of alpha = -1 and beta = -2.5.
Mask shadow pattern
IMX = -9.542634991640637E-01, IMY = 3.813943852629045E-01
Spacecraft aspect plot
Bright source in the pre-burst/pre-slew/post-slew images
Pre-burst image of 15-350 keV band
Time interval of the image:
-115.867400 -54.736000

# RAcent  DECcent POSerr Theta    Phi  PeakCts   SNR AngSep     Name
#  [deg]    [deg]    ['] [deg]  [deg]                   [']
288.8884  10.7297  176.6  53.2  -36.3  -0.0252  -0.1   14.0	GRS 1915+105
299.5942  35.2115    0.8  43.4   -3.2   1.8632  14.8    0.6	Cyg X-1
308.1340  41.0696    2.6  39.3    8.7   0.5232   4.4    7.1	Cyg X-3
326.1219  38.4948    4.9  27.0   21.3  -0.2027  -2.3   10.7	Cyg X-2
337.7985  20.2318    2.5   6.7    0.0   0.3232   4.5 ------	UNKNOWN
 18.9612 -15.1652    2.7  47.0 -177.8   0.6157   4.3 ------	UNKNOWN
357.0512  -0.8801    2.9  21.7 -167.2   0.3205   4.0  184.6	UNKNOWN
343.1554  -2.5607    2.6  18.8 -126.8   0.3641   4.5 ------	UNKNOWN
357.4778 -27.8036    2.7  46.0 -145.1   0.7265   4.3 ------	UNKNOWN
  0.3808 -36.0829    2.4  54.7 -144.5   2.5763   4.9 ------	UNKNOWN
Pre-slew background subtracted image of 15-350 keV band
Time interval of the image:
-54.736000 12.332590

# RAcent  DECcent POSerr Theta    Phi  PeakCts   SNR AngSep     Name
#  [deg]    [deg]    ['] [deg]  [deg]                   [']
288.8055  10.9121    5.9  53.3  -36.1   1.0082   2.0    2.1	GRS 1915+105
299.6710  35.2519    4.7  43.4   -3.2  -0.4471  -2.5    5.0	Cyg X-1
308.1158  40.8558    3.4  39.2    8.4   0.5616   3.4    5.8	Cyg X-3
326.0707  38.4749    3.9  27.0   21.2   0.3758   2.9   10.4	Cyg X-2
  6.7938 -23.5094    0.7  45.8 -158.2   3.2906  15.7 ------	UNKNOWN
Post-slew image of 15-350 keV band
Time interval of the image:
88.332600 962.283800

# RAcent  DECcent POSerr Theta    Phi  PeakCts   SNR AngSep     Name
#  [deg]    [deg]    ['] [deg]  [deg]                   [']
 29.5675  12.1628    2.9  42.0   43.0   4.7183   4.0 ------	UNKNOWN
 40.5819 -78.4655    3.3  57.1 -179.0  10.1708   3.5 ------	UNKNOWN
359.1349  10.7351    2.6  35.0   -4.6   2.6493   4.4 ------	UNKNOWN
338.7684 -35.3284    3.3  27.0 -113.8   2.1743   3.5 ------	UNKNOWN
326.0714   0.1032    4.2  46.0  -56.5   6.7706   2.8 ------	UNKNOWN
318.9279 -37.6830    4.2  43.1 -112.2   6.2174   2.7 ------	UNKNOWN