Analysis Summary
Notes:
- 1) No attempt has been made to eliminate the non-significant decimal places.
- 2) This batgrbproduct analysis is done using the HEASARC data.
- 3) This batgrbproduct analysis is using the flight position for the mask-weighting calculation.
======================================================================
                  BAT GRB EVENT DATA PROCESSING REPORT
    Process Script Ver: batgrbproduct v2.46
    Process Start Time: Sun Jan 19 18:57:10 EST 2014
             Host Name: batevent1
   Current Working Dir: /local/data/batevent/batevent_reproc/trigger341504
======================================================================

  Trigger: 00341504      Segment: 000

  BAT Trigger Time: 254956039.744   [s; MET]
      Trigger Stop: 254956040   [s; MET]
               UTC: 2009-01-29T21:07:15.287600    [includes UTCF correction]
       Where From?: TDRSS position message

  BAT
    RA: 269.091866815445   Dec: -32.8258331356111  [deg; J2000]

     Catalogged Source?: NO
     Point Source?:      YES
     GRB Indicated?:     YES    [ by BAT flight software ]
     Image S/N Ratio:    11.36
     Image Trigger?:     NO
     Rate S/N Ratio:     24.1246761636296  [ if not an image trigger ]
     Image S/N Ratio:    11.36

  Analysis Position:   [ source = BAT ]
    RA: 269.091866815445   Dec: -32.8258331356111  [deg; J2000]

  Refined Position:   [ source = BAT pre-slew burst ]
    RA: 269.105558815306   Dec: -32.7923594392183  [deg; J2000]
        { 17h 56m 25.3s , -32d 47' 32.5" }
         +/- 0.679220234842424 [arcmin] (estimated 90% radius based on SNR)
         +/- 0.252632377131203 [arcmin] (formal 1-sigma fit error)
    SNR: 52.857085747433

  Angular difference between the analysis and refined position is 2.123796 arcmin

  Partial Coding Fraction: 0.890625    [ including projection effects ]

  Duration
     T90: 17.6240000128746 +/- 2.62417682817886
        Measured from: 0.395999997854233
                   to: 18.0200000107288     [s; relative to TRIGTIME]
     T50: 7.03999999165535 +/- 0.440218143582139
        Measured from: 2.10000002384186
                   to: 9.14000001549721     [s; relative to TRIGTIME]


  Fluence
     Peak Flux  (peak 1 second)
        Measured from: 1.00400000810623
                   to: 2.00400000810623     [s; relative to TRIGTIME]
     Total Fluence
        Measured from: -0.211999982595444
                   to: 26.7199999988079     [s; relative to TRIGTIME]

             Band 1     Band 2     Band 3     Band 4
              15-25      25-50     50-100    100-350     keV
 Total     1.334372   1.554283   0.905741   0.140244
           0.036348   0.034906   0.029977   0.025901 [error]
 Peak      0.116618   0.186738   0.130909   0.034123
           0.007875   0.008361   0.007485   0.005921 [error]

     [ fluence units of on-axis counts / fully illuminated detector ]

======================================================================


====== Table of the duration information =============================

        Value   tstart    tstop
T100   26.932   -0.212   26.720
T90    17.624    0.396   18.020
T50     7.040    2.100    9.140
Peak    1.000    1.004    2.004


====== Spectral Analysis Summary =====================================

Model      : spectral model: simple power-law (PL) and cutoff power-law (CPL)
Ph_index   : photon index: E^{Ph_index}
Ph_90err   : 90% error of the photon index
Epeak      : Epeak in keV
Epeak_90err: 90% error of Epeak
Norm       : normalization at 50 keV in both the PL model and CPL model
Nomr_90err : 90% error of the normalization
chi2       : Chi-Squared
dof        : degree of freedo

=== Time-averaged spectral analysis ===
(Best model with acceptable fit: PL)

Model Ph_index Ph_90err_low Ph_90err_hi  Epeak  Epeak_90err_low  Epeak_90err_hi  Norm       Nomr_90err_low    Norm_90err_hi    chi2    dof
PL      -1.824    -0.063      0.062       -           -               -         8.91e-03     -2.86e-04          2.85e-04      46.180   57
CPL     -1.598    -0.239      0.255       88.020     -23.340       -88.020      1.15e-02     -2.69e-03          3.80e-03      43.600   56


=== 1-s peak spectral analysis ===
(Best model with acceptable fit: PL)

Model Ph_index Ph_90err_low Ph_90err_hi  Epeak  Epeak_90err_low  Epeak_90err_hi  Norm       Nomr_90err_low    Norm_90err_hi    chi2    dof
PL      -1.434     -0.097     0.096       -           -               -         3.06e-02     -1.67e-03          1.66e-03      52.110   57
CPL     -1.088     -0.373     0.406      134.236     -47.242      -134.236      4.54e-02     -1.52e-02          2.59e-02      49.580   56


=== Fluence/Peak Flux Summary ===

              Model    Band1     Band2     Band3     Band4     Band5     Total
                       15-25     25-50    50-100    100-350    15-150    15-350    keV
Fluence         PL   4.16e-07  6.27e-07  7.09e-07  1.52e-06  2.21e-06  3.27e-06   erg/cm2
      90%_error_low -2.36e-08 -2.03e-08 -3.14e-08 -1.45e-07 -7.18e-08 -1.67e-07   erg/cm2
      90%_error_hi   2.42e-08  2.03e-08  3.14e-08  1.55e-07  7.20e-08  1.75e-07   erg/cm2
Peak flux       PL   1.18e+00  1.24e+00  9.16e-01  1.09e+00  3.76e+00  4.43e+00   ph/cm2/s
      90%_error_low -1.13e-01 -7.25e-02 -6.25e-02 -1.49e-01 -2.05e-01 -2.42e-01   ph/cm2/s
      90%_error_hi   1.17e-01  7.22e-02  6.22e-02  1.64e-01  2.05e-01  2.43e-01   ph/cm2/s

Fluence        CPL    N/A      N/A      N/A      N/A      N/A      N/A      erg/cm2
      90%_error_low -2.36e-08 -2.03e-08 -3.14e-08 -1.45e-07 -7.18e-08 -1.67e-07   erg/cm2
      90%_error_hi   2.42e-08  2.03e-08  3.14e-08  1.55e-07  7.20e-08  1.75e-07   erg/cm2
Peak flux      CPL   1.10e+00  1.27e+00  9.41e-01  7.37e-01  3.69e+00  4.06e+00   ph/cm2/s
      90%_error_low -1.38e-01 -8.23e-02 -6.89e-02 -2.48e-01 -2.18e-01 -3.43e-01   ph/cm2/s
      90%_error_hi   1.41e-01  8.37e-02  6.99e-02  3.72e-01  2.17e-01  4.47e-01   ph/cm2/s

======================================================================
Image
Pre-slew 15.0-350.0 keV image (Event data)
#   RAcent    DECcent   POSerr    Theta     Phi              Peak Cts       SNR   Name
  269.1056   -32.7924   0.0036    18.1521  -129.2073         4.0466769     52.857 TRIG_00341504

Foreground time interval of the image:
 -0.212  26.720 (delta_t =  26.932 [sec])
Background time interval of the image:
-119.744 -119.607 (delta_t =   0.137 [sec])
-118.744  -0.212 (delta_t = 118.532 [sec])
Light Curves
Note: The mask-weighted lightcurves have units of either count/det or counts/sec/det, where a det is 0.4 x 0.4 = 0.16 sq cm.
Full-time range; 1 s binning
Other quick-look light curves:
- 64 ms binning (zoomed)
- 16 ms binning (zoomed)
- 8 ms binning (zoomed)
- 2 ms binning (zoomed)
- SN=5 or 10 s binning (full-time range)
- Raw light curve
Spectra
- 64 ms binning (zoomed)
- 16 ms binning (zoomed)
- 8 ms binning (zoomed)
- 2 ms binning (zoomed)
- SN=5 or 10 s binning (full-time range)
- Raw light curve
Spectra
Notes:
- 1) The fitting includes the systematic errors.
- 2) When the burst includes telescope slew time periods, the fitting uses an average response file made from multiple 5-s response files through out the slew time plus single time preiod for the non-slew times, and weighted by the total counts in the corresponding time period using addrmf. An average response file is needed becuase a spectral fit using the pre-slew DRM will introduce some errors in both a spectral shape and a normalization if the PHA file contains a lot of the slew/post-slew time interval.
- 3) For fits to more complicated models (e.g. a power-law over a cutoff power-law), the BAT team has decided to require a chi-square improvement of more than 6 for each extra dof.
Time averaged spectrum fit using the average DRM
Power-law model
Time interval is from   -0.212 sec. to   26.720 sec.

Spectral model in power-law:
------------------------------------------------------------
Parameters  : value       lower 90%   higher 90%
Photon index: -1.82394     ( -0.0625572   0.0621259 )
Norm@50keV  : 8.91379E-03    ( -0.000286178   0.000285331 )
------------------------------------------------------------
#Fit statistic : Chi-Squared =          46.18 using 59 PHA bins.
# Reduced chi-squared =         0.8102 for     57 degrees of freedom
# Null hypothesis probability =   8.466841e-01

Photon flux (15-150 keV)    in 26.93 sec: 1.23995 ( -0.04174  0.04192 ) ph/cm2/s
Energy fluence (15-150 keV)             : 2.20865e-06 ( -7.18355e-08  7.20426e-08 ) ergs/cm2
Cutoff power-law model
Time interval is from   -0.212 sec. to   26.720 sec.
Spectral model in the cutoff power-law:
------------------------------------------------------------
Parameters  : value       lower 90%   higher 90%
Photon index: -1.59751     ( -0.238986   0.254569 )
Epeak [keV] : 88.0198      ( -23.3398 -88.0198 )
Norm@50keV  : 1.15444E-02    ( -0.00268708   0.00379569 )
------------------------------------------------------------
#Fit statistic : Chi-Squared =          43.60 using 59 PHA bins.
# Reduced chi-squared =         0.7785 for     56 degrees of freedom
# Null hypothesis probability =   8.863868e-01

Photon flux (15-150 keV)    in 26.93 sec: 1.21635 ( -0.04813  0.04835 ) ph/cm2/s
Energy fluence (15-150 keV)             : 0 ( 0  0 ) ergs/cm2
1-s peak spectrum fit
Power-law model
Time interval is from    1.004 sec. to    2.004 sec.

Spectral model in power-law:
------------------------------------------------------------
Parameters  : value       lower 90%   higher 90%
Photon index: -1.43377     ( -0.0965682   0.0961552 )
Norm@50keV  : 3.06030E-02    ( -0.00166569   0.00165991 )
------------------------------------------------------------
#Fit statistic : Chi-Squared =          52.11 using 59 PHA bins.
# Reduced chi-squared =         0.9141 for     57 degrees of freedom
# Null hypothesis probability =   6.588123e-01

Photon flux (15-150 keV)    in 1 sec: 3.75653 ( -0.20513  0.20537 ) ph/cm2/s
Energy fluence (15-150 keV)             : 2.93778e-07 ( -1.7752e-08  1.78741e-08 ) ergs/cm2
Cutoff power-law model
Time interval is from    1.004 sec. to    2.004 sec.
Spectral model in the cutoff power-law:
------------------------------------------------------------
Parameters  : value       lower 90%   higher 90%
Photon index: -1.08832     ( -0.372574   0.405773 )
Epeak [keV] : 134.236      ( -47.2423 -134.236 )
Norm@50keV  : 4.53999E-02    ( -0.0151728   0.0259342 )
------------------------------------------------------------
#Fit statistic : Chi-Squared =          49.58 using 59 PHA bins.
# Reduced chi-squared =         0.8854 for     56 degrees of freedom
# Null hypothesis probability =   7.149164e-01

Photon flux (15-150 keV)    in 1 sec: 3.68834 ( -0.21756  0.21747 ) ph/cm2/s
Energy fluence (15-150 keV)             : 2.85568e-07 ( -1.99791e-08  1.99171e-08 ) ergs/cm2
Time-resolved spectra
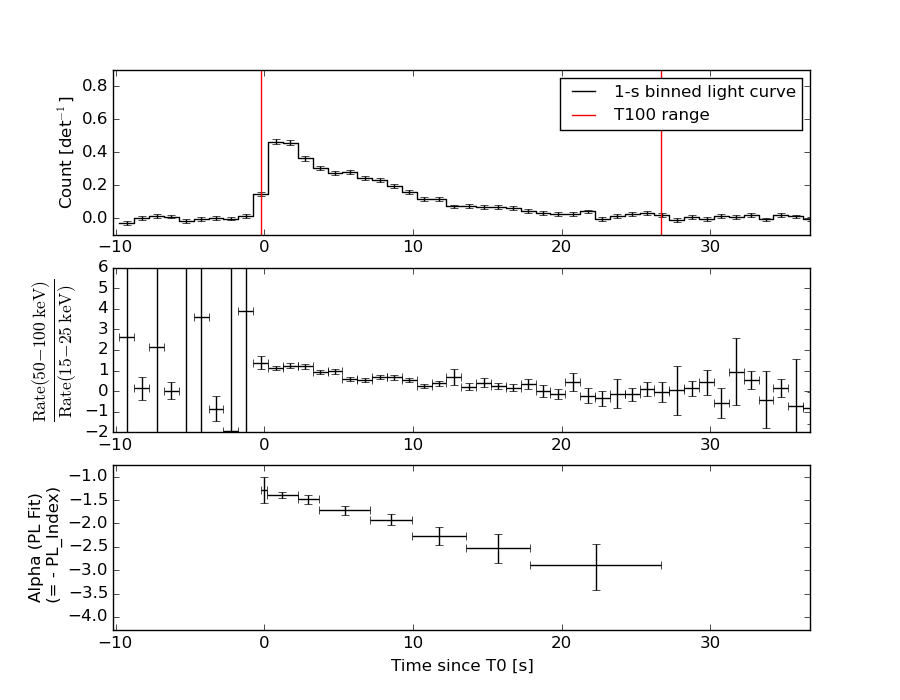
Distribution
T90 vs. Hardness ratio plot
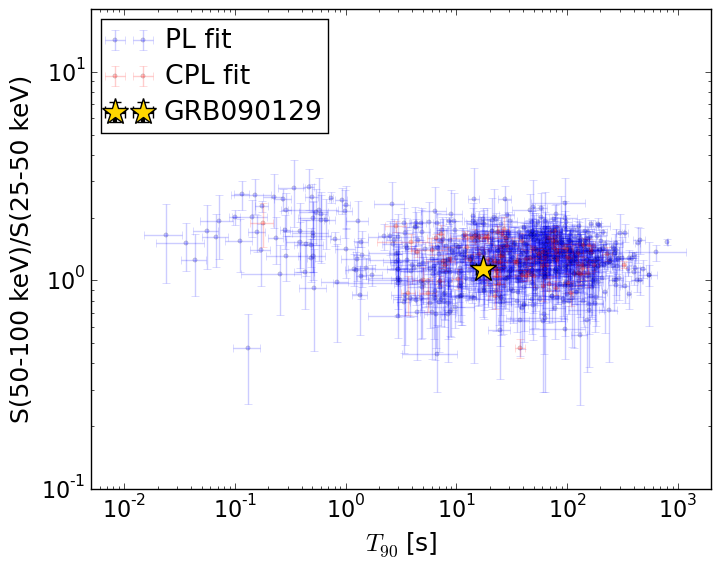
T90                                   = 17.624 sec.
Hardness ratio (energy fluence ratio) = 1.12982195255
S(15-50 keV) vs. S(50-150 keV) plot
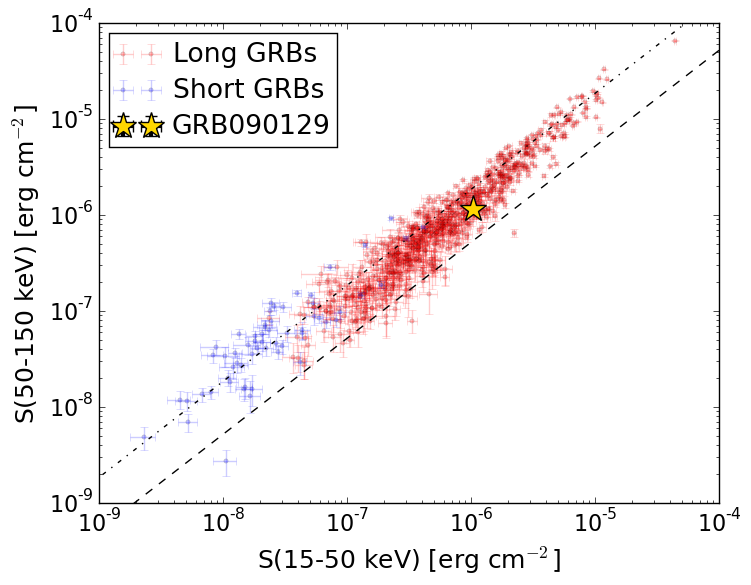
S(15-50 keV)  = 1.0432189e-06
S(50-150 keV) = 1.1654383e-06
The dash-dotted line and the dashed line traces the fluences calculated from the Band function with Epeak = 15 and 150 keV, respectively. Both lines assume a canonical values of alpha = -1 and beta = -2.5.
Mask shadow pattern
IMX = -2.072476352934535E-01, IMY = 2.540448039391481E-01
Spacecraft aspect plot
Bright source in the pre-burst/pre-slew/post-slew images
Pre-burst image of 15-350 keV band
Time interval of the image:
-119.744000 -119.607500
-118.744000 -0.212000

# RAcent  DECcent POSerr Theta    Phi  PeakCts   SNR AngSep     Name
#  [deg]    [deg]    ['] [deg]  [deg]                   [']
170.2999 -60.4928   84.2  48.1   39.1  -0.0843  -0.1    7.8	Cen X-3
186.6830 -62.7873    1.3  40.0   38.4   2.7879   9.2    1.3	GX 301-2
244.9804 -15.6531    0.5  30.2  164.7   4.0013  23.1    0.8	Sco X-1
255.9448 -37.7774    5.7   8.0 -158.8   0.2575   2.0    4.5	4U 1700-377
256.3333 -36.4242    3.6   9.4 -159.9   0.4076   3.2    4.9	GX 349+2
263.0862 -24.8582    5.8  22.3 -154.4   0.2822   2.0    8.0	GX 1+4
264.5382 -44.4907    6.7   8.9  -92.2   0.2253   1.7    9.1	4U 1735-44
268.3689  -1.4510   10.3  46.1 -158.8   0.2853   1.1    0.1	SW J1753.5-0127
270.2159 -25.0203    3.2  25.0 -139.7   0.5283   3.6    5.1	GX 5-1
270.1975 -25.6083    4.7  24.5 -139.0   0.3690   2.4    9.9	GRS 1758-258
274.0267 -14.0014    3.1  36.4 -143.9   0.7295   3.8    2.4	GX 17+2
275.7363 -30.2543    3.5  23.9 -122.5   0.5160   3.3   11.9	H1820-303
284.9503 -24.9886    4.0  33.3 -118.0   0.6215   2.9    6.2	HT1900.1-2455
262.9862 -33.8936    2.4  14.1 -141.4   0.6212   4.9    3.5	GX 354-0
229.4030 -23.9080    1.9  28.1  130.0   1.1331   6.0 ------	UNKNOWN
230.8698 -35.1111    2.4  19.0  113.1   0.7452   4.9 ------	UNKNOWN
261.2344 -20.0026    2.8  26.4 -161.9   0.5920   4.2 ------	UNKNOWN
344.4351 -64.8158    3.1  51.0  -35.0   1.8020   3.8 ------	UNKNOWN
317.0630 -47.5845    3.6  43.6  -64.4   2.1387   3.2 ------	UNKNOWN
Pre-slew background subtracted image of 15-350 keV band
Time interval of the image:
-0.212000 26.720000

# RAcent  DECcent POSerr Theta    Phi  PeakCts   SNR AngSep     Name
#  [deg]    [deg]    ['] [deg]  [deg]                   [']
170.3242 -60.6215   35.0  48.0   38.9   0.1051   0.3    0.3	Cen X-3
186.7842 -62.8908    9.0  39.9   38.3  -0.2144  -1.3    8.0	GX 301-2
245.1319 -15.5332    5.2  30.3  165.0  -0.2018  -2.2   10.9	Sco X-1
255.7992 -37.8957    5.1   7.9 -159.3  -0.1633  -2.3    9.4	4U 1700-377
256.6245 -36.5704    0.0   9.4 -158.2  -0.0365  -0.5   12.7	GX 349+2
262.8455 -24.6048    6.6  22.4 -155.1   0.1274   1.8   12.3	GX 1+4
264.8624 -44.4009   19.7   9.2  -92.5   0.0424   0.6    5.9	4U 1735-44
268.3373  -1.5384    3.7  46.0 -158.8   0.4636   3.1    5.5	SW J1753.5-0127
270.4012 -25.0043    4.8  25.1 -139.4   0.2035   2.4    7.8	GX 5-1
270.2614 -25.8511    7.7  24.3 -138.5   0.1251   1.5    6.9	GRS 1758-258
273.8759 -14.0748    4.1  36.3 -144.1   0.2898   2.8    7.9	GX 17+2
275.7145 -30.2578    0.0  23.9 -122.6  -0.1072  -1.3   12.7	H1820-303
284.8415 -24.8409   75.1  33.4 -118.3  -0.0190  -0.2   11.6	HT1900.1-2455
263.0378 -33.7250    4.8  14.3 -141.6   0.1795   2.4    7.0	GX 354-0
181.6698 -53.7408    2.5  44.5   50.7   1.6667   4.7 ------	UNKNOWN
198.1638 -60.9298    2.3  34.7   41.8   0.6466   5.1 ------	UNKNOWN
237.1746   4.1878    3.3  51.2  159.1   1.1135   3.5 ------	UNKNOWN
231.6985 -35.1879    2.3  18.4  114.3   0.4123   5.0 ------	UNKNOWN
269.1056 -32.7924    0.2  18.2 -129.2   4.0464  52.9 ------	UNKNOWN
266.3284   7.4401    2.8  54.2 -164.2   0.8755   4.1 ------	UNKNOWN
282.6851  -7.8614    2.0  45.8 -137.0   1.0320   5.9 ------	UNKNOWN
Post-slew image of 15-350 keV band
Time interval of the image:
75.956600 302.346000

# RAcent  DECcent POSerr Theta    Phi  PeakCts   SNR AngSep     Name
#  [deg]    [deg]    ['] [deg]  [deg]                   [']
170.4973 -60.4540   20.0  35.1   44.7   0.2138   0.6   11.5	Cen X-3
186.6912 -62.7799    0.8  27.1   43.8   3.2441  13.7    1.1	GX 301-2
244.9880 -15.6415    0.6  39.1 -176.5   5.7821  19.6    0.5	Sco X-1
256.0507 -37.9360    2.7  20.6 -142.8   0.8362   4.2    6.3	4U 1700-377
256.4168 -36.5070    4.5  22.0 -144.1   0.5086   2.5    5.1	GX 349+2
262.9011 -24.8948    0.0  34.8 -145.1   0.2124   0.8   10.7	GX 1+4
264.6739 -44.3408    8.9  20.0 -116.4   0.2762   1.3    7.2	4U 1735-44
270.3000 -25.0573    3.2  37.9 -135.0   1.2415   3.6    1.6	GX 5-1
270.3161 -25.6173    3.9  37.4 -134.5   1.0017   2.9    7.6	GRS 1758-258
274.1335 -14.1348    5.3  49.2 -138.1   1.7808   2.2    9.5	GX 17+2
275.9247 -30.3670 1862.8  36.3 -123.2   0.0020   0.0    0.0	H1820-303
262.9535 -33.8115    2.8  27.1 -136.5   1.0190   4.1    2.3	GX 354-0
155.7793 -66.8841    2.5  38.8   30.8   1.6781   4.7 ------	UNKNOWN