Analysis Summary
Notes:
- 1) No attempt has been made to eliminate the non-significant decimal places.
- 2) This batgrbproduct analysis is done using the HEASARC data.
- 3) This batgrbproduct analysis is using the flight position for the mask-weighting calculation.
======================================================================
                  BAT GRB EVENT DATA PROCESSING REPORT
    Process Script Ver: batgrbproduct v2.46
    Process Start Time: Sat May  9 19:01:55 EDT 2015
             Host Name: bat1
   Current Working Dir: /local/data/bat1/alien/Swift_3rdBATcatalog/event/batevent_reproc/trigger341749
======================================================================

  Trigger: 00341749      Segment: 000

  BAT Trigger Time: 255203227.2   [s; MET]
      Trigger Stop: 255203228.224   [s; MET]
               UTC: 2009-02-01T17:47:02.735980    [includes UTCF correction]
       Where From?: TDRSS position message

  BAT
    RA: 92.0311957018397   Dec: -46.5864119988985  [deg; J2000]

     Catalogged Source?: NO
     Point Source?:      YES
     GRB Indicated?:     YES    [ by BAT flight software ]
     Image S/N Ratio:    7.91
     Image Trigger?:     NO
     Rate S/N Ratio:     32.7719392163479  [ if not an image trigger ]
     Image S/N Ratio:    7.91

  Analysis Position:   [ source = BAT ]
    RA: 92.0311957018397   Dec: -46.5864119988985  [deg; J2000]

  Refined Position:   [ source = BAT pre-slew burst ]
    RA: 92.051690900999   Dec: -46.6051270235404  [deg; J2000]
        { 06h 08m 12.4s , -46d 36' 18.5" }
         +/- 0.975326327289985 [arcmin] (estimated 90% radius based on SNR)
         +/- 0.475306157058599 [arcmin] (formal 1-sigma fit error)
    SNR: 31.5223404408002

  Angular difference between the analysis and refined position is 1.405314 arcmin

  Partial Coding Fraction: 0.0859375    [ including projection effects ]

  Duration
     T90: 74.2640000283718 +/- 1.68066294507664
        Measured from: 1.44400000572205
                   to: 75.7080000340939     [s; relative to TRIGTIME]
     T50: 35.7640000283718 +/- 4.06205119510412
        Measured from: 13.4000000059605
                   to: 49.1640000343323     [s; relative to TRIGTIME]


  Fluence
     Peak Flux  (peak 1 second)
        Measured from: 7.608000010252
                   to: 8.608000010252     [s; relative to TRIGTIME]
     Total Fluence
        Measured from: -2.21199998259544
                   to: 83.9280000030994     [s; relative to TRIGTIME]

             Band 1     Band 2     Band 3     Band 4
              15-25      25-50     50-100    100-350     keV
 Total     8.320725  14.775353  13.727905   3.885969
           0.217823   0.251722   0.241583   0.199082 [error]
 Peak      0.250958   0.550148   0.730744   0.290344
           0.028207   0.038532   0.043771   0.035406 [error]

     [ fluence units of on-axis counts / fully illuminated detector ]

======================================================================


====== Table of the duration information =============================

        Value   tstart    tstop
T100   86.140   -2.212   83.928
T90    74.264    1.444   75.708
T50    35.764   13.400   49.164
Peak    1.000    7.608    8.608


====== Spectral Analysis Summary =====================================

Model      : spectral model: simple power-law (PL) and cutoff power-law (CPL)
Ph_index   : photon index: E^{Ph_index}
Ph_90err   : 90% error of the photon index
Epeak      : Epeak in keV
Epeak_90err: 90% error of Epeak
Norm       : normalization at 50 keV in both the PL model and CPL model
Nomr_90err : 90% error of the normalization
chi2       : Chi-Squared
dof        : degree of freedo

=== Time-averaged spectral analysis ===
(Best model with acceptable fit: CPL)

Model Ph_index Ph_90err_low Ph_90err_hi  Epeak  Epeak_90err_low  Epeak_90err_hi  Norm       Nomr_90err_low    Norm_90err_hi    chi2    dof
PL      -1.410    -0.038      0.039       -           -               -         3.56e-02     -7.71e-04          7.71e-04      67.380   57
CPL     -0.904    -0.166      0.172      125.692     -17.810        32.759      5.91e-02     -8.88e-03          1.08e-02      38.540   56


=== 1-s peak spectral analysis ===
(Best model with acceptable fit: PL)

Model Ph_index Ph_90err_low Ph_90err_hi  Epeak  Epeak_90err_low  Epeak_90err_hi  Norm       Nomr_90err_low    Norm_90err_hi    chi2    dof
PL      -0.925     -0.112     0.114       -           -               -         1.27e-01     -8.84e-03          8.82e-03      50.500   57
CPL     -0.494     -0.424     0.488      207.680     -79.710      9367.010      1.96e-01     -6.43e-02          1.18e-01      47.690   56


=== Fluence/Peak Flux Summary ===

              Model    Band1     Band2     Band3     Band4     Band5     Total
                       15-25     25-50    50-100    100-350    15-150    15-350    keV
Fluence         PL   3.60e-06  6.98e-06  1.05e-05  3.42e-05  2.95e-05  5.53e-05   erg/cm2
      90%_error_low -1.58e-07 -1.84e-07 -2.57e-07 -1.86e-06 -6.52e-07 -1.98e-06   erg/cm2
      90%_error_hi   1.61e-07  1.84e-07  2.56e-07  1.93e-06  6.53e-07  2.04e-06   erg/cm2
Peak flux       PL   3.02e+00  4.28e+00  4.51e+00  8.78e+00  1.46e+01  2.06e+01   ph/cm2/s
      90%_error_low -4.08e-01 -3.70e-01 -3.31e-01 -1.28e+00 -1.02e+00 -1.57e+00   ph/cm2/s
      90%_error_hi   4.27e-01  3.67e-01  3.29e-01  1.41e+00  1.02e+00  1.60e+00   ph/cm2/s

Fluence        CPL   3.14e-06  7.15e-06  1.11e-05  1.95e-05  2.89e-05  4.09e-05   erg/cm2
      90%_error_low -2.05e-07 -1.98e-07 -3.15e-07 -3.00e-06 -6.93e-07 -3.03e-06   erg/cm2
      90%_error_hi   2.09e-07  1.99e-07  3.17e-07  3.69e-06  6.92e-07  3.68e-06   erg/cm2
Peak flux      CPL   2.69e+00  4.39e+00  4.80e+00  5.93e+00  1.44e+01  1.78e+01   ph/cm2/s
      90%_error_low -5.09e-01 -4.00e-01 -4.35e-01 -1.89e+00 -1.03e+00 -2.14e+00   ph/cm2/s
      90%_error_hi   5.30e-01  4.04e-01  4.43e-01  2.89e+00  1.03e+00  2.98e+00   ph/cm2/s

======================================================================
Image
Pre-slew 15.0-350.0 keV image (Event data)
#   RAcent    DECcent   POSerr    Theta     Phi              Peak Cts       SNR   Name
   92.0517   -46.6051   0.0061    46.5215   -50.3193        44.5913567     31.522 TRIG_00341749

Foreground time interval of the image:
 -2.212  83.928 (delta_t =  86.140 [sec])
Background time interval of the image:
-239.200  -2.212 (delta_t = 236.988 [sec])
Light Curves
Note: The mask-weighted lightcurves have units of either count/det or counts/sec/det, where a det is 0.4 x 0.4 = 0.16 sq cm.
Full-time range; 1 s binning
Other quick-look light curves:
- 64 ms binning (zoomed)
- 16 ms binning (zoomed)
- 8 ms binning (zoomed)
- 2 ms binning (zoomed)
- SN=5 or 10 s binning (full-time range)
- Raw light curve
Spectra
- 64 ms binning (zoomed)
- 16 ms binning (zoomed)
- 8 ms binning (zoomed)
- 2 ms binning (zoomed)
- SN=5 or 10 s binning (full-time range)
- Raw light curve
Spectra
Notes:
- 1) The fitting includes the systematic errors.
- 2) When the burst includes telescope slew time periods, the fitting uses an average response file made from multiple 5-s response files through out the slew time plus single time preiod for the non-slew times, and weighted by the total counts in the corresponding time period using addrmf. An average response file is needed becuase a spectral fit using the pre-slew DRM will introduce some errors in both a spectral shape and a normalization if the PHA file contains a lot of the slew/post-slew time interval.
- 3) For fits to more complicated models (e.g. a power-law over a cutoff power-law), the BAT team has decided to require a chi-square improvement of more than 6 for each extra dof.
Time averaged spectrum fit using the average DRM
Power-law model
Time interval is from   -2.212 sec. to   83.928 sec.

Spectral model in power-law:
------------------------------------------------------------
Parameters  : value       lower 90%   higher 90%
Photon index: -1.41038     ( -0.0384557   0.0385215 )
Norm@50keV  : 3.55569E-02    ( -0.000771282   0.000771032 )
------------------------------------------------------------
#Fit statistic : Chi-Squared =          67.38 using 59 PHA bins.
# Reduced chi-squared =          1.182 for     57 degrees of freedom
# Null hypothesis probability =   1.635150e-01

Photon flux (15-150 keV)    in 86.14 sec: 4.34056 ( -0.106  0.10629 ) ph/cm2/s
Energy fluence (15-150 keV)             : 2.95369e-05 ( -6.51723e-07  6.52538e-07 ) ergs/cm2
Cutoff power-law model
Time interval is from   -2.212 sec. to   83.928 sec.
Spectral model in the cutoff power-law:
------------------------------------------------------------
Parameters  : value       lower 90%   higher 90%
Photon index: -0.904175     ( -0.166248   0.172362 )
Epeak [keV] : 125.692      ( -17.8104 32.7595 )
Norm@50keV  : 5.91182E-02    ( -0.00887747   0.0108337 )
------------------------------------------------------------
#Fit statistic : Chi-Squared =          38.54 using 59 PHA bins.
# Reduced chi-squared =         0.6883 for     56 degrees of freedom
# Null hypothesis probability =   9.637684e-01

Photon flux (15-150 keV)    in 86.14 sec: 4.19511 ( -0.11386  0.11439 ) ph/cm2/s
Energy fluence (15-150 keV)             : 2.88858e-05 ( -6.92611e-07  6.91889e-07 ) ergs/cm2
1-s peak spectrum fit
Power-law model
Time interval is from    7.608 sec. to    8.608 sec.

Spectral model in power-law:
------------------------------------------------------------
Parameters  : value       lower 90%   higher 90%
Photon index: -0.924586     ( -0.112422   0.114233 )
Norm@50keV  : 0.126866    ( -0.0088442   0.00882166 )
------------------------------------------------------------
#Fit statistic : Chi-Squared =          50.50 using 59 PHA bins.
# Reduced chi-squared =         0.8860 for     57 degrees of freedom
# Null hypothesis probability =   7.157519e-01

Photon flux (15-150 keV)    in 1 sec: 14.5663 ( -1.0203  1.021 ) ph/cm2/s
Energy fluence (15-150 keV)             : 1.41055e-06 ( -1.0474e-07  1.05069e-07 ) ergs/cm2
Cutoff power-law model
Time interval is from    7.608 sec. to    8.608 sec.
Spectral model in the cutoff power-law:
------------------------------------------------------------
Parameters  : value       lower 90%   higher 90%
Photon index: -0.493668     ( -0.423832   0.488211 )
Epeak [keV] : 207.680      ( -79.7101 9367.01 )
Norm@50keV  : 0.195993    ( -0.0643152   0.117689 )
------------------------------------------------------------
#Fit statistic : Chi-Squared =          47.69 using 59 PHA bins.
# Reduced chi-squared =         0.8517 for     56 degrees of freedom
# Null hypothesis probability =   7.774123e-01

Photon flux (15-150 keV)    in 1 sec: 14.4403 ( -1.0289  1.0292 ) ph/cm2/s
Energy fluence (15-150 keV)             : 1.39846e-06 ( -1.07805e-07  1.07453e-07 ) ergs/cm2
Time-resolved spectra
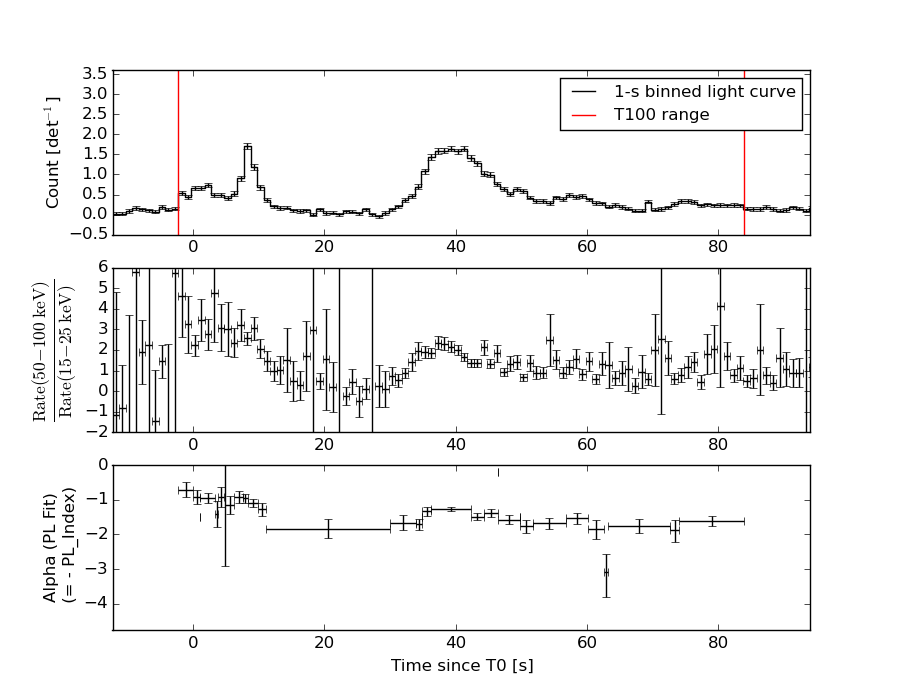
Distribution
T90 vs. Hardness ratio plot
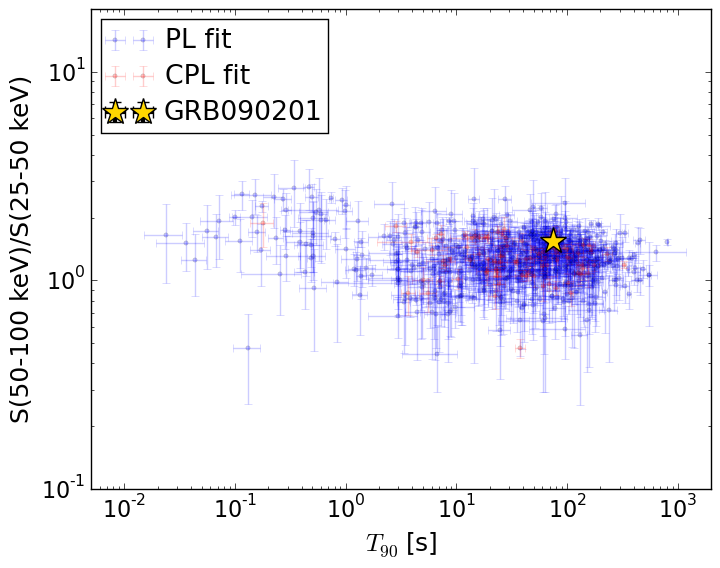
T90                                   = 74.264 sec.
Hardness ratio (energy fluence ratio) = 1.54863887915
S(15-50 keV) vs. S(50-150 keV) plot
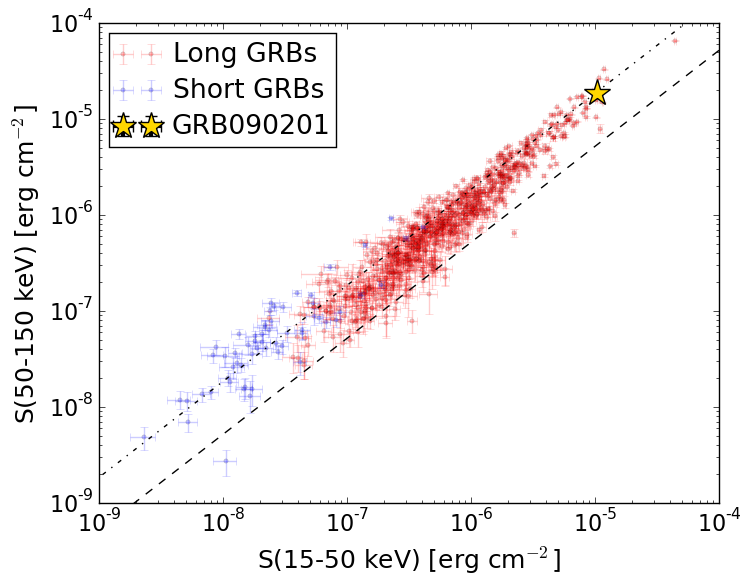
S(15-50 keV)  = 1.0283709e-05
S(50-150 keV) = 1.8602279e-05
The dash-dotted line and the dashed line traces the fluences calculated from the Band function with Epeak = 15 and 150 keV, respectively. Both lines assume a canonical values of alpha = -1 and beta = -2.5.
Mask shadow pattern
IMX = 6.733535419319304E-01, IMY = 8.116152585162864E-01
Spacecraft aspect plot
Bright source in the pre-burst/pre-slew/post-slew images
Pre-burst image of 15-350 keV band
Time interval of the image:
-239.200000 -2.212000

# RAcent  DECcent POSerr Theta    Phi  PeakCts   SNR AngSep     Name
#  [deg]    [deg]    ['] [deg]  [deg]                   [']
135.5398 -40.5917    2.6  19.5  -83.5   1.0678   4.5    2.3	Vela X-1
 96.7665   8.3506    3.1  52.6   24.2   3.4627   3.7 ------	UNKNOWN
124.4789  -4.8644    2.7  23.1   38.4   0.9569   4.3 ------	UNKNOWN
 79.4693 -35.2583    3.6  54.8  -34.5   5.0188   3.2 ------	UNKNOWN
Pre-slew background subtracted image of 15-350 keV band
Time interval of the image:
-2.212000 83.928000

# RAcent  DECcent POSerr Theta    Phi  PeakCts   SNR AngSep     Name
#  [deg]    [deg]    ['] [deg]  [deg]                   [']
135.7157 -40.4252   28.3  19.3  -83.8   0.0956   0.4   11.5	Vela X-1
153.5644  16.4703    2.9  40.1  103.3   2.2034   4.0 ------	UNKNOWN
144.2038   3.1652    2.9  25.0   92.1   0.8368   4.0 ------	UNKNOWN
 80.8277 -16.6387    2.0  56.6  -12.0   3.7526   5.7 ------	UNKNOWN
203.7373 -32.7723    3.5  56.2 -160.0   2.8597   3.3 ------	UNKNOWN
 92.0517 -46.6052    0.4  46.5  -50.3  44.5689  29.4 ------	UNKNOWN
Post-slew image of 15-350 keV band
Time interval of the image:
727.100610 962.853200

# RAcent  DECcent POSerr Theta    Phi  PeakCts   SNR AngSep     Name
#  [deg]    [deg]    ['] [deg]  [deg]                   [']
135.6769 -40.6020    4.5  49.7   -4.6   1.2611   2.6    7.3	Vela X-1
217.0410  26.0005    3.2  52.0 -169.7   1.8978   3.6 ------	UNKNOWN
155.2473 -52.6597    3.0  50.8  -28.0   2.1051   3.8 ------	UNKNOWN
225.6263   6.0516    2.8  53.4 -142.5   4.4287   4.1 ------	UNKNOWN