Analysis Summary
Notes:
- 1) No attempt has been made to eliminate the non-significant decimal places.
- 2) This batgrbproduct analysis is done using the HEASARC data.
- 3) This batgrbproduct analysis is using the flight position for the mask-weighting calculation.
======================================================================
BAT GRB EVENT DATA PROCESSING REPORT
Process Script Ver: batgrbproduct v2.46
Process Start Time: Sun Jan 19 18:49:22 EST 2014
Host Name: batevent1
Current Working Dir: /local/data/batevent/batevent_reproc/trigger342121
======================================================================
Trigger: 00342121 Segment: 000
BAT Trigger Time: 255567799.296 [s; MET]
Trigger Stop: 255567803.392 [s; MET]
UTC: 2009-02-05T23:03:14.820740 [includes UTCF correction]
Where From?: TDRSS position message
BAT
RA: 220.925433877431 Dec: -27.8637399346592 [deg; J2000]
Catalogged Source?: NO
Point Source?: YES
GRB Indicated?: YES [ by BAT flight software ]
Image S/N Ratio: 8.16
Image Trigger?: NO
Rate S/N Ratio: 15.1327459504216 [ if not an image trigger ]
Image S/N Ratio: 8.16
Analysis Position: [ source = BAT ]
RA: 220.925433877431 Dec: -27.8637399346592 [deg; J2000]
Refined Position: [ source = BAT pre-slew burst ]
RA: 220.91650989556 Dec: -27.8492183299414 [deg; J2000]
{ 14h 43m 40.0s , -27d 50' 57.2" }
+/- 1.99605923167749 [arcmin] (estimated 90% radius based on SNR)
+/- 0.89193218931916 [arcmin] (formal 1-sigma fit error)
SNR: 11.3318078597344
Angular difference between the analysis and refined position is 0.991594 arcmin
Partial Coding Fraction: 1.015625 [ including projection effects ]
Duration
T90: 8.8120000064373 +/- 1.77945720942472
Measured from: -2.60400000214577
to: 6.20800000429153 [s; relative to TRIGTIME]
T50: 4.33200001716614 +/- 1.06734248169701
Measured from: 0.00799998641014099
to: 4.34000000357628 [s; relative to TRIGTIME]
Fluence
Peak Flux (peak 1 second)
Measured from: 4.0799999833107
to: 5.0799999833107 [s; relative to TRIGTIME]
Total Fluence
Measured from: -2.9200000166893
to: 6.62399998307228 [s; relative to TRIGTIME]
Band 1 Band 2 Band 3 Band 4
15-25 25-50 50-100 100-350 keV
Total 0.164760 0.171229 0.062367 -0.011050
0.016961 0.016448 0.013997 0.011884 [error]
Peak 0.030009 0.021611 0.009052 0.001841
0.005569 0.005361 0.004557 0.003763 [error]
[ fluence units of on-axis counts / fully illuminated detector ]
======================================================================
====== Table of the duration information =============================
Value tstart tstop
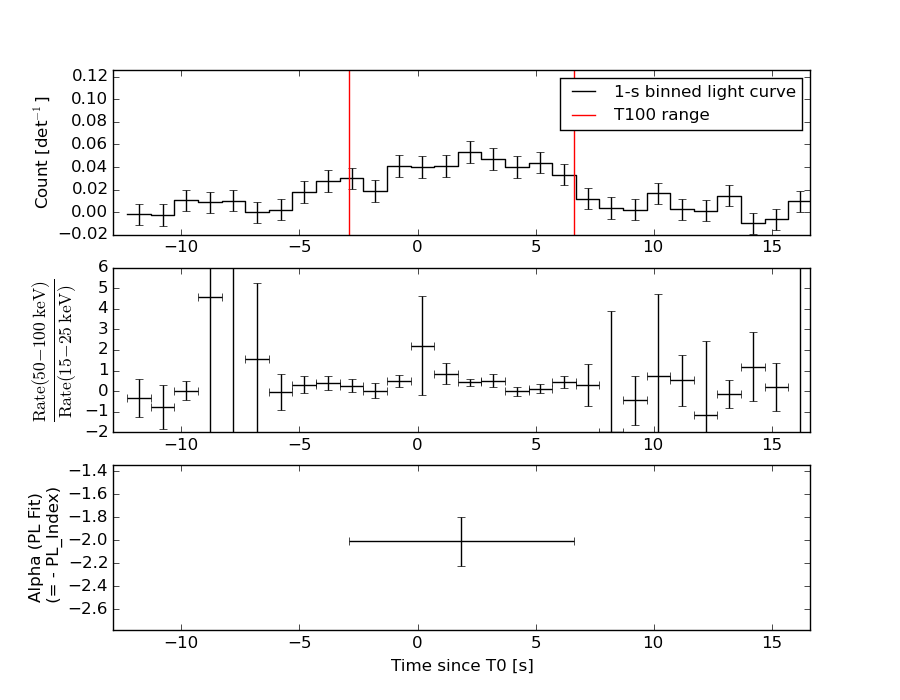
T100 9.544 -2.920 6.624
T90 8.812 -2.604 6.208
T50 4.332 0.008 4.340
Peak 1.000 4.080 5.080
====== Spectral Analysis Summary =====================================
Model : spectral model: simple power-law (PL) and cutoff power-law (CPL)
Ph_index : photon index: E^{Ph_index}
Ph_90err : 90% error of the photon index
Epeak : Epeak in keV
Epeak_90err: 90% error of Epeak
Norm : normalization at 50 keV in both the PL model and CPL model
Nomr_90err : 90% error of the normalization
chi2 : Chi-Squared
dof : degree of freedo
=== Time-averaged spectral analysis ===
(Best model with acceptable fit: PL)
Model Ph_index Ph_90err_low Ph_90err_hi Epeak Epeak_90err_low Epeak_90err_hi Norm Nomr_90err_low Norm_90err_hi chi2 dof
PL -2.005 -0.218 0.206 - - - 2.31e-03 -3.48e-04 3.41e-04 68.410 57
CPL -0.394 -1.116 1.484 38.420 -7.624 9.915 2.17e-02 -2.17e-02 1.55e-01 61.590 56
=== 1-s peak spectral analysis ===
(Best model with acceptable fit: PL)
Model Ph_index Ph_90err_low Ph_90err_hi Epeak Epeak_90err_low Epeak_90err_hi Norm Nomr_90err_low Norm_90err_hi chi2 dof
PL -1.980 -0.478 0.436 - - - 3.23e-03 -1.05e-03 1.02e-03 52.550 57
CPL 1.002 -3.273 5.715 32.358 -12.101 -32.358 3.23e-01 -3.23e-01 3.04e+03 50.340 56
=== Fluence/Peak Flux Summary ===
Model Band1 Band2 Band3 Band4 Band5 Total
15-25 25-50 50-100 100-350 15-150 15-350 keV
Fluence PL 4.53e-08 6.13e-08 6.10e-08 1.10e-07 2.03e-07 2.77e-07 erg/cm2
90%_error_low -7.01e-09 -7.21e-09 -1.22e-08 -3.75e-08 -2.85e-08 -5.32e-08 erg/cm2
90%_error_hi 7.17e-09 7.19e-09 1.26e-08 4.89e-08 2.93e-08 6.22e-08 erg/cm2
Peak flux PL 2.11e-01 1.60e-01 8.11e-02 5.90e-02 4.79e-01 5.11e-01 ph/cm2/s
90%_error_low -7.03e-02 -4.07e-02 -3.25e-02 -3.50e-02 -1.21e-01 -1.31e-01 ph/cm2/s
90%_error_hi 7.36e-02 4.06e-02 3.49e-02 5.87e-02 1.21e-01 1.32e-01 ph/cm2/s
Fluence CPL 4.09e-08 7.28e-08 5.09e-08 1.04e-08 1.74e-07 1.75e-07 erg/cm2
90%_error_low -8.16e-09 -1.06e-08 -1.73e-08 -8.63e-09 -2.76e-08 -2.90e-08 erg/cm2
90%_error_hi 8.06e-09 1.09e-08 1.67e-08 3.54e-08 3.24e-08 4.59e-08 erg/cm2
Peak flux CPL 1.99e-01 2.10e-01 3.38e-02 3.06e-04 4.42e-01 4.42e-01 ph/cm2/s
90%_error_low -8.07e-02 N/A -3.38e-02 -3.06e-04 -1.14e-01 -1.14e-01 ph/cm2/s
90%_error_hi 8.18e-02 N/A 6.80e-02 7.10e-02 1.18e-01 1.19e-01 ph/cm2/s
======================================================================
Image
Pre-slew 15.0-350.0 keV image (Event data)
#   RAcent    DECcent   POSerr    Theta     Phi              Peak Cts       SNR   Name
  220.9165   -27.8492   0.0170    10.6095   -28.1507         0.3474018     11.332 TRIG_00342121

Foreground time interval of the image:
 -2.920   6.624 (delta_t =   9.544 [sec])
Background time interval of the image:
-239.296  -2.920 (delta_t = 236.376 [sec])
Light Curves
Note: The mask-weighted lightcurves have units of either count/det or counts/sec/det, where a det is 0.4 x 0.4 = 0.16 sq cm.
Full-time range; 1 s binning
Other quick-look light curves:
- 64 ms binning (zoomed)
- 16 ms binning (zoomed)
- 8 ms binning (zoomed)
- 2 ms binning (zoomed)
- SN=5 or 10 s binning (full-time range)
- Raw light curve
Spectra
- 64 ms binning (zoomed)
- 16 ms binning (zoomed)
- 8 ms binning (zoomed)
- 2 ms binning (zoomed)
- SN=5 or 10 s binning (full-time range)
- Raw light curve
Spectra
Notes:
- 1) The fitting includes the systematic errors.
- 2) When the burst includes telescope slew time periods, the fitting uses an average response file made from multiple 5-s response files through out the slew time plus single time preiod for the non-slew times, and weighted by the total counts in the corresponding time period using addrmf. An average response file is needed becuase a spectral fit using the pre-slew DRM will introduce some errors in both a spectral shape and a normalization if the PHA file contains a lot of the slew/post-slew time interval.
- 3) For fits to more complicated models (e.g. a power-law over a cutoff power-law), the BAT team has decided to require a chi-square improvement of more than 6 for each extra dof.
Time averaged spectrum fit using the average DRM
Power-law model
Time interval is from   -2.920 sec. to    6.624 sec.

Spectral model in power-law:
------------------------------------------------------------
Parameters  : value       lower 90%   higher 90%
Photon index: -2.00539     ( -0.218288   0.206298 )
Norm@50keV  : 2.30738E-03    ( -0.000347606   0.000341427 )
------------------------------------------------------------
#Fit statistic : Chi-Squared =          68.41 using 59 PHA bins.
# Reduced chi-squared =          1.200 for     57 degrees of freedom
# Null hypothesis probability =   1.432287e-01

Photon flux (15-150 keV)    in 9.544 sec: 0.346994 ( -0.040131  0.040132 ) ph/cm2/s
Energy fluence (15-150 keV)             : 2.03176e-07 ( -2.84685e-08  2.92642e-08 ) ergs/cm2
Cutoff power-law model
Time interval is from   -2.920 sec. to    6.624 sec.
Spectral model in the cutoff power-law:
------------------------------------------------------------
Parameters  : value       lower 90%   higher 90%
Photon index: -0.393526     ( -1.11703   1.48351 )
Epeak [keV] : 38.4201      ( -7.62275 9.91661 )
Norm@50keV  : 2.16593E-02    ( -0.0216884   0.154552 )
------------------------------------------------------------
#Fit statistic : Chi-Squared =          61.59 using 59 PHA bins.
# Reduced chi-squared =          1.100 for     56 degrees of freedom
# Null hypothesis probability =   2.830214e-01

Photon flux (15-150 keV)    in 9.544 sec: 0.329618 ( -0.04101  0.041301 ) ph/cm2/s
Energy fluence (15-150 keV)             : 1.73552e-07 ( -2.75594e-08  3.23974e-08 ) ergs/cm2
1-s peak spectrum fit
Power-law model
Time interval is from    4.080 sec. to    5.080 sec.

Spectral model in power-law:
------------------------------------------------------------
Parameters  : value       lower 90%   higher 90%
Photon index: -1.9798     ( -0.478599   0.436086 )
Norm@50keV  : 3.22511E-03    ( -0.00105012   0.00102182 )
------------------------------------------------------------
#Fit statistic : Chi-Squared =          52.55 using 59 PHA bins.
# Reduced chi-squared =         0.9219 for     57 degrees of freedom
# Null hypothesis probability =   6.426421e-01

Photon flux (15-150 keV)    in 1 sec: 0.479361 ( -0.121128  0.121129 ) ph/cm2/s
Energy fluence (15-150 keV)             : 2.97201e-08 ( -8.89678e-09  9.46491e-09 ) ergs/cm2
Cutoff power-law model
Time interval is from    4.080 sec. to    5.080 sec.
Spectral model in the cutoff power-law:
------------------------------------------------------------
Parameters  : value       lower 90%   higher 90%
Photon index: 1.00168     ( -3.31664   5.67078 )
Epeak [keV] : 32.3582      ( -12.0331 -32.2907 )
Norm@50keV  : 0.323216    ( -0.392821   3035.86 )
------------------------------------------------------------
#Fit statistic : Chi-Squared =          50.34 using 59 PHA bins.
# Reduced chi-squared =         0.8990 for     56 degrees of freedom
# Null hypothesis probability =   6.879205e-01

Photon flux (15-150 keV)    in 1 sec: 0.442324 ( -0.11446  0.118464 ) ph/cm2/s
Energy fluence (15-150 keV)             : 2.10809e-08 ( -6.0692e-09  1.27747e-08 ) ergs/cm2
Time-resolved spectra
Distribution
T90 vs. Hardness ratio plot
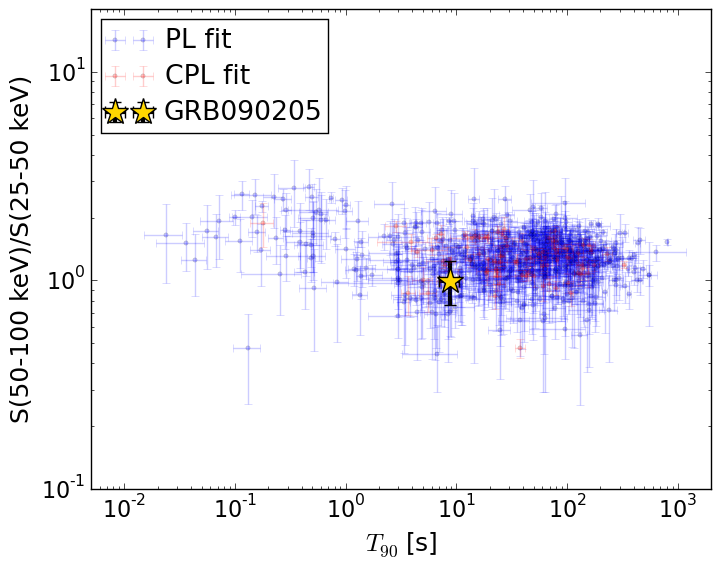
T90                                   = 8.812 sec.
Hardness ratio (energy fluence ratio) = 0.996299643498
S(15-50 keV) vs. S(50-150 keV) plot
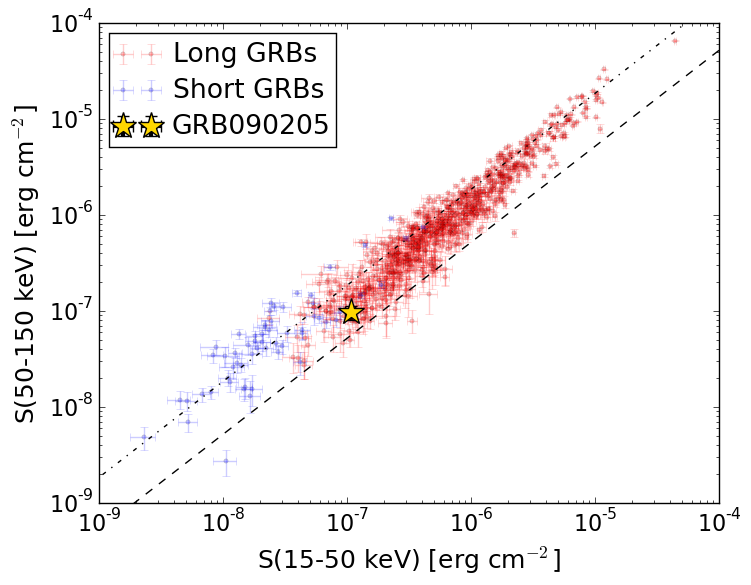
S(15-50 keV)  = 1.0655232e-07
S(50-150 keV) = 9.662307e-08
The dash-dotted line and the dashed line traces the fluences calculated from the Band function with Epeak = 15 and 150 keV, respectively. Both lines assume a canonical values of alpha = -1 and beta = -2.5.
Mask shadow pattern
IMX = 1.651591959193517E-01, IMY = 8.837470254186201E-02
Spacecraft aspect plot
Bright source in the pre-burst/pre-slew/post-slew images
Pre-burst image of 15-350 keV band
Time interval of the image:
-239.296000 -2.920000

# RAcent  DECcent POSerr Theta    Phi  PeakCts   SNR AngSep     Name
#  [deg]    [deg]    ['] [deg]  [deg]                   [']
170.2797 -60.5372    6.6  56.1    0.6   1.7050   1.7    5.3	Cen X-3
186.8535 -62.8233    5.2  51.2   -7.5   1.0728   2.2    6.3	GX 301-2
244.9670 -15.6373    0.3  23.4 -116.9   9.1958  41.4    0.7	Sco X-1
255.9805 -37.7941    1.8  37.2  -75.8   3.0398   6.4    3.0	4U 1700-377
256.4624 -36.3036   14.1  37.0  -78.3   0.3825   0.8    7.3	GX 349+2
263.1632 -24.8185   36.9  40.3  -98.2   0.2970   0.3    9.5	GX 1+4
196.4051 -26.3488    3.0  24.2   37.2   0.7688   3.8 ------	UNKNOWN
167.5647 -59.6132    3.0  56.9    2.3   3.8744   3.8 ------	UNKNOWN
221.7988 -22.4933    2.1   5.4  -38.7   0.9725   5.6 ------	UNKNOWN
250.4023  10.6094    3.0  40.6 -157.8   1.0367   3.9 ------	UNKNOWN
254.7683 -29.6631    2.5  33.6  -88.5   1.6575   4.6 ------	UNKNOWN
Pre-slew background subtracted image of 15-350 keV band
Time interval of the image:
-2.920000 6.624000

# RAcent  DECcent POSerr Theta    Phi  PeakCts   SNR AngSep     Name
#  [deg]    [deg]    ['] [deg]  [deg]                   [']
170.3808 -60.6216    4.1  56.1    0.5  -0.4436  -2.8    1.9	Cen X-3
186.7226 -62.6324   26.4  51.1   -7.3  -0.0343  -0.4    8.5	GX 301-2
244.9716 -15.4864    7.0  23.5 -117.3  -0.0629  -1.6    9.2	Sco X-1
256.0712 -37.8905    3.6  37.3  -75.7  -0.2475  -3.2    4.9	4U 1700-377
256.6043 -36.4096    2.9  37.1  -78.2  -0.2995  -3.9    8.2	GX 349+2
262.8754 -24.8359    4.9  40.0  -98.2   0.2826   2.3    9.1	GX 1+4
199.2786   4.0488    2.2  29.9  106.9   0.2609   5.2 ------	UNKNOWN
220.9165 -27.8492    1.0  10.6  -28.2   0.3475  11.3 ------	UNKNOWN
254.3822   5.9580    2.5  40.7 -148.4   0.2306   4.7 ------	UNKNOWN
227.8518 -65.6710    2.8  48.7  -30.5   0.3070   4.2 ------	UNKNOWN
Post-slew image of 15-350 keV band
Time interval of the image:
71.404590 962.775200

# RAcent  DECcent POSerr Theta    Phi  PeakCts   SNR AngSep     Name
#  [deg]    [deg]    ['] [deg]  [deg]                   [']
170.1857 -60.8082    5.6  47.1   13.3  -2.9303  -2.1   11.8	Cen X-3
186.7585 -62.7192    7.6  41.3    5.2   1.5554   1.5    4.2	GX 301-2
244.9709 -15.6459    0.2  25.4 -131.5  40.3182  62.5    0.6	Sco X-1
255.9982 -37.8216    0.8  30.9  -79.9  12.8250  14.2    1.5	4U 1700-377
256.3423 -36.4486    2.7  31.0  -82.6   4.0202   4.3    4.7	GX 349+2
263.1342 -24.6335   51.6  37.8 -102.7   0.3767   0.2    9.6	GX 1+4
264.6194 -44.4804    6.3  38.4  -70.2   2.6731   1.9    5.6	4U 1735-44
262.9114 -33.9073    5.3  36.3  -87.5   3.5469   2.2    5.8	GX 354-0
194.9534 -33.8193    3.4  23.0   50.8   2.3720   3.4 ------	UNKNOWN
225.7527  26.7976    3.9  54.9  167.6  12.0272   3.0 ------	UNKNOWN