Analysis Summary
Notes:
- 1) No attempt has been made to eliminate the non-significant decimal places.
- 2) This batgrbproduct analysis is done using the HEASARC data.
- 3) This batgrbproduct analysis is using the flight position for the mask-weighting calculation.
======================================================================
                  BAT GRB EVENT DATA PROCESSING REPORT
    Process Script Ver: batgrbproduct v2.46
    Process Start Time: Sun Jan 19 18:43:56 EST 2014
             Host Name: batevent1
   Current Working Dir: /local/data/batevent/batevent_reproc/trigger344582
======================================================================

  Trigger: 00344582      Segment: 000

  BAT Trigger Time: 257583359.68   [s; MET]
      Trigger Stop: 257583360.704   [s; MET]
               UTC: 2009-03-01T06:55:55.141940    [includes UTCF correction]
       Where From?: TDRSS position message

  BAT
    RA: 338.14040286168   Dec: 26.6421673055728  [deg; J2000]

     Catalogged Source?: NO
     Point Source?:      YES
     GRB Indicated?:     YES    [ by BAT flight software ]
     Image S/N Ratio:    21.68
     Image Trigger?:     NO
     Rate S/N Ratio:     95.3362470417207  [ if not an image trigger ]
     Image S/N Ratio:    21.68

  Analysis Position:   [ source = BAT ]
    RA: 338.14040286168   Dec: 26.6421673055728  [deg; J2000]

  Refined Position:   [ source = BAT pre-slew burst ]
    RA: 338.142401385022   Dec: 26.6387709636245  [deg; J2000]
        { 22h 32m 34.2s , +26d 38' 19.6" }
         +/- 0.587742640300044 [arcmin] (estimated 90% radius based on SNR)
         +/- 0.201897216184284 [arcmin] (formal 1-sigma fit error)
    SNR: 64.9906606878297

  Angular difference between the analysis and refined position is 0.230248 arcmin

  Partial Coding Fraction: 0.3554688    [ including projection effects ]

  Duration
     T90: 41.3720000088215 +/- 2.13565542319992
        Measured from: -1.80400002002716
                   to: 39.5679999887943     [s; relative to TRIGTIME]
     T50: 19.9240000247955 +/- 0.21203773941758
        Measured from: 5.16799998283386
                   to: 25.0920000076294     [s; relative to TRIGTIME]


  Fluence
     Peak Flux  (peak 1 second)
        Measured from: 23.0679999887943
                   to: 24.0679999887943     [s; relative to TRIGTIME]
     Total Fluence
        Measured from: -17.9120000004768
                   to: 72.2240000069141     [s; relative to TRIGTIME]

             Band 1     Band 2     Band 3     Band 4
              15-25      25-50     50-100    100-350     keV
 Total     6.481978  11.189694  11.226112   4.094841
           0.095828   0.109864   0.108158   0.090299 [error]
 Peak      0.445632   0.761654   0.782279   0.320955
           0.016758   0.021562   0.022652   0.018806 [error]

     [ fluence units of on-axis counts / fully illuminated detector ]

======================================================================


====== Table of the duration information =============================

        Value   tstart    tstop
T100   90.136  -17.912   72.224
T90    41.372   -1.804   39.568
T50    19.924    5.168   25.092
Peak    1.000   23.068   24.068


====== Spectral Analysis Summary =====================================

Model      : spectral model: simple power-law (PL) and cutoff power-law (CPL)
Ph_index   : photon index: E^{Ph_index}
Ph_90err   : 90% error of the photon index
Epeak      : Epeak in keV
Epeak_90err: 90% error of Epeak
Norm       : normalization at 50 keV in both the PL model and CPL model
Nomr_90err : 90% error of the normalization
chi2       : Chi-Squared
dof        : degree of freedo

=== Time-averaged spectral analysis ===
(Best model with acceptable fit: PL)

Model Ph_index Ph_90err_low Ph_90err_hi  Epeak  Epeak_90err_low  Epeak_90err_hi  Norm       Nomr_90err_low    Norm_90err_hi    chi2    dof
PL      -1.160    -0.028      0.028       -           -               -         2.60e-02     -4.11e-04          4.09e-04      28.940   57
CPL     -1.103    -0.066      0.068      999.619    -999.619      -999.619      2.74e-02     -1.65e-03          1.20e-03      29.820   56


=== 1-s peak spectral analysis ===
(Best model with acceptable fit: N/A)

Model Ph_index Ph_90err_low Ph_90err_hi  Epeak  Epeak_90err_low  Epeak_90err_hi  Norm       Nomr_90err_low    Norm_90err_hi    chi2    dof
PL      -1.090     -0.060     0.060       -           -               -         1.61e-01     -5.09e-03          5.08e-03      53.150   57
CPL     -1.090     -0.055     0.066     9999.360    -9999.360      -9999.360      1.62e-01     -5.12e-03          5.01e-03      53.410   56


=== Fluence/Peak Flux Summary ===

              Model    Band1     Band2     Band3     Band4     Band5     Total
                       15-25     25-50    50-100    100-350    15-150    15-350    keV
Fluence         PL   2.18e-06  4.94e-06  8.84e-06  3.73e-05  2.41e-05  5.33e-05   erg/cm2
      90%_error_low -7.68e-08 -1.03e-07 -1.35e-07 -1.37e-06 -3.53e-07 -1.39e-06   erg/cm2
      90%_error_hi   7.81e-08  1.03e-07  1.34e-07  1.40e-06  3.54e-07  1.42e-06   erg/cm2
Peak flux       PL   1.47e-03  1.82e-02  1.80e-01  1.81e+01  9.46e-01  1.83e+01   ph/cm2/s
      90%_error_low     N/A       N/A       N/A       N/A       N/A       N/A     ph/cm2/s
      90%_error_hi      N/A       N/A       N/A       N/A       N/A       N/A     ph/cm2/s

Fluence        CPL   2.18e-06  4.94e-06  8.83e-06  3.74e-05  2.41e-05  5.31e-05   erg/cm2
      90%_error_low    N/A    -9.47e-08 -1.32e-07 -4.58e-06 -3.75e-07 -4.00e-06   erg/cm2
      90%_error_hi     N/A     1.12e-07  1.47e-07  5.66e-07  3.60e-07  7.42e-07   erg/cm2
Peak flux      CPL   4.47e+00  5.75e+00  5.41e+00  8.90e+00  1.86e+01  2.46e+01   ph/cm2/s
      90%_error_low -3.05e-01 -2.33e-01 -1.91e-01     N/A   -6.11e-01 -9.59e-01   ph/cm2/s
      90%_error_hi   3.13e-01  2.32e-01  1.90e-01     N/A    6.14e-01  7.66e-01   ph/cm2/s

======================================================================
Image
Pre-slew 15.0-350.0 keV image (Event data)
#   RAcent    DECcent   POSerr    Theta     Phi              Peak Cts       SNR   Name
  338.1424    26.6388   0.0030    35.3095   -61.9225        33.7913383     64.991 TRIG_00344582

Foreground time interval of the image:
-17.912  62.021 (delta_t =  79.933 [sec])
Background time interval of the image:
-852.379 -751.626 (delta_t = 100.753 [sec])
-239.680 -32.240 (delta_t = 207.440 [sec])
-30.680 -17.912 (delta_t =  12.768 [sec])
Light Curves
Note: The mask-weighted lightcurves have units of either count/det or counts/sec/det, where a det is 0.4 x 0.4 = 0.16 sq cm.
Full-time range; 1 s binning
Other quick-look light curves:
- 64 ms binning (zoomed)
- 16 ms binning (zoomed)
- 8 ms binning (zoomed)
- 2 ms binning (zoomed)
- SN=5 or 10 s binning (full-time range)
- Raw light curve
Spectra
- 64 ms binning (zoomed)
- 16 ms binning (zoomed)
- 8 ms binning (zoomed)
- 2 ms binning (zoomed)
- SN=5 or 10 s binning (full-time range)
- Raw light curve
Spectra
Notes:
- 1) The fitting includes the systematic errors.
- 2) When the burst includes telescope slew time periods, the fitting uses an average response file made from multiple 5-s response files through out the slew time plus single time preiod for the non-slew times, and weighted by the total counts in the corresponding time period using addrmf. An average response file is needed becuase a spectral fit using the pre-slew DRM will introduce some errors in both a spectral shape and a normalization if the PHA file contains a lot of the slew/post-slew time interval.
- 3) For fits to more complicated models (e.g. a power-law over a cutoff power-law), the BAT team has decided to require a chi-square improvement of more than 6 for each extra dof.
Time averaged spectrum fit using the average DRM
Power-law model
Time interval is from  -17.912 sec. to   72.224 sec.

Spectral model in power-law:
------------------------------------------------------------
Parameters  : value       lower 90%   higher 90%
Photon index: -1.16042     ( -0.0281885   0.0282893 )
Norm@50keV  : 2.60302E-02    ( -0.000410704   0.000409392 )
------------------------------------------------------------
#Fit statistic : Chi-Squared =          28.94 using 59 PHA bins.
# Reduced chi-squared =         0.5077 for     57 degrees of freedom
# Null hypothesis probability =   9.992812e-01

Photon flux (15-150 keV)    in 90.14 sec: 3.03950 ( -0.0528  0.05303 ) ph/cm2/s
Energy fluence (15-150 keV)             : 2.40817e-05 ( -3.53361e-07  3.5358e-07 ) ergs/cm2
Cutoff power-law model
Time interval is from  -17.912 sec. to   72.224 sec.
Spectral model in the cutoff power-law:
------------------------------------------------------------
Parameters  : value       lower 90%   higher 90%
Photon index: -1.155     ( -0.0127992   0.12095 )
Epeak [keV] : 9999.20      ( -9999.2 -9999.2 )
Norm@50keV  : 2.61587E-02    ( -0.000387876   0.00247062 )
------------------------------------------------------------
#Fit statistic : Chi-Squared =          28.95 using 59 PHA bins.
# Reduced chi-squared =         0.5171 for     56 degrees of freedom
# Null hypothesis probability =   9.989625e-01

Photon flux (15-150 keV)    in 90.14 sec: 1.05524 ( -0.098628  0.137 ) ph/cm2/s
Energy fluence (15-150 keV)             : 2.4084e-05 ( -3.7473e-07  3.60331e-07 ) ergs/cm2
1-s peak spectrum fit
Power-law model
Time interval is from   23.068 sec. to   24.068 sec.

Spectral model in power-law:
------------------------------------------------------------
Parameters  : value       lower 90%   higher 90%
Photon index: -1.0896     ( -0.0599131   0.0601893 )
Norm@50keV  : 0.160880    ( -0.00508904   0.00508092 )
------------------------------------------------------------
#Fit statistic : Chi-Squared =          53.15 using 59 PHA bins.
# Reduced chi-squared =         0.9325 for     57 degrees of freedom
# Null hypothesis probability =   6.200923e-01

Photon flux (15-150 keV)    in 1 sec: 0.945847 (    ) ph/cm2/s
Energy fluence (15-150 keV)             : 1.68784e-06 ( -5.83939e-08  5.8545e-08 ) ergs/cm2
Cutoff power-law model

Time interval is from   23.068 sec. to   24.068 sec.
Spectral model in the cutoff power-law:
------------------------------------------------------------
Parameters  : value       lower 90%   higher 90%
Photon index: -1.08449     ( -0.0555535   0.0659423 )
Epeak [keV] : 1.00000E+04      ( -10000 -10000 )
Norm@50keV  : 0.161751    ( -0.0050674   0.00506023 )
------------------------------------------------------------
#Fit statistic : Chi-Squared =          53.38 using 59 PHA bins.
# Reduced chi-squared =         0.9533 for     56 degrees of freedom
# Null hypothesis probability =   5.745257e-01

Photon flux (15-150 keV)    in 1 sec: 18.6374 ( -0.6112  0.6135 ) ph/cm2/s
Energy fluence (15-150 keV)             : 0 ( 0  0 ) ergs/cm2
Time-resolved spectra
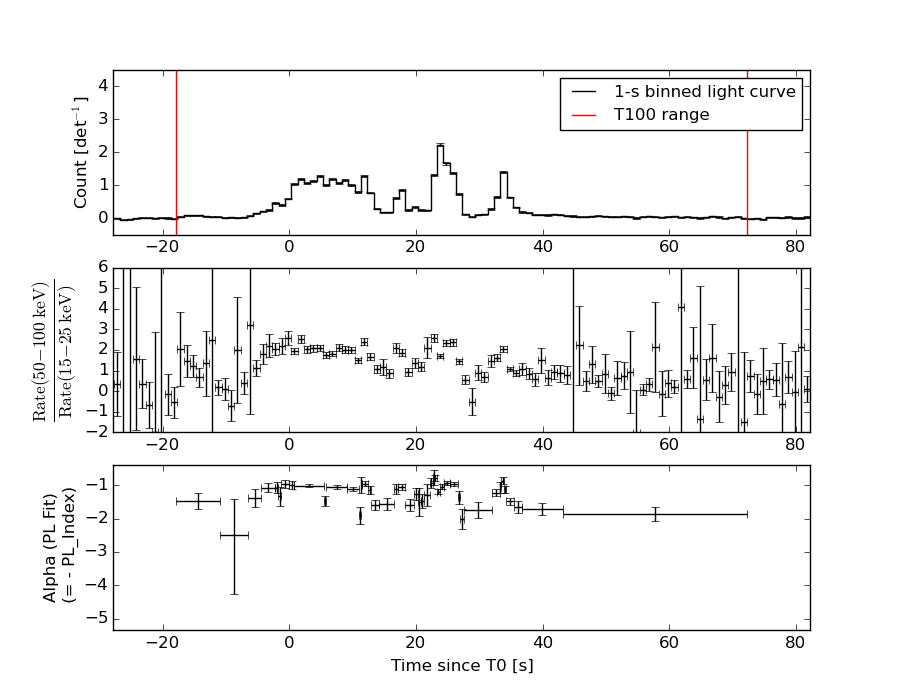
Distribution
T90 vs. Hardness ratio plot
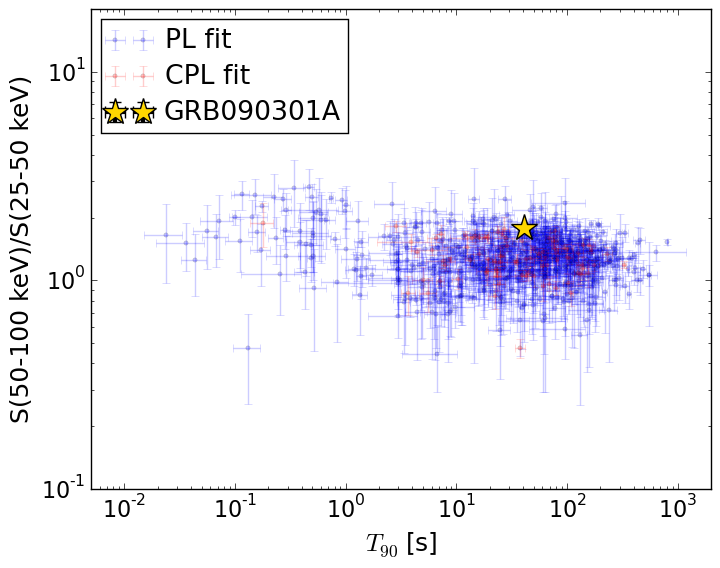
T90                                   = 41.372 sec.
Hardness ratio (energy fluence ratio) = 1.7895753529
S(15-50 keV) vs. S(50-150 keV) plot
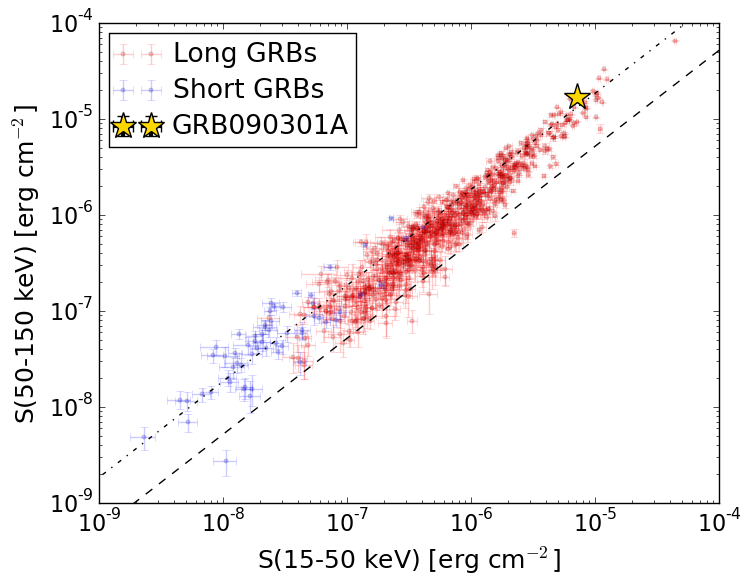
S(15-50 keV)  = 7.120355e-06
S(50-150 keV) = 1.6961654e-05
The dash-dotted line and the dashed line traces the fluences calculated from the Band function with Epeak = 15 and 150 keV, respectively. Both lines assume a canonical values of alpha = -1 and beta = -2.5.
Mask shadow pattern
IMX = 3.333670761331051E-01, IMY = 6.249313085092625E-01
Spacecraft aspect plot
Bright source in the pre-burst/pre-slew/post-slew images
Pre-burst image of 15-350 keV band
Time interval of the image:
-852.379410 -751.626300
-239.680000 -32.240000
-30.680000 -17.912000

# RAcent  DECcent POSerr Theta    Phi  PeakCts   SNR AngSep     Name
#  [deg]    [deg]    ['] [deg]  [deg]                   [']
308.0974  40.9564    2.6  52.0  -27.5   2.7134   4.5    0.6	Cyg X-3
326.1696  38.3304  147.3  39.8  -37.6  -0.0270  -0.1    0.5	Cyg X-2
284.2822  74.4954    2.6  53.5   17.2   5.1513   4.4 ------	UNKNOWN
 46.3315  -8.0134    3.0  54.0 -179.0   2.8132   3.9 ------	UNKNOWN
 47.7178 -10.7624    2.6  57.1 -179.0   5.7548   4.5 ------	UNKNOWN
 10.9445  -1.3094    2.5  40.9 -132.7   2.0616   4.7 ------	UNKNOWN
Pre-slew background subtracted image of 15-350 keV band
Time interval of the image:
-17.912000 62.020620

# RAcent  DECcent POSerr Theta    Phi  PeakCts   SNR AngSep     Name
#  [deg]    [deg]    ['] [deg]  [deg]                   [']
308.1104  40.9523   25.2  52.0  -27.5   0.4398   0.5    0.0	Cyg X-3
326.1752  38.3281    9.3  39.8  -37.6   0.5710   1.2    0.4	Cyg X-2
 55.7002  49.7321    3.3  28.6   92.4   0.9878   3.5 ------	UNKNOWN
 48.3945  -8.8128    4.2  55.7  179.2   2.9351   2.7 ------	UNKNOWN
 22.9349   8.8580    2.8  30.6 -153.2   1.1660   4.1 ------	UNKNOWN
 19.6921  -2.1126    3.1  41.3 -146.1   1.7476   3.7 ------	UNKNOWN
338.1424  26.6388    0.2  35.3  -61.9  33.7862  65.0 ------	UNKNOWN
Post-slew image of 15-350 keV band
Time interval of the image:
151.220600 961.920600

# RAcent  DECcent POSerr Theta    Phi  PeakCts   SNR AngSep     Name
#  [deg]    [deg]    ['] [deg]  [deg]                   [']
 83.6348  22.0106    0.2  40.9 -179.4  33.9935  47.2    0.2	Crab
126.5255  59.3439    2.5   9.6   46.3   2.1301   4.6 ------	UNKNOWN
 80.7427  16.2908    2.4  47.2 -178.3   4.3366   4.8 ------	UNKNOWN
301.8168  78.5655    3.2  42.0  -38.7   3.0955   3.6 ------	UNKNOWN
 52.6174  19.7904    5.2  55.4 -145.2   5.9193   2.3 ------	UNKNOWN