Analysis Summary
Notes:
- 1) No attempt has been made to eliminate the non-significant decimal places.
- 2) This batgrbproduct analysis is done using the HEASARC data.
- 3) This batgrbproduct analysis is using the flight position for the mask-weighting calculation.
======================================================================
BAT GRB EVENT DATA PROCESSING REPORT
Process Script Ver: batgrbproduct v2.46
Process Start Time: Sun Jan 19 18:18:51 EST 2014
Host Name: batevent1
Current Working Dir: /local/data/batevent/batevent_reproc/trigger346386
======================================================================
Trigger: 00346386 Segment: 000
BAT Trigger Time: 258627992 [s; MET]
Trigger Stop: 258628056 [s; MET]
UTC: 2009-03-13T09:06:27.429120 [includes UTCF correction]
Where From?: TDRSS position message
BAT
RA: 198.396961251434 Dec: 8.10658701409268 [deg; J2000]
Catalogged Source?: NO
Point Source?: YES
GRB Indicated?: YES [ by BAT flight software ]
Image S/N Ratio: 7.12
Image Trigger?: YES
Rate S/N Ratio: 0 [ if not an image trigger ]
Image S/N Ratio: 7.12
Analysis Position: [ source = BAT ]
RA: 198.396961251434 Dec: 8.10658701409268 [deg; J2000]
Refined Position: [ source = BAT pre-slew burst ]
RA: 198.400524805022 Dec: 8.0867899356897 [deg; J2000]
{ 13h 13m 36.1s , +08d 05' 12.4" }
+/- 2.14658730696382 [arcmin] (estimated 90% radius based on SNR)
+/- 0.923630156814283 [arcmin] (formal 1-sigma fit error)
SNR: 10.2139063134631
Angular difference between the analysis and refined position is 1.206539 arcmin
Partial Coding Fraction: 0.1523438 [ including projection effects ]
Duration
T90: 83.039999961853 +/- 19.4835232932372
Measured from: -16.2639999985695
to: 66.7759999632835 [s; relative to TRIGTIME]
T50: 38.9759999513626 +/- 12.0077308652368
Measured from: 1.81600001454353
to: 40.7919999659061 [s; relative to TRIGTIME]
Fluence
Peak Flux (peak 1 second)
Measured from: 4.86000001430511
to: 5.86000001430511 [s; relative to TRIGTIME]
Total Fluence
Measured from: -21.2560000121593
to: 74.8079999983311 [s; relative to TRIGTIME]
Band 1 Band 2 Band 3 Band 4
15-25 25-50 50-100 100-350 keV
Total 0.990800 0.895882 0.692329 0.206577
0.130682 0.130822 0.114997 0.101544 [error]
Peak 0.027280 0.035034 0.016027 0.033504
0.013906 0.013887 0.011553 0.011006 [error]
[ fluence units of on-axis counts / fully illuminated detector ]
======================================================================
====== Table of the duration information =============================
Value tstart tstop
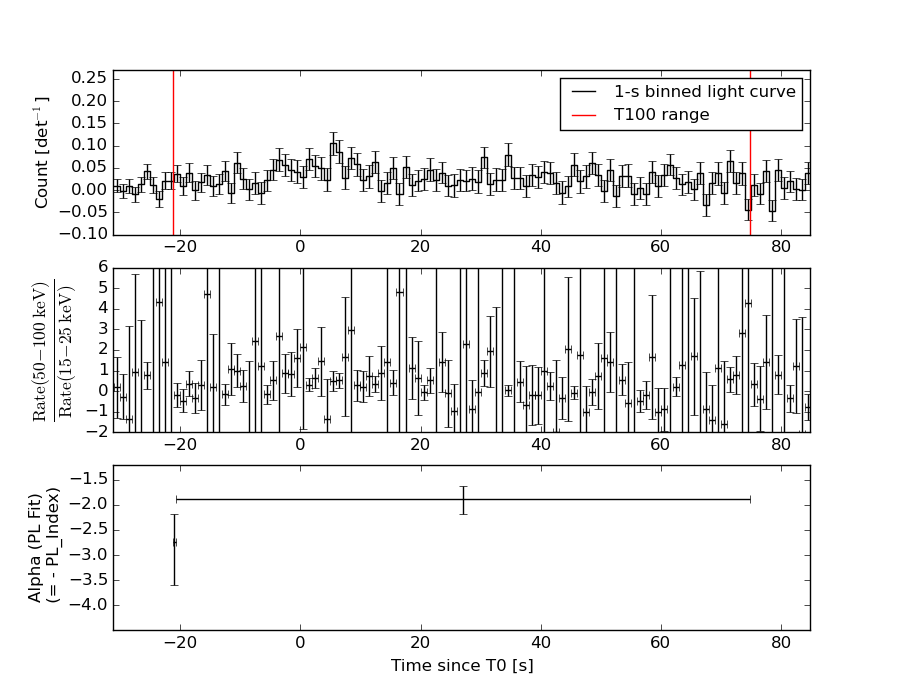
T100 96.064 -21.256 74.808
T90 83.040 -16.264 66.776
T50 38.976 1.816 40.792
Peak 1.000 4.860 5.860
====== Spectral Analysis Summary =====================================
Model : spectral model: simple power-law (PL) and cutoff power-law (CPL)
Ph_index : photon index: E^{Ph_index}
Ph_90err : 90% error of the photon index
Epeak : Epeak in keV
Epeak_90err: 90% error of Epeak
Norm : normalization at 50 keV in both the PL model and CPL model
Nomr_90err : 90% error of the normalization
chi2 : Chi-Squared
dof : degree of freedo
=== Time-averaged spectral analysis ===
(Best model with acceptable fit: PL)
Model Ph_index Ph_90err_low Ph_90err_hi Epeak Epeak_90err_low Epeak_90err_hi Norm Nomr_90err_low Norm_90err_hi chi2 dof
PL -1.899 -0.288 0.269 - - - 1.71e-03 -3.01e-04 2.89e-04 57.090 57
CPL -1.903 -0.409 0.911 9999.280 N/A N/A 1.70e-03 N/A N/A 57.090 56
=== 1-s peak spectral analysis ===
(Best model with acceptable fit: N/A)
Model Ph_index Ph_90err_low Ph_90err_hi Epeak Epeak_90err_low Epeak_90err_hi Norm Nomr_90err_low Norm_90err_hi chi2 dof
PL -1.456 -0.943 1.051 - - - 6.06e-03 -2.61e-03 2.51e-03 53.110 57
CPL -1.457 1.457 1.254 9999.330 N/A N/A 6.07e-03 N/A N/A 53.110 56
=== Fluence/Peak Flux Summary ===
Model Band1 Band2 Band3 Band4 Band5 Total
15-25 25-50 50-100 100-350 15-150 15-350 keV
Fluence PL 3.05e-07 4.40e-07 4.72e-07 9.42e-07 1.51e-06 2.16e-06 erg/cm2
90%_error_low -6.42e-08 -6.23e-08 -1.13e-07 -3.89e-07 -2.55e-07 -5.18e-07 erg/cm2
90%_error_hi 6.69e-08 6.22e-08 1.14e-07 5.37e-07 2.61e-07 6.32e-07 erg/cm2
Peak flux PL 2.39e-01 2.47e-01 1.80e-01 2.11e-01 7.47e-01 8.77e-01 ph/cm2/s
90%_error_low -1.82e-01 -1.40e-01 -9.97e-02 -2.11e-01 -7.47e-01 -3.63e-01 ph/cm2/s
90%_error_hi 2.31e-01 1.18e-01 8.87e-02 4.11e-01 3.38e-01 3.64e-01 ph/cm2/s
Fluence CPL 3.04e-07 4.18e-07 4.49e-07 1.05e-06 1.47e-06 2.22e-06 erg/cm2
90%_error_low -7.94e-08 -1.07e-07 -7.27e-08 -7.16e-07 -3.62e-07 -2.13e-06 erg/cm2
90%_error_hi 6.23e-08 7.60e-08 7.05e-08 1.48e-07 2.35e-07 3.32e-07 erg/cm2
Peak flux CPL 2.04e-01 1.24e-01 5.02e-02 3.30e-02 3.92e-01 4.13e-01 ph/cm2/s
90%_error_low -2.04e-01 N/A N/A N/A -3.92e-01 -4.13e-01 ph/cm2/s
90%_error_hi 2.65e-01 N/A N/A N/A 4.70e-01 5.64e-01 ph/cm2/s
======================================================================
Image
Pre-slew 15.0-350.0 keV image (Event data)
#   RAcent    DECcent   POSerr    Theta     Phi              Peak Cts       SNR   Name
  198.4005     8.0868   0.0189    36.0053    97.4801         2.5604129     10.214 TRIG_00346386

Foreground time interval of the image:
 -9.699  74.808 (delta_t =  84.507 [sec])
Background time interval of the image:
Light Curves
Note: The mask-weighted lightcurves have units of either count/det or counts/sec/det, where a det is 0.4 x 0.4 = 0.16 sq cm.
Full-time range; 1 s binning
Other quick-look light curves:
- 64 ms binning (zoomed)
- 16 ms binning (zoomed)
- 8 ms binning (zoomed)
- 2 ms binning (zoomed)
- SN=5 or 10 s binning (full-time range)
- Raw light curve
Spectra
- 64 ms binning (zoomed)
- 16 ms binning (zoomed)
- 8 ms binning (zoomed)
- 2 ms binning (zoomed)
- SN=5 or 10 s binning (full-time range)
- Raw light curve
Spectra
Notes:
- 1) The fitting includes the systematic errors.
- 2) When the burst includes telescope slew time periods, the fitting uses an average response file made from multiple 5-s response files through out the slew time plus single time preiod for the non-slew times, and weighted by the total counts in the corresponding time period using addrmf. An average response file is needed becuase a spectral fit using the pre-slew DRM will introduce some errors in both a spectral shape and a normalization if the PHA file contains a lot of the slew/post-slew time interval.
- 3) For fits to more complicated models (e.g. a power-law over a cutoff power-law), the BAT team has decided to require a chi-square improvement of more than 6 for each extra dof.
Time averaged spectrum fit using the average DRM
Power-law model
Time interval is from  -21.256 sec. to   74.808 sec.

Spectral model in power-law:
------------------------------------------------------------
Parameters  : value       lower 90%   higher 90%
Photon index: -1.8987     ( -0.288473   0.268844 )
Norm@50keV  : 1.70815E-03    ( -0.000300979   0.000289378 )
------------------------------------------------------------
#Fit statistic : Chi-Squared =          57.09 using 59 PHA bins.
# Reduced chi-squared =          1.002 for     57 degrees of freedom
# Null hypothesis probability =   4.717076e-01

Photon flux (15-150 keV)    in 96.06 sec: 0.245017 ( -0.034949  0.034978 ) ph/cm2/s
Energy fluence (15-150 keV)             : 1.50877e-06 ( -2.54896e-07  2.60661e-07 ) ergs/cm2
Cutoff power-law model

Time interval is from  -21.256 sec. to   74.808 sec.
Spectral model in the cutoff power-law:
------------------------------------------------------------
Parameters  : value       lower 90%   higher 90%
Photon index: -2.21168     ( -0.100588   1.21906 )
Epeak [keV] : 85.5365      (   )
Norm@50keV  : 1.17979E-03    (     )
------------------------------------------------------------
#Fit statistic : Chi-Squared =          57.06 using 59 PHA bins.
# Reduced chi-squared =          1.019 for     56 degrees of freedom
# Null hypothesis probability =   4.356268e-01

Photon flux (15-150 keV)    in 96.06 sec: 0.235752 ( -0.060496  0.044192 ) ph/cm2/s
Energy fluence (15-150 keV)             : 1.46569e-06 ( -3.61506e-07  2.34791e-07 ) ergs/cm2
1-s peak spectrum fit
Power-law model
Time interval is from    4.860 sec. to    5.860 sec.

Spectral model in power-law:
------------------------------------------------------------
Parameters  : value       lower 90%   higher 90%
Photon index: -1.4556     ( -0.944236   1.05044 )
Norm@50keV  : 6.05799E-03    ( -0.00261396   0.00250643 )
------------------------------------------------------------
#Fit statistic : Chi-Squared =          53.11 using 59 PHA bins.
# Reduced chi-squared =         0.9318 for     57 degrees of freedom
# Null hypothesis probability =   6.217629e-01

Photon flux (15-150 keV)    in 1 sec: 0.747437 ( -0.747437  0.337573 ) ph/cm2/s
Energy fluence (15-150 keV)             : 5.79322e-08 ( -2.60814e-08  2.62383e-08 ) ergs/cm2
Cutoff power-law model
Time interval is from    4.860 sec. to    5.860 sec.
Spectral model in the cutoff power-law:
------------------------------------------------------------
Parameters  : value       lower 90%   higher 90%
Photon index: -2.40839     ( 2.4094   2.20641 )
Epeak [keV] : 141.192      (   )
Norm@50keV  : 1.93501E-03    (     )
------------------------------------------------------------
#Fit statistic : Chi-Squared =          52.19 using 59 PHA bins.
# Reduced chi-squared =         0.9320 for     56 degrees of freedom
# Null hypothesis probability =   6.198031e-01

Photon flux (15-150 keV)    in 1 sec: 0.392419 ( -0.392419  0.470452 ) ph/cm2/s
Energy fluence (15-150 keV)             : 0 ( 0  0 ) ergs/cm2
Time-resolved spectra
Distribution
T90 vs. Hardness ratio plot
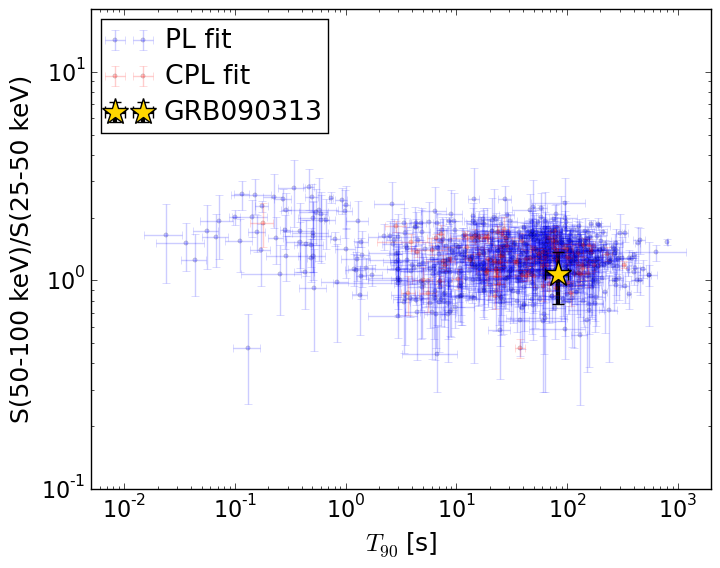
T90                                   = 83.04 sec.
Hardness ratio (energy fluence ratio) = 1.07275385431
S(15-50 keV) vs. S(50-150 keV) plot
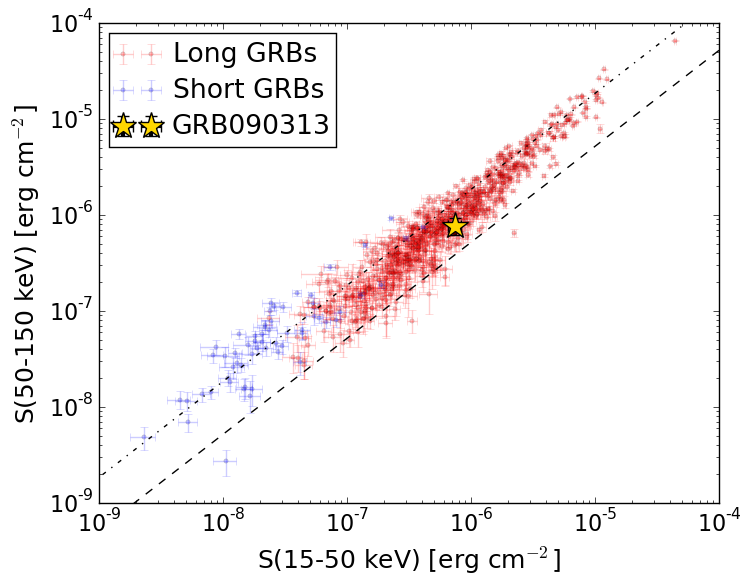
S(15-50 keV)  = 7.449863e-07
S(50-150 keV) = 7.637823e-07
The dash-dotted line and the dashed line traces the fluences calculated from the Band function with Epeak = 15 and 150 keV, respectively. Both lines assume a canonical values of alpha = -1 and beta = -2.5.
Mask shadow pattern
IMX = -9.460073011165211E-02, IMY = -7.205011896212690E-01
Spacecraft aspect plot
Bright source in the pre-burst/pre-slew/post-slew images
Pre-burst image of 15-350 keV band
Time interval of the image:
Pre-slew background subtracted image of 15-350 keV band
Time interval of the image:
-9.699400 74.808000

# RAcent  DECcent POSerr Theta    Phi  PeakCts   SNR AngSep     Name
#  [deg]    [deg]    ['] [deg]  [deg]                   [']
244.9848 -15.6623    0.5  16.1  -72.7   2.4355  25.5    1.4	Sco X-1
254.5196  35.3298    3.8  47.7 -170.8   0.5450   3.0    3.1	Her X-1
255.9784 -37.8462    1.9  38.2  -49.0   1.0140   6.1    0.4	4U 1700-377
256.3917 -36.4851    3.6  37.4  -51.0   0.4987   3.2    4.3	GX 349+2
262.8197 -24.8588    0.0  35.1  -72.5  -0.1570  -0.9   12.3	GX 1+4
264.5482 -44.4742    4.8  47.4  -48.9   0.9393   2.4    8.5	4U 1735-44
268.4271  -1.4664    4.8  37.5 -113.4   0.4974   2.4    3.6	SW J1753.5-0127
270.0996 -25.1912    0.0  41.3  -76.0   0.3636   0.9   12.1	GX 5-1
270.2513 -25.7777   10.8  41.7  -75.2   0.4343   1.1    3.5	GRS 1758-258
262.9125 -33.7351    3.1  39.7  -59.9   0.8030   3.8    7.1	GX 354-0
198.4005   8.0868    1.1  36.0   97.5   2.5608  10.2 ------	UNKNOWN
272.1389 -14.6201    2.6  40.9  -92.4   1.7715   4.4 ------	UNKNOWN
Post-slew image of 15-350 keV band
Time interval of the image:
819.400600 963.050000

# RAcent  DECcent POSerr Theta    Phi  PeakCts   SNR AngSep     Name
#  [deg]    [deg]    ['] [deg]  [deg]                   [']
244.9620 -15.6517    0.5  25.7   99.1   4.9699  23.6    1.2	Sco X-1
255.9832 -37.8865    1.8  17.2   32.4   0.8917   6.3    2.5	4U 1700-377
256.3573 -36.4621    6.2  16.0   35.6   0.2647   1.8    4.4	GX 349+2
262.9785 -24.8853    4.8   6.7   86.8   0.3318   2.4    8.5	GX 1+4
264.6621 -44.5579   11.3  19.4    3.2   0.1391   1.0    7.3	4U 1735-44
268.3531  -1.4571    2.4  24.4  166.2   0.7189   4.8    0.9	SW J1753.5-0127
270.1179 -25.0711    9.9   0.7  156.1   0.1534   1.2    9.1	GX 5-1
270.2153 -25.7215    3.5   0.1   98.9   0.4526   3.4    4.9	GRS 1758-258
273.9176 -14.0570    1.9  12.2 -172.3   0.8601   6.2    5.3	GX 17+2
275.9910 -30.3609    3.9   6.8  -55.1   0.3992   3.0    3.4	H1820-303
285.0368 -25.0246    5.7  13.3  -99.0   0.2894   2.0    6.2	HT1900.1-2455
288.8199  10.9611    1.6  40.9 -160.7   1.6478   7.1    1.6	GRS 1915+105
262.9960 -33.8360    3.7  10.3   27.3   0.4230   3.1    0.4	GX 354-0
251.1284   8.8568    2.5  39.3  140.1   1.4142   4.6 ------	UNKNOWN
255.6770 -48.7717    1.9  25.7   13.5   0.8635   5.9 ------	UNKNOWN
278.1312  29.3673    2.5  55.6  179.2   2.8180   4.6 ------	UNKNOWN
290.1810 -16.0831    3.2  20.9 -122.7   0.5387   3.7 ------	UNKNOWN
297.1774  25.4053    3.4  57.4 -160.1   2.6366   3.4 ------	UNKNOWN
313.9427 -16.5419    3.0  41.5 -103.0   2.6895   3.8 ------	UNKNOWN