Analysis Summary
Notes:
- 1) No attempt has been made to eliminate the non-significant decimal places.
- 2) This batgrbproduct analysis is done using the HEASARC data.
- 3) This batgrbproduct analysis is using the flight position for the mask-weighting calculation.
======================================================================
                  BAT GRB EVENT DATA PROCESSING REPORT
    Process Script Ver: batgrbproduct v2.46
    Process Start Time: Sun Jan 19 18:14:05 EST 2014
             Host Name: batevent1
   Current Working Dir: /local/data/batevent/batevent_reproc/trigger348152
======================================================================

  Trigger: 00348152      Segment: 000

  BAT Trigger Time: 260267729.488   [s; MET]
      Trigger Stop: 260267729.552   [s; MET]
               UTC: 2009-04-01T08:35:24.865740    [includes UTCF correction]
       Where From?: (*SHORT BURST*) TDRSS scaled map message

  BAT
    RA: 95.1007140995549   Dec: -8.96344268717607  [deg; J2000]

     Catalogged Source?: NO
     Point Source?:      YES
     GRB Indicated?:     YES    [ by BAT flight software ]
     Image S/N Ratio:    10.13
     Image Trigger?:     NO
     Rate S/N Ratio:     41.4004830889689  [ if not an image trigger ]
     Image S/N Ratio:    10.13

  Analysis Position:   [ source = BAT ]
    RA: 95.1007140995549   Dec: -8.96344268717607  [deg; J2000]

  Refined Position:   [ source = BAT pre-slew burst ]
    RA: 95.0923448292395   Dec: -8.96199624560372  [deg; J2000]
        { 06h 20m 22.2s , -08d 57' 43.2" }
         +/- 0.451450374098827 [arcmin] (estimated 90% radius based on SNR)
         +/- 0.119859333618321 [arcmin] (formal 1-sigma fit error)
    SNR: 94.7398387192817

  Angular difference between the analysis and refined position is 0.503560 arcmin

  Partial Coding Fraction: 0.671875    [ including projection effects ]

  Duration
     T90: 186.504000008106 +/- 39.5070207762022
        Measured from: 0.739999979734421
                   to: 187.243999987841     [s; relative to TRIGTIME]
     T50: 7.70800000429153 +/- 1.99776677446814
        Measured from: 6.78799998760223
                   to: 14.4959999918938     [s; relative to TRIGTIME]


  Fluence
     Peak Flux  (peak 1 second)
        Measured from: 6.49199998378754
                   to: 7.49199998378754     [s; relative to TRIGTIME]
     Total Fluence
        Measured from: -0.140000015497208
                   to: 326.136000007391     [s; relative to TRIGTIME]

             Band 1     Band 2     Band 3     Band 4
              15-25      25-50     50-100    100-350     keV
 Total     3.977640   5.477200   5.145296   1.607182
           0.096987   0.103242   0.096073   0.090995 [error]
 Peak      0.393198   0.885792   1.222564   0.490684
           0.012105   0.017203   0.020541   0.017062 [error]

     [ fluence units of on-axis counts / fully illuminated detector ]

======================================================================


====== Table of the duration information =============================

        Value   tstart    tstop
T100  326.276   -0.140  326.136
T90   186.504    0.740  187.244
T50     7.708    6.788   14.496
Peak    1.000    6.492    7.492


====== Spectral Analysis Summary =====================================

Model      : spectral model: simple power-law (PL) and cutoff power-law (CPL)
Ph_index   : photon index: E^{Ph_index}
Ph_90err   : 90% error of the photon index
Epeak      : Epeak in keV
Epeak_90err: 90% error of Epeak
Norm       : normalization at 50 keV in both the PL model and CPL model
Nomr_90err : 90% error of the normalization
chi2       : Chi-Squared
dof        : degree of freedo

=== Time-averaged spectral analysis ===
(Best model with acceptable fit: PL)

Model Ph_index Ph_90err_low Ph_90err_hi  Epeak  Epeak_90err_low  Epeak_90err_hi  Norm       Nomr_90err_low    Norm_90err_hi    chi2    dof
PL      -1.288    -0.046      0.046       -           -               -         3.31e-03     -7.59e-05          7.58e-05      63.690   57
CPL     -1.287    -0.043      0.049     9999.360    -9999.360      -9999.360      3.32e-03     -7.06e-05          3.00e-04      63.820   56


=== 1-s peak spectral analysis ===
(Best model with acceptable fit: CPL)

Model Ph_index Ph_90err_low Ph_90err_hi  Epeak  Epeak_90err_low  Epeak_90err_hi  Norm       Nomr_90err_low    Norm_90err_hi    chi2    dof
PL      -0.743     -0.039     0.039       -           -               -         1.99e-01     -4.57e-03          4.56e-03      72.490   57
CPL     -0.469     -0.162     0.168      353.482    -108.942       389.818      2.57e-01     -3.51e-02          4.20e-02      64.010   56


=== Fluence/Peak Flux Summary ===

              Model    Band1     Band2     Band3     Band4     Band5     Total
                       15-25     25-50    50-100    100-350    15-150    15-350    keV
Fluence         PL   1.13e-06  2.36e-06  3.87e-06  1.43e-05  1.07e-05  2.17e-05   erg/cm2
      90%_error_low -5.76e-08 -6.89e-08 -1.02e-07 -9.03e-07 -2.54e-07 -9.39e-07   erg/cm2
      90%_error_hi   5.89e-08  6.87e-08  1.01e-07  9.46e-07  2.55e-07  9.74e-07   erg/cm2
Peak flux       PL   3.99e+00  6.33e+00  7.56e+00  1.76e+01  2.30e+01  3.55e+01   ph/cm2/s
      90%_error_low -1.97e-01 -1.91e-01 -1.67e-01 -8.54e-01 -5.09e-01 -9.08e-01   ph/cm2/s
      90%_error_hi   2.01e-01  1.91e-01  1.67e-01  8.82e-01  5.10e-01  9.20e-01   ph/cm2/s

Fluence        CPL   1.13e-06  2.36e-06  3.83e-06  1.47e-05  1.07e-05  2.15e-05   erg/cm2
      90%_error_low    N/A    -6.66e-08 -6.17e-08 -2.10e-06 -2.83e-07 -1.58e-06   erg/cm2
      90%_error_hi     N/A     7.10e-08  1.41e-07  -1.39e-08  2.25e-07  7.55e-07   erg/cm2
Peak flux      CPL   3.65e+00  6.35e+00  7.84e+00  1.38e+01  2.28e+01  3.16e+01   ph/cm2/s
      90%_error_low -2.68e-01 -1.97e-01 -2.31e-01 -1.80e+00 -5.22e-01 -1.87e+00   ph/cm2/s
      90%_error_hi   2.75e-01  1.97e-01  2.33e-01  2.15e+00  5.22e-01  2.19e+00   ph/cm2/s

======================================================================
Image
Pre-slew 15.0-350.0 keV image (Event data)
#   RAcent    DECcent   POSerr    Theta     Phi              Peak Cts       SNR   Name
   95.0923    -8.9620   0.0020    33.1437     3.8649        10.6201444     94.740 TRIG_00348152

Foreground time interval of the image:
 -0.140   9.413 (delta_t =   9.553 [sec])
Background time interval of the image:
-239.488  -0.140 (delta_t = 239.348 [sec])
Light Curves
Note: The mask-weighted lightcurves have units of either count/det or counts/sec/det, where a det is 0.4 x 0.4 = 0.16 sq cm.
Full-time range; 1 s binning
Other quick-look light curves:
- 64 ms binning (zoomed)
- 16 ms binning (zoomed)
- 8 ms binning (zoomed)
- 2 ms binning (zoomed)
- SN=5 or 10 s binning (full-time range)
- Raw light curve
Spectra
- 64 ms binning (zoomed)
- 16 ms binning (zoomed)
- 8 ms binning (zoomed)
- 2 ms binning (zoomed)
- SN=5 or 10 s binning (full-time range)
- Raw light curve
Spectra
Notes:
- 1) The fitting includes the systematic errors.
- 2) When the burst includes telescope slew time periods, the fitting uses an average response file made from multiple 5-s response files through out the slew time plus single time preiod for the non-slew times, and weighted by the total counts in the corresponding time period using addrmf. An average response file is needed becuase a spectral fit using the pre-slew DRM will introduce some errors in both a spectral shape and a normalization if the PHA file contains a lot of the slew/post-slew time interval.
- 3) For fits to more complicated models (e.g. a power-law over a cutoff power-law), the BAT team has decided to require a chi-square improvement of more than 6 for each extra dof.
Time averaged spectrum fit using the average DRM
Power-law model

Time interval is from   -0.140 sec. to  326.136 sec.

Spectral model in power-law:
------------------------------------------------------------
Parameters  : value       lower 90%   higher 90%
Photon index: -1.28784     ( -0.0455382   0.0456424 )
Norm@50keV  : 3.30618E-03    ( -7.58519e-05   7.57632e-05 )
------------------------------------------------------------
#Fit statistic : Chi-Squared =          63.69 using 59 PHA bins.
# Reduced chi-squared =          1.117 for     57 degrees of freedom
# Null hypothesis probability =   2.527831e-01

Photon flux (15-150 keV)    in 326.3 sec: 0.393570 ( -0.010036  0.010106 ) ph/cm2/s
Energy fluence (15-150 keV)             : 1.06937e-05 ( -2.5423e-07  2.54895e-07 ) ergs/cm2
Cutoff power-law model
Time interval is from   -0.140 sec. to  326.136 sec.
Spectral model in the cutoff power-law:
------------------------------------------------------------
Parameters  : value       lower 90%   higher 90%
Photon index: -1.28651     ( -0.0438368   0.0483875 )
Epeak [keV] : 9999.36      ( -9999.36 -9999.36 )
Norm@50keV  : 3.31550E-03    ( -7.55833e-05   0.000295015 )
------------------------------------------------------------
#Fit statistic : Chi-Squared =          63.82 using 59 PHA bins.
# Reduced chi-squared =          1.140 for     56 degrees of freedom
# Null hypothesis probability =   2.209032e-01

Photon flux (15-150 keV)    in 326.3 sec: 0.393434 ( -0.010052  0.010092 ) ph/cm2/s
Energy fluence (15-150 keV)             : 1.07198e-05 ( -2.83491e-07  2.25481e-07 ) ergs/cm2
1-s peak spectrum fit
Power-law model
Time interval is from    6.492 sec. to    7.492 sec.

Spectral model in power-law:
------------------------------------------------------------
Parameters  : value       lower 90%   higher 90%
Photon index: -0.74332     ( -0.0388378   0.0390962 )
Norm@50keV  : 0.199274    ( -0.00457439   0.00456205 )
------------------------------------------------------------
#Fit statistic : Chi-Squared =          72.49 using 59 PHA bins.
# Reduced chi-squared =          1.272 for     57 degrees of freedom
# Null hypothesis probability =   8.101370e-02

Photon flux (15-150 keV)    in 1 sec: 22.9648 ( -0.5094  0.5097 ) ph/cm2/s
Energy fluence (15-150 keV)             : 2.38627e-06 ( -5.51749e-08  5.51922e-08 ) ergs/cm2
Cutoff power-law model
Time interval is from    6.492 sec. to    7.492 sec.
Spectral model in the cutoff power-law:
------------------------------------------------------------
Parameters  : value       lower 90%   higher 90%
Photon index: -0.469115     ( -0.161994   0.167957 )
Epeak [keV] : 353.482      ( -108.943 389.817 )
Norm@50keV  : 0.256933    ( -0.0351093   0.0419725 )
------------------------------------------------------------
#Fit statistic : Chi-Squared =          64.01 using 59 PHA bins.
# Reduced chi-squared =          1.143 for     56 degrees of freedom
# Null hypothesis probability =   2.159743e-01

Photon flux (15-150 keV)    in 1 sec: 22.7578 ( -0.5216  0.5222 ) ph/cm2/s
Energy fluence (15-150 keV)             : 2.37268e-06 ( -5.6459e-08  5.63898e-08 ) ergs/cm2
Time-resolved spectra
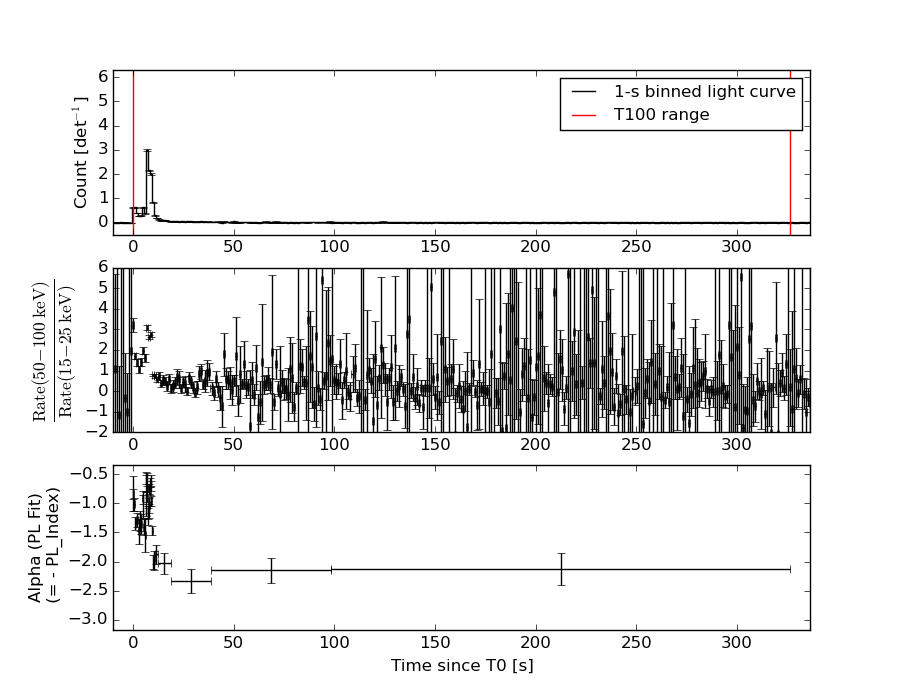
Distribution
T90 vs. Hardness ratio plot
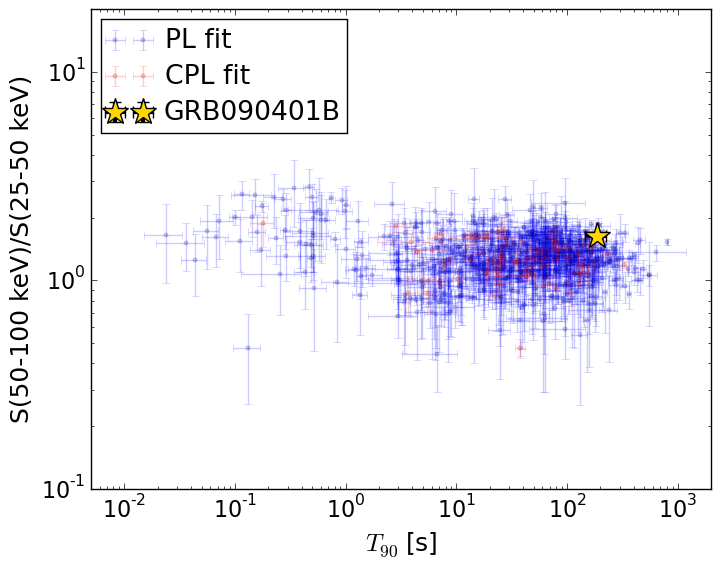
T90                                   = 186.504 sec.
Hardness ratio (energy fluence ratio) = 1.63828631547
S(15-50 keV) vs. S(50-150 keV) plot
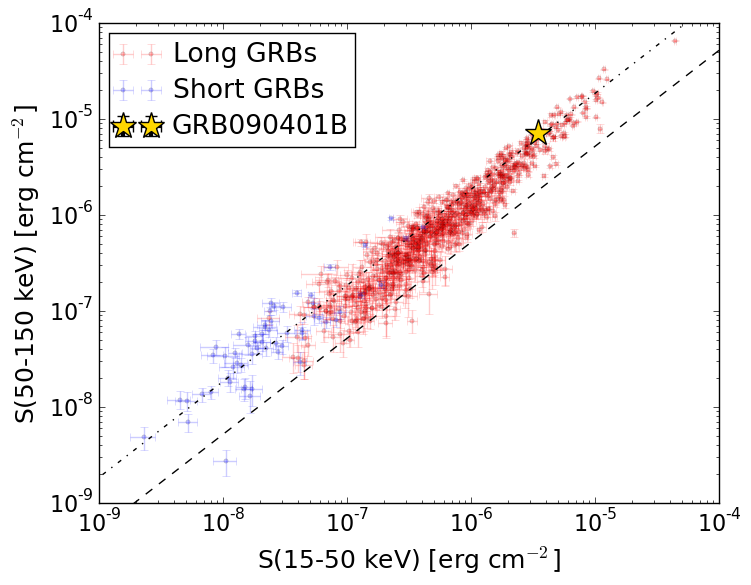
S(15-50 keV)  = 3.493443e-06
S(50-150 keV) = 7.200295e-06
The dash-dotted line and the dashed line traces the fluences calculated from the Band function with Epeak = 15 and 150 keV, respectively. Both lines assume a canonical values of alpha = -1 and beta = -2.5.
Mask shadow pattern
IMX = 6.514938543516368E-01, IMY = -4.401298218217560E-02
Spacecraft aspect plot
Bright source in the pre-burst/pre-slew/post-slew images
Pre-burst image of 15-350 keV band
Time interval of the image:
-239.488000 -0.140000

# RAcent  DECcent POSerr Theta    Phi  PeakCts   SNR AngSep     Name
#  [deg]    [deg]    ['] [deg]  [deg]                   [']
135.5397 -40.4832    3.2  33.5   98.8   1.4320   3.6    4.3	Vela X-1
118.1907 -16.1626    2.3  34.9   46.7   1.6212   4.9 ------	UNKNOWN
 94.5195 -47.6405    2.1   6.4  151.5   0.8794   5.5 ------	UNKNOWN
307.5708 -77.7434    2.4  58.3 -175.6   5.5786   4.7 ------	UNKNOWN
 28.0554 -45.3677    2.8  44.3 -121.0   3.0174   4.1 ------	UNKNOWN
Pre-slew background subtracted image of 15-350 keV band
Time interval of the image:
-0.140000 9.412600

# RAcent  DECcent POSerr Theta    Phi  PeakCts   SNR AngSep     Name
#  [deg]    [deg]    ['] [deg]  [deg]                   [']
135.3190 -40.5206    4.7  33.3   98.7  -0.5006  -2.5    9.8	Vela X-1
121.6680 -28.0923    2.1  28.7   67.1   0.8213   5.4 ------	UNKNOWN
 95.0923  -8.9620    0.1  33.1    3.9  10.6201  94.7 ------	UNKNOWN
 55.0412 -41.3793    3.2  26.4 -105.2   0.4031   3.6 ------	UNKNOWN
333.7286 -69.6842    3.9  59.4 -163.2   1.7916   3.0 ------	UNKNOWN
 54.2722 -17.8141    4.2  39.2  -67.5   0.6474   2.8 ------	UNKNOWN
Post-slew image of 15-350 keV band
Time interval of the image:
62.212600 962.561900

# RAcent  DECcent POSerr Theta    Phi  PeakCts   SNR AngSep     Name
#  [deg]    [deg]    ['] [deg]  [deg]                   [']
 83.6246  22.0198    0.2  33.0  -25.1  37.2400  61.8    0.6	Crab
117.1545 -55.1754    3.3  49.4  158.3   5.7843   3.5 ------	UNKNOWN
 95.0790  -8.9799    1.6   0.0 -149.0   4.1805   7.2 ------	UNKNOWN
 99.2073  45.5876    3.4  54.7   -1.8   6.9297   3.4 ------	UNKNOWN
 92.3966  -0.5497    3.2   8.8  -23.2   1.8354   3.6 ------	UNKNOWN
 69.3340  -6.0196    3.3  25.7  -90.6   2.3449   3.5 ------	UNKNOWN