Analysis Summary
Notes:
- 1) No attempt has been made to eliminate the non-significant decimal places.
- 2) This batgrbproduct analysis is done using the HEASARC data.
- 3) This batgrbproduct analysis is using the flight position for the mask-weighting calculation.
======================================================================
BAT GRB EVENT DATA PROCESSING REPORT
Process Script Ver: batgrbproduct v2.46
Process Start Time: Sun Jan 19 18:04:53 EST 2014
Host Name: batevent1
Current Working Dir: /local/data/batevent/batevent_reproc/trigger348650
======================================================================
Trigger: 00348650 Segment: 000
BAT Trigger Time: 260792910.272 [s; MET]
Trigger Stop: 260792912.32 [s; MET]
UTC: 2009-04-07T10:28:25.633160 [includes UTCF correction]
Where From?: TDRSS position message
BAT
RA: 68.9590365303165 Dec: -12.6649961806079 [deg; J2000]
Catalogged Source?: NO
Point Source?: YES
GRB Indicated?: YES [ by BAT flight software ]
Image S/N Ratio: 8.43
Image Trigger?: NO
Rate S/N Ratio: 12.4498995979887 [ if not an image trigger ]
Image S/N Ratio: 8.43
Analysis Position: [ source = BAT ]
RA: 68.9590365303165 Dec: -12.6649961806079 [deg; J2000]
Refined Position: [ source = BAT pre-slew burst ]
RA: 68.979911283069 Dec: -12.6854652323429 [deg; J2000]
{ 04h 35m 55.2s , -12d 41' 07.7" }
+/- 2.19545937636357 [arcmin] (estimated 90% radius based on SNR)
+/- 1.00969117691705 [arcmin] (formal 1-sigma fit error)
SNR: 9.89065249839096
Angular difference between the analysis and refined position is 1.732491 arcmin
Partial Coding Fraction: 0.84375 [ including projection effects ]
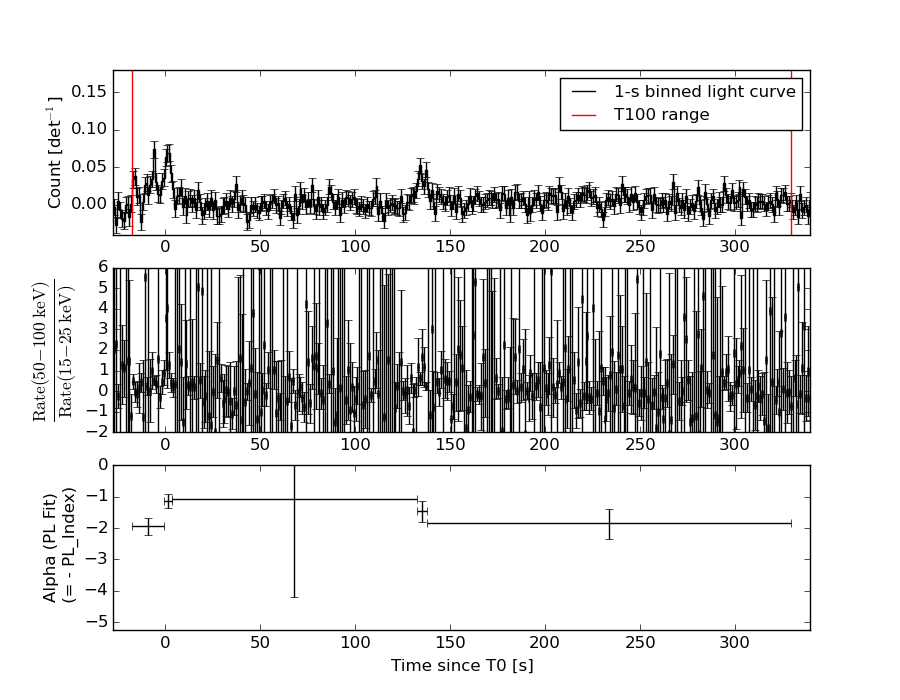
Duration
T90: 315.471999973059 +/- 55.9086580720423
Measured from: -12.0880000293255
to: 303.383999943733 [s; relative to TRIGTIME]
T50: 218.223999977112 +/- 35.2983716431233
Measured from: 1.01599997282028
to: 219.239999949932 [s; relative to TRIGTIME]
Fluence
Peak Flux (peak 1 second)
Measured from: 0.443999975919724
to: 1.44399997591972 [s; relative to TRIGTIME]
Total Fluence
Measured from: -17.688000023365
to: 329.351999998093 [s; relative to TRIGTIME]
Band 1 Band 2 Band 3 Band 4
15-25 25-50 50-100 100-350 keV
Total 0.661117 0.685909 0.514664 0.103448
0.094667 0.099397 0.091158 0.089519 [error]
Peak 0.008021 0.033290 0.027090 0.015542
0.005588 0.006148 0.005792 0.005649 [error]
[ fluence units of on-axis counts / fully illuminated detector ]
======================================================================
====== Table of the duration information =============================
Value tstart tstop
T100 347.040 -17.688 329.352
T90 315.472 -12.088 303.384
T50 218.224 1.016 219.240
Peak 1.000 0.444 1.444
====== Spectral Analysis Summary =====================================
Model : spectral model: simple power-law (PL) and cutoff power-law (CPL)
Ph_index : photon index: E^{Ph_index}
Ph_90err : 90% error of the photon index
Epeak : Epeak in keV
Epeak_90err: 90% error of Epeak
Norm : normalization at 50 keV in both the PL model and CPL model
Nomr_90err : 90% error of the normalization
chi2 : Chi-Squared
dof : degree of freedo
=== Time-averaged spectral analysis ===
(Best model with acceptable fit: PL)
Model Ph_index Ph_90err_low Ph_90err_hi Epeak Epeak_90err_low Epeak_90err_hi Norm Nomr_90err_low Norm_90err_hi chi2 dof
PL -1.647 -0.278 0.266 - - - 3.54e-04 -5.97e-05 5.79e-05 62.070 57
CPL -1.585 -1.330 0.904 309.959 -309.949 -309.959 3.83e-04 -8.77e-05 7.78e-04 62.100 56
=== 1-s peak spectral analysis ===
(Best model with acceptable fit: PL)
Model Ph_index Ph_90err_low Ph_90err_hi Epeak Epeak_90err_low Epeak_90err_hi Norm Nomr_90err_low Norm_90err_hi chi2 dof
PL -0.979 -0.366 0.400 - - - 5.71e-03 -1.22e-03 1.21e-03 57.820 57
CPL -0.976 -4.997 0.911 9999.360 N/A N/A 5.75e-03 N/A N/A 57.820 56
=== Fluence/Peak Flux Summary ===
Model Band1 Band2 Band3 Band4 Band5 Total
15-25 25-50 50-100 100-350 15-150 15-350 keV
Fluence PL 1.80e-07 3.03e-07 3.87e-07 9.92e-07 1.14e-06 1.86e-06 erg/cm2
90%_error_low -3.94e-08 -4.36e-08 -8.81e-08 -3.98e-07 -2.03e-07 -4.92e-07 erg/cm2
90%_error_hi 4.09e-08 4.36e-08 8.88e-08 5.49e-07 2.09e-07 6.19e-07 erg/cm2
Peak flux PL 1.43e-01 1.97e-01 1.99e-01 3.68e-01 6.57e-01 9.07e-01 ph/cm2/s
90%_error_low -5.91e-02 -5.41e-02 -4.53e-02 -1.54e-01 -1.41e-01 -2.03e-01 ph/cm2/s
90%_error_hi 6.81e-02 5.20e-02 4.45e-02 2.21e-01 1.42e-01 2.19e-01 ph/cm2/s
Fluence CPL 1.80e-07 3.01e-07 3.87e-07 9.89e-07 1.15e-06 1.94e-06 erg/cm2
90%_error_low N/A N/A N/A N/A -2.41e-07 -9.81e-07 erg/cm2
90%_error_hi N/A N/A N/A N/A 2.11e-07 6.62e-07 erg/cm2
Peak flux CPL 1.45e-01 1.97e-01 1.99e-01 3.71e-01 6.57e-01 9.06e-01 ph/cm2/s
90%_error_low -6.76e-02 -5.10e-02 -4.52e-02 -3.71e-01 -1.42e-01 -3.24e-01 ph/cm2/s
90%_error_hi 5.30e-02 5.70e-02 5.27e-02 2.75e-01 1.41e-01 2.01e-01 ph/cm2/s
======================================================================
Image
Pre-slew 15.0-350.0 keV image (Event data)
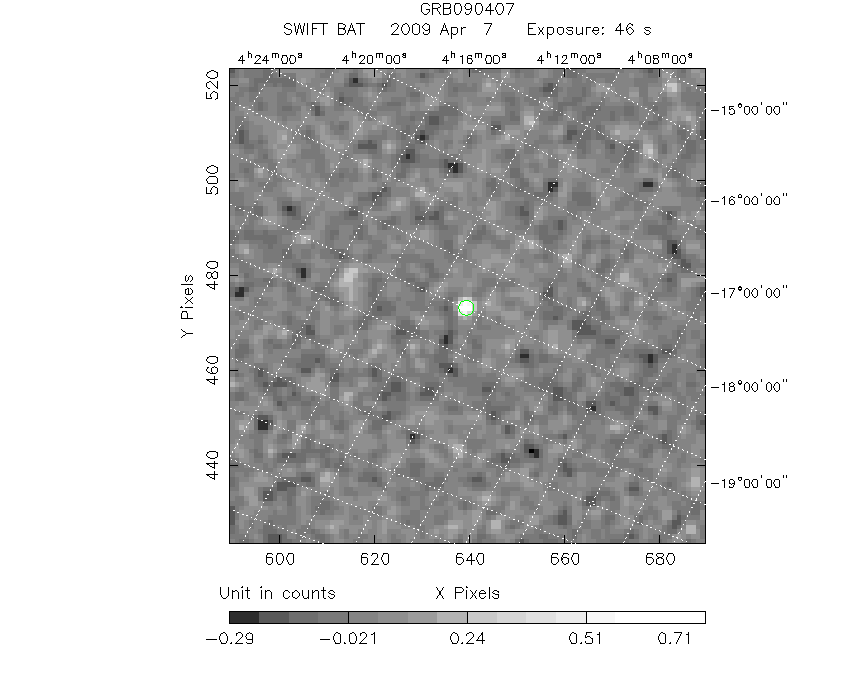
#   RAcent    DECcent   POSerr    Theta     Phi              Peak Cts       SNR   Name
   68.9799   -12.6855   0.0195    26.8002     0.8324         0.8242648      9.891 TRIG_00348650

Foreground time interval of the image:
-17.688  28.029 (delta_t =  45.717 [sec])
Background time interval of the image:
-239.272 -17.688 (delta_t = 221.584 [sec])
Light Curves
Note: The mask-weighted lightcurves have units of either count/det or counts/sec/det, where a det is 0.4 x 0.4 = 0.16 sq cm.
Full-time range; 1 s binning
Other quick-look light curves:
- 64 ms binning (zoomed)
- 16 ms binning (zoomed)
- 8 ms binning (zoomed)
- 2 ms binning (zoomed)
- SN=5 or 10 s binning (full-time range)
- Raw light curve
Spectra
- 64 ms binning (zoomed)
- 16 ms binning (zoomed)
- 8 ms binning (zoomed)
- 2 ms binning (zoomed)
- SN=5 or 10 s binning (full-time range)
- Raw light curve
Spectra
Notes:
- 1) The fitting includes the systematic errors.
- 2) When the burst includes telescope slew time periods, the fitting uses an average response file made from multiple 5-s response files through out the slew time plus single time preiod for the non-slew times, and weighted by the total counts in the corresponding time period using addrmf. An average response file is needed becuase a spectral fit using the pre-slew DRM will introduce some errors in both a spectral shape and a normalization if the PHA file contains a lot of the slew/post-slew time interval.
- 3) For fits to more complicated models (e.g. a power-law over a cutoff power-law), the BAT team has decided to require a chi-square improvement of more than 6 for each extra dof.
Time averaged spectrum fit using the average DRM
Power-law model
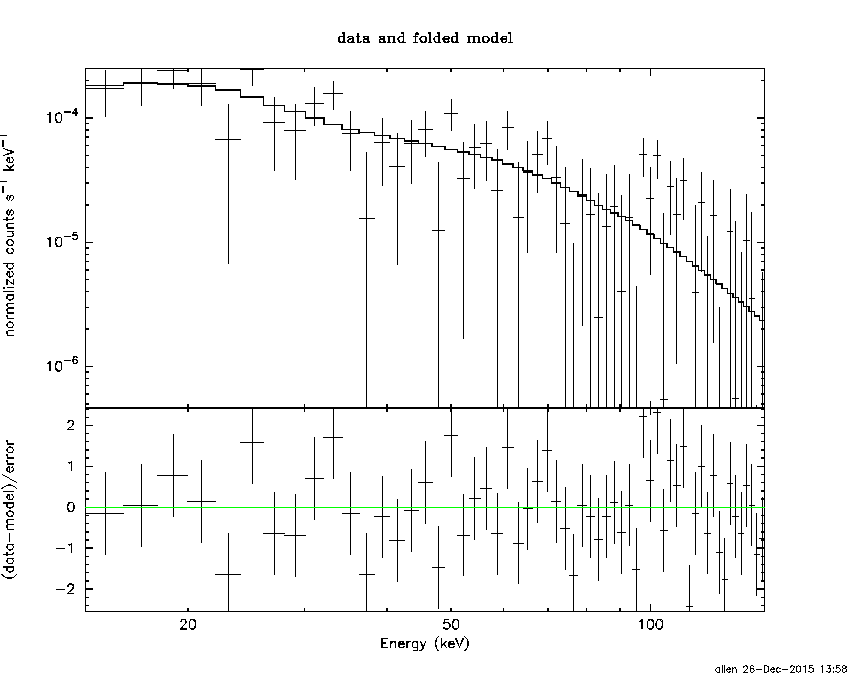
Time interval is from  -17.688 sec. to  329.352 sec.

Spectral model in power-law:
------------------------------------------------------------
Parameters  : value       lower 90%   higher 90%
Photon index: -1.64655     ( -0.277596   0.26572 )
Norm@50keV  : 3.54460E-04    ( -5.97004e-05   5.79093e-05 )
------------------------------------------------------------
#Fit statistic : Chi-Squared =          62.07 using 59 PHA bins.
# Reduced chi-squared =          1.089 for     57 degrees of freedom
# Null hypothesis probability =   3.002980e-01

Photon flux (15-150 keV)    in 347 sec: 4.62330E-02 ( -0.0066548  0.0066555 ) ph/cm2/s
Energy fluence (15-150 keV)             : 1.14448e-06 ( -2.03396e-07  2.09333e-07 ) ergs/cm2
Cutoff power-law model
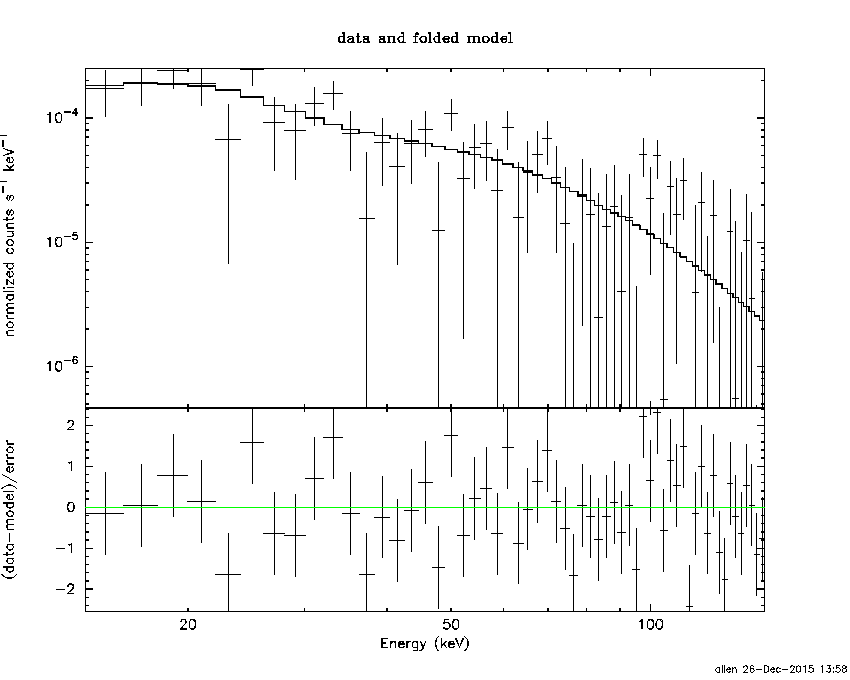
Time interval is from  -17.688 sec. to  329.352 sec.
Spectral model in the cutoff power-law:
------------------------------------------------------------
Parameters  : value       lower 90%   higher 90%
Photon index: -1.64494     ( -1.32145   0.91231 )
Epeak [keV] : 9998.34      ( -9998.7 -9998.71 )
Norm@50keV  : 3.55206E-04    ( -6.00653e-05   0.000805908 )
------------------------------------------------------------
#Fit statistic : Chi-Squared =          62.07 using 59 PHA bins.
# Reduced chi-squared =          1.108 for     56 degrees of freedom
# Null hypothesis probability =   2.687361e-01

Photon flux (15-150 keV)    in 347 sec: 4.63284E-02 ( -0.0070291  0.0066423 ) ph/cm2/s
Energy fluence (15-150 keV)             : 1.15064e-06 ( -2.40541e-07  2.10519e-07 ) ergs/cm2
1-s peak spectrum fit
Power-law model
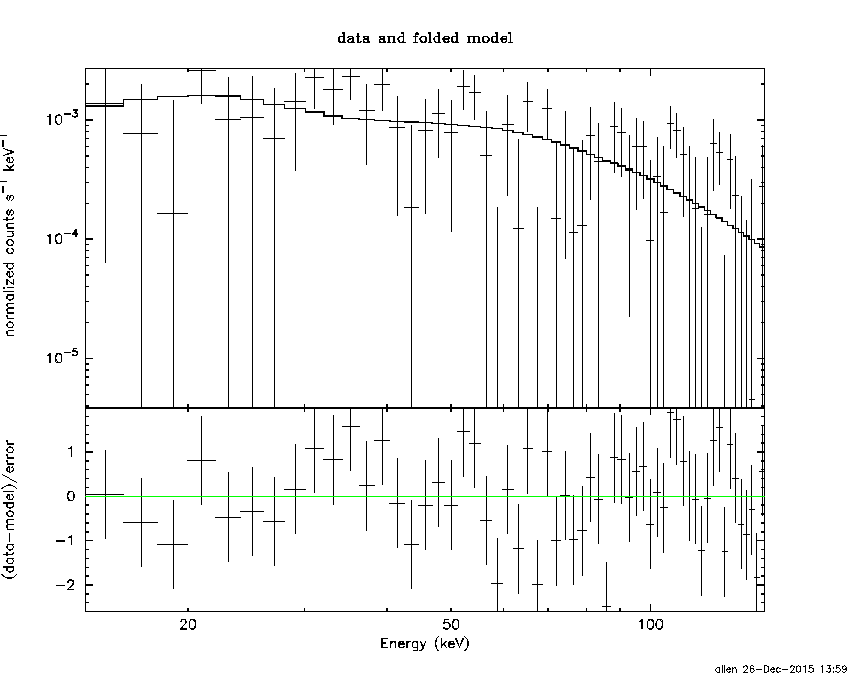
Time interval is from    0.444 sec. to    1.444 sec.

Spectral model in power-law:
------------------------------------------------------------
Parameters  : value       lower 90%   higher 90%
Photon index: -0.97901     ( -0.365757   0.400203 )
Norm@50keV  : 5.71258E-03    ( -0.00121827   0.00120587 )
------------------------------------------------------------
#Fit statistic : Chi-Squared =          57.82 using 59 PHA bins.
# Reduced chi-squared =          1.014 for     57 degrees of freedom
# Null hypothesis probability =   4.449098e-01

Photon flux (15-150 keV)    in 1 sec: 0.657019 ( -0.141317  0.142198 ) ph/cm2/s
Energy fluence (15-150 keV)             : 6.22458e-08 ( -1.40233e-08  1.41888e-08 ) ergs/cm2
Cutoff power-law model

Time interval is from    0.444 sec. to    1.444 sec.
Spectral model in the cutoff power-law:
------------------------------------------------------------
Parameters  : value       lower 90%   higher 90%
Photon index: -2.33466     ( -3.63884   2.26922 )
Epeak [keV] : 105.201      (   )
Norm@50keV  : 3.30838E-04    (     )
------------------------------------------------------------
#Fit statistic : Chi-Squared =          56.40 using 59 PHA bins.
# Reduced chi-squared =          1.007 for     56 degrees of freedom
# Null hypothesis probability =   4.597690e-01

Photon flux (15-150 keV)    in 1 sec: 0.657387 ( -0.14152  0.141165 ) ph/cm2/s
Energy fluence (15-150 keV)             : 6.23362e-08 ( -1.52515e-08  1.26947e-08 ) ergs/cm2
Time-resolved spectra
Distribution
T90 vs. Hardness ratio plot
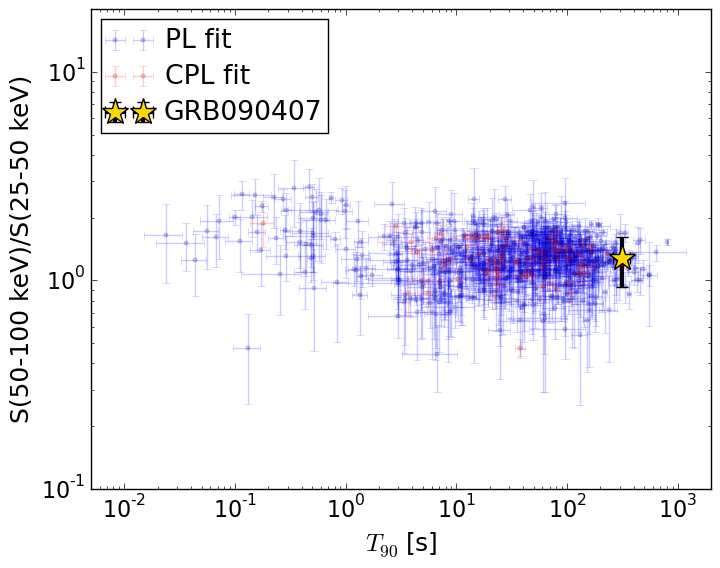
T90                                   = 315.472 sec.
Hardness ratio (energy fluence ratio) = 1.27764468475
S(15-50 keV) vs. S(50-150 keV) plot
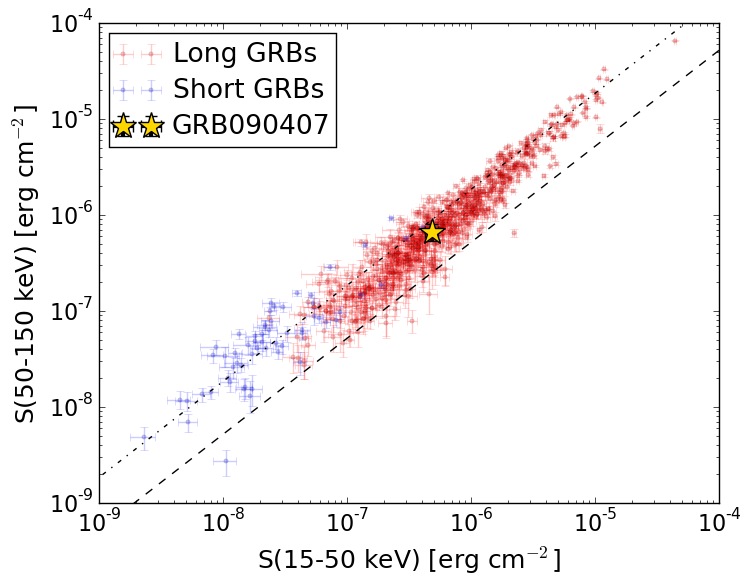
S(15-50 keV)  = 4.831143e-07
S(50-150 keV) = 6.613754e-07
The dash-dotted line and the dashed line traces the fluences calculated from the Band function with Epeak = 15 and 150 keV, respectively. Both lines assume a canonical values of alpha = -1 and beta = -2.5.
Mask shadow pattern
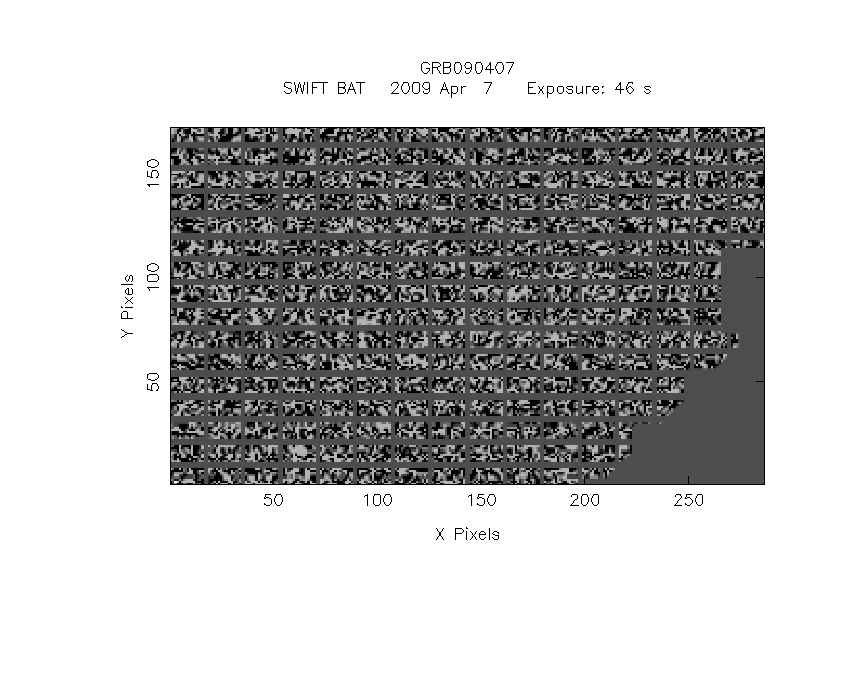
IMX = 5.050880671116625E-01, IMY = -7.338579258640548E-03
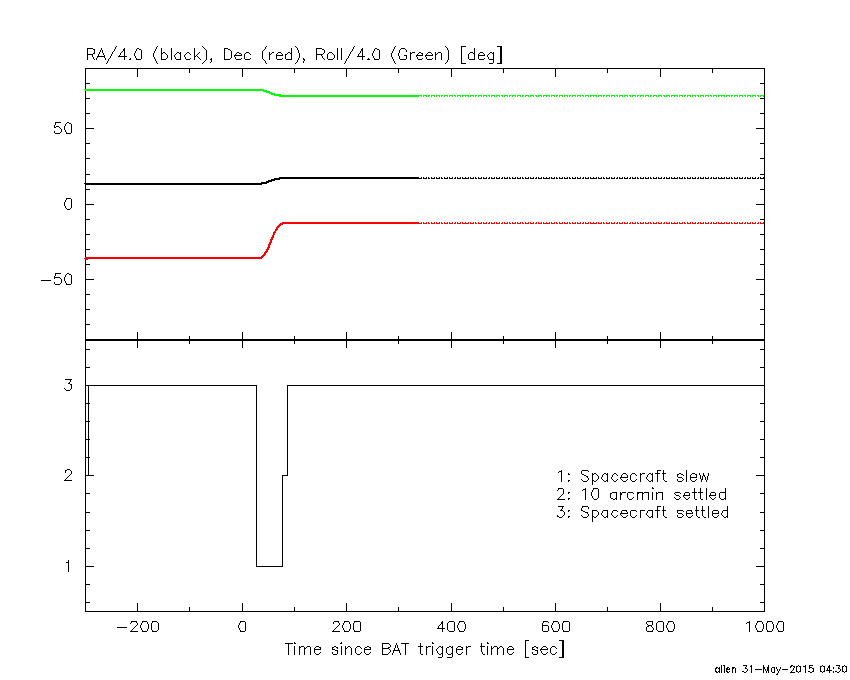
Spacecraft aspect plot
Bright source in the pre-burst/pre-slew/post-slew images
Pre-burst image of 15-350 keV band
Time interval of the image:
-239.272000 -17.688000

# RAcent  DECcent POSerr Theta    Phi  PeakCts   SNR AngSep     Name
#  [deg]    [deg]    ['] [deg]  [deg]                   [']
 92.7612 -79.7030    3.1  46.3  138.4   2.4784   3.7 ------	UNKNOWN
 93.4728 -65.1454    2.6  37.3  121.2   1.9716   4.5 ------	UNKNOWN
 92.1650 -19.7977    2.3  36.9   41.7   1.7043   5.0 ------	UNKNOWN
  3.6258 -71.5276    2.6  44.0  167.9   1.4839   4.5 ------	UNKNOWN
 47.1141 -58.3844    2.7  22.9  156.8   0.9182   4.3 ------	UNKNOWN
 54.0018 -17.5788    2.3  18.4  -33.3   0.8519   5.1 ------	UNKNOWN
Pre-slew background subtracted image of 15-350 keV band
Time interval of the image:
-17.688000 28.028590

# RAcent  DECcent POSerr Theta    Phi  PeakCts   SNR AngSep     Name
#  [deg]    [deg]    ['] [deg]  [deg]                   [']
356.0005 -64.9192    2.2  44.6  178.2   0.6541   5.3 ------	UNKNOWN
 68.9803 -12.6851    1.1  26.8    0.8   0.8573  10.3 ------	UNKNOWN
337.3791 -50.5791    2.3  55.2 -163.9   1.2418   5.1 ------	UNKNOWN
Post-slew image of 15-350 keV band
Time interval of the image:
77.228600 962.772200

# RAcent  DECcent POSerr Theta    Phi  PeakCts   SNR AngSep     Name
#  [deg]    [deg]    ['] [deg]  [deg]                   [']
 83.6364  22.0193    0.2  37.5    5.2  34.6351  46.9    0.3	Crab
100.0179 -49.7330    2.6  45.0  134.4   9.9281   4.4 ------	UNKNOWN
 87.1015 -44.4410    2.7  35.4  140.0   4.1008   4.2 ------	UNKNOWN
 89.3415 -28.0038    3.1  24.4  114.6   2.5860   3.7 ------	UNKNOWN
 90.3434  19.6755    2.2  38.6   16.0   4.0403   5.2 ------	UNKNOWN
 87.6758  38.1636    3.4  53.8    0.8   6.1229   3.4 ------	UNKNOWN
 25.8792 -60.4464    4.8  57.2 -173.8   6.8450   2.4 ------	UNKNOWN
 14.0965 -53.6568    3.5  59.4 -163.2  16.2837   3.3 ------	UNKNOWN
 40.7354  25.5157    3.4  47.0  -53.1   8.2049   3.4 ------	UNKNOWN