Analysis Summary
Notes:
- 1) No attempt has been made to eliminate the non-significant decimal places.
- 2) This batgrbproduct analysis is done using the HEASARC data.
- 3) This batgrbproduct analysis is using the flight position for the mask-weighting calculation.
======================================================================
                  BAT GRB EVENT DATA PROCESSING REPORT
    Process Script Ver: batgrbproduct v2.46
    Process Start Time: Sun Jan 19 17:53:54 EST 2014
             Host Name: batevent1
   Current Working Dir: /local/data/batevent/batevent_reproc/trigger348929
======================================================================

  Trigger: 00348929      Segment: 000

  BAT Trigger Time: 261075477.504   [s; MET]
      Trigger Stop: 261075478.528   [s; MET]
               UTC: 2009-04-10T16:57:52.856200    [includes UTCF correction]
       Where From?: TDRSS position message

  BAT
    RA: 334.979821390126   Dec: 15.4711522547987  [deg; J2000]

     Catalogged Source?: NO
     Point Source?:      YES
     GRB Indicated?:     YES    [ by BAT flight software ]
     Image S/N Ratio:    7.82
     Image Trigger?:     NO
     Rate S/N Ratio:     12.2065556157337  [ if not an image trigger ]
     Image S/N Ratio:    7.82

  Analysis Position:   [ source = BAT ]
    RA: 334.979821390126   Dec: 15.4711522547987  [deg; J2000]

  Refined Position:   [ source = BAT pre-slew burst ]
    RA: 334.958160889292   Dec: 15.4213946333319  [deg; J2000]
        { 22h 19m 50.0s , +15d 25' 17.0" }
         +/- 1.73116817149227 [arcmin] (estimated 90% radius based on SNR)
         +/- 0.59162943211542 [arcmin] (formal 1-sigma fit error)
    SNR: 13.8878086686614

  Angular difference between the analysis and refined position is 3.237620 arcmin

  Partial Coding Fraction: 1.015625    [ including projection effects ]

  Duration
     T90: 165.148000001907 +/- 7.04306410648481
        Measured from: -35.5640000104904
                   to: 129.583999991417     [s; relative to TRIGTIME]
     T50: 99.2120000123978 +/- 2.28861880219093
        Measured from: 7.75999999046326
                   to: 106.972000002861     [s; relative to TRIGTIME]


  Fluence
     Peak Flux  (peak 1 second)
        Measured from: 8.92399999499321
                   to: 9.92399999499321     [s; relative to TRIGTIME]
     Total Fluence
        Measured from: -49.2240000069141
                   to: 139.444000005722     [s; relative to TRIGTIME]

             Band 1     Band 2     Band 3     Band 4
              15-25      25-50     50-100    100-350     keV
 Total     1.805094   2.950542   2.930605   0.816166
           0.068758   0.072294   0.065223   0.055348 [error]
 Peak      0.038001   0.074839   0.114173   0.053884
           0.005364   0.006150   0.006601   0.005258 [error]

     [ fluence units of on-axis counts / fully illuminated detector ]

======================================================================


====== Table of the duration information =============================

        Value   tstart    tstop
T100  188.668  -49.224  139.444
T90   165.148  -35.564  129.584
T50    99.212    7.760  106.972
Peak    1.000    8.924    9.924


====== Spectral Analysis Summary =====================================

Model      : spectral model: simple power-law (PL) and cutoff power-law (CPL)
Ph_index   : photon index: E^{Ph_index}
Ph_90err   : 90% error of the photon index
Epeak      : Epeak in keV
Epeak_90err: 90% error of Epeak
Norm       : normalization at 50 keV in both the PL model and CPL model
Nomr_90err : 90% error of the normalization
chi2       : Chi-Squared
dof        : degree of freedo

=== Time-averaged spectral analysis ===
(Best model with acceptable fit: PL)

Model Ph_index Ph_90err_low Ph_90err_hi  Epeak  Epeak_90err_low  Epeak_90err_hi  Norm       Nomr_90err_low    Norm_90err_hi    chi2    dof
PL      -1.108    -0.051      0.051       -           -               -         2.97e-03     -8.14e-05          8.12e-05      58.050   57
CPL     -1.008    -0.120      0.205      587.200    -587.200      -587.200      3.28e-03     -2.10e-04          7.13e-04      57.320   56


=== 1-s peak spectral analysis ===
(Best model with acceptable fit: PL)

Model Ph_index Ph_90err_low Ph_90err_hi  Epeak  Epeak_90err_low  Epeak_90err_hi  Norm       Nomr_90err_low    Norm_90err_hi    chi2    dof
PL      -0.600     -0.129     0.133       -           -               -         1.66e-02     -1.30e-03          1.29e-03      68.270   57
CPL     -0.108     -0.457     0.661      249.337    -105.142      -249.337      2.58e-02     -8.95e-03          1.91e-02      66.100   56


=== Fluence/Peak Flux Summary ===

              Model    Band1     Band2     Band3     Band4     Band5     Total
                       15-25     25-50    50-100    100-350    15-150    15-350    keV
Fluence         PL   4.97e-07  1.16e-06  2.16e-06  9.62e-06  5.85e-06  1.34e-05   erg/cm2
      90%_error_low -2.93e-08 -4.02e-08 -6.46e-08 -6.79e-07 -1.67e-07 -7.05e-07   erg/cm2
      90%_error_hi   3.01e-08  4.00e-08  6.44e-08  7.16e-07  1.67e-07  7.38e-07   erg/cm2
Peak flux       PL   2.91e-01  5.03e-01  6.64e-01  1.78e+00  1.94e+00  3.24e+00   ph/cm2/s
      90%_error_low -4.79e-02 -5.23e-02 -4.80e-02 -2.74e-01 -1.41e-01 -2.87e-01   ph/cm2/s
      90%_error_hi   5.13e-02  5.19e-02  4.78e-02  3.07e-01  1.41e-01  3.04e-01   ph/cm2/s

Fluence        CPL   4.83e-07  1.17e-06  2.18e-06  8.44e-06  5.82e-06  1.23e-05   erg/cm2
      90%_error_low -3.90e-08 -4.15e-08 -7.64e-08 -1.89e-06 -1.79e-07 -1.88e-06   erg/cm2
      90%_error_hi   3.79e-08  4.16e-08  7.76e-08  1.54e-06  1.69e-07  1.45e-06   erg/cm2
Peak flux      CPL   2.45e-01  5.03e-01  7.06e-01  1.18e+00  1.91e+00  2.63e+00   ph/cm2/s
      90%_error_low -6.68e-02 -5.57e-02 -6.72e-02 -4.15e-01 -1.46e-01 -4.46e-01   ph/cm2/s
      90%_error_hi   7.18e-02  5.52e-02  6.88e-02  6.93e-01  1.45e-01  7.12e-01   ph/cm2/s

======================================================================
Image
Pre-slew 15.0-350.0 keV image (Event data)
#   RAcent    DECcent   POSerr    Theta     Phi              Peak Cts       SNR   Name
  334.9582    15.4214   0.0139     4.3758   -57.1327         9.1245321     13.888 TRIG_00348929

Foreground time interval of the image:
-49.224 139.444 (delta_t = 188.668 [sec])
Background time interval of the image:
-56.003 -49.224 (delta_t =   6.779 [sec])
Light Curves
Note: The mask-weighted lightcurves have units of either count/det or counts/sec/det, where a det is 0.4 x 0.4 = 0.16 sq cm.
Full-time range; 1 s binning
Other quick-look light curves:
- 64 ms binning (zoomed)
- 16 ms binning (zoomed)
- 8 ms binning (zoomed)
- 2 ms binning (zoomed)
- SN=5 or 10 s binning (full-time range)
- Raw light curve
Spectra
- 64 ms binning (zoomed)
- 16 ms binning (zoomed)
- 8 ms binning (zoomed)
- 2 ms binning (zoomed)
- SN=5 or 10 s binning (full-time range)
- Raw light curve
Spectra
Notes:
- 1) The fitting includes the systematic errors.
- 2) When the burst includes telescope slew time periods, the fitting uses an average response file made from multiple 5-s response files through out the slew time plus single time preiod for the non-slew times, and weighted by the total counts in the corresponding time period using addrmf. An average response file is needed becuase a spectral fit using the pre-slew DRM will introduce some errors in both a spectral shape and a normalization if the PHA file contains a lot of the slew/post-slew time interval.
- 3) For fits to more complicated models (e.g. a power-law over a cutoff power-law), the BAT team has decided to require a chi-square improvement of more than 6 for each extra dof.
Time averaged spectrum fit using the average DRM
Power-law model
Time interval is from  -49.224 sec. to  139.444 sec.

Spectral model in power-law:
------------------------------------------------------------
Parameters  : value       lower 90%   higher 90%
Photon index: -1.10782     ( -0.051019   0.0513474 )
Norm@50keV  : 2.97314E-03    ( -8.14167e-05   8.12379e-05 )
------------------------------------------------------------
#Fit statistic : Chi-Squared =          58.05 using 59 PHA bins.
# Reduced chi-squared =          1.018 for     57 degrees of freedom
# Null hypothesis probability =   4.362448e-01

Photon flux (15-150 keV)    in 188.7 sec: 0.345130 ( -0.009963  0.009984 ) ph/cm2/s
Energy fluence (15-150 keV)             : 5.85183e-06 ( -1.67075e-07  1.67272e-07 ) ergs/cm2
Cutoff power-law model
Time interval is from  -49.224 sec. to  139.444 sec.
Spectral model in the cutoff power-law:
------------------------------------------------------------
Parameters  : value       lower 90%   higher 90%
Photon index: -1.00833     ( -0.119691   0.205215 )
Epeak [keV] : 587.200      ( -587.204 -587.204 )
Norm@50keV  : 3.28004E-03    ( -0.000210299   0.000712498 )
------------------------------------------------------------
#Fit statistic : Chi-Squared =          57.32 using 59 PHA bins.
# Reduced chi-squared =          1.024 for     56 degrees of freedom
# Null hypothesis probability =   4.259435e-01

Photon flux (15-150 keV)    in 188.7 sec: 0.342957 ( -0.010799  0.00967 ) ph/cm2/s
Energy fluence (15-150 keV)             : 5.82011e-06 ( -1.78907e-07  1.69407e-07 ) ergs/cm2
1-s peak spectrum fit
Power-law model
Time interval is from    8.924 sec. to    9.924 sec.

Spectral model in power-law:
------------------------------------------------------------
Parameters  : value       lower 90%   higher 90%
Photon index: -0.599732     ( -0.128736   0.132956 )
Norm@50keV  : 1.66179E-02    ( -0.00130102   0.00128533 )
------------------------------------------------------------
#Fit statistic : Chi-Squared =          68.27 using 59 PHA bins.
# Reduced chi-squared =          1.198 for     57 degrees of freedom
# Null hypothesis probability =   1.457640e-01

Photon flux (15-150 keV)    in 1 sec: 1.94028 ( -0.14064  0.14081 ) ph/cm2/s
Energy fluence (15-150 keV)             : 2.12559e-07 ( -1.62501e-08  1.63063e-08 ) ergs/cm2
Cutoff power-law model
Time interval is from    8.924 sec. to    9.924 sec.
Spectral model in the cutoff power-law:
------------------------------------------------------------
Parameters  : value       lower 90%   higher 90%
Photon index: -0.108442     ( -0.457434   0.660537 )
Epeak [keV] : 249.337      ( -105.124 -249.319 )
Norm@50keV  : 2.57798E-02    ( -0.00894996   0.0190861 )
------------------------------------------------------------
#Fit statistic : Chi-Squared =          66.10 using 59 PHA bins.
# Reduced chi-squared =          1.180 for     56 degrees of freedom
# Null hypothesis probability =   1.674709e-01

Photon flux (15-150 keV)    in 1 sec: 1.90942 ( -0.14571  0.14527 ) ph/cm2/s
Energy fluence (15-150 keV)             : 2.10252e-07 ( -1.68415e-08  1.67606e-08 ) ergs/cm2
Time-resolved spectra
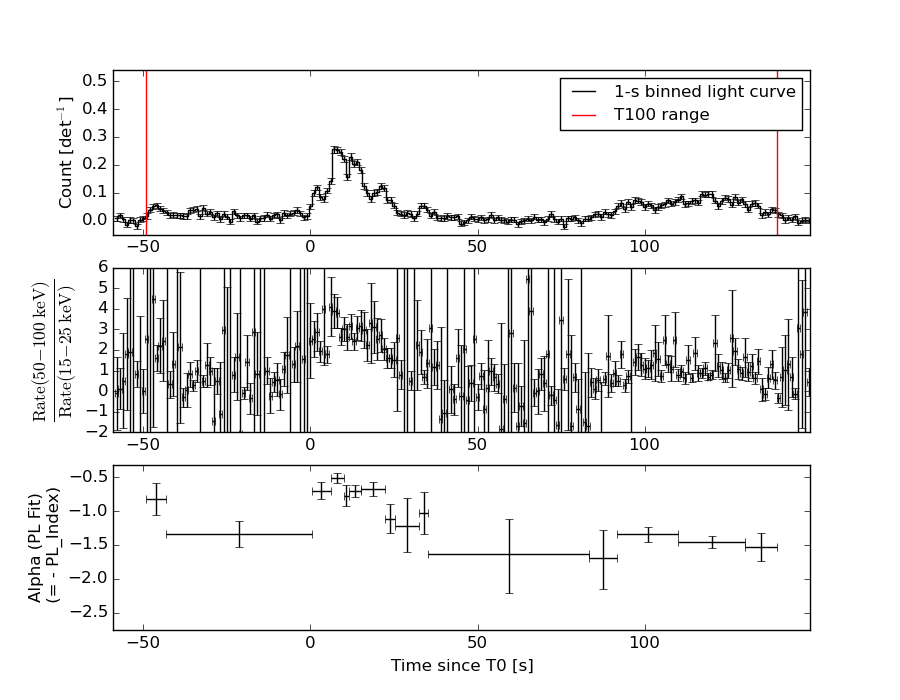
Distribution
T90 vs. Hardness ratio plot
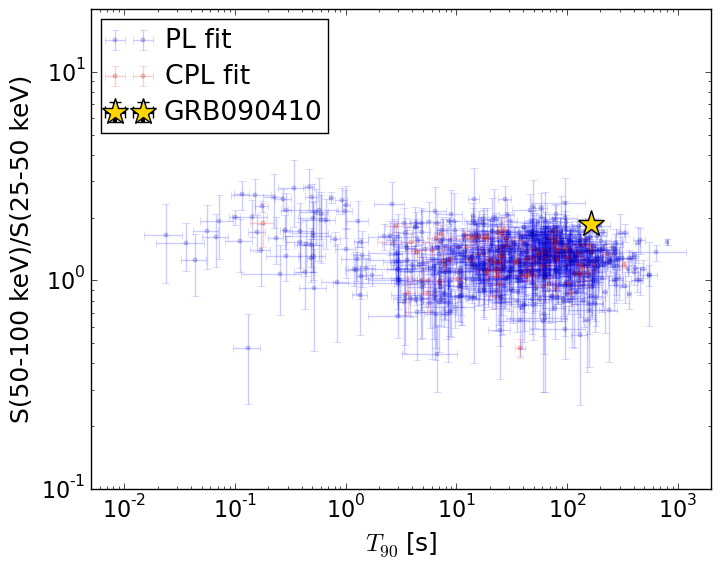
T90                                   = 165.148 sec.
Hardness ratio (energy fluence ratio) = 1.85600887021
S(15-50 keV) vs. S(50-150 keV) plot
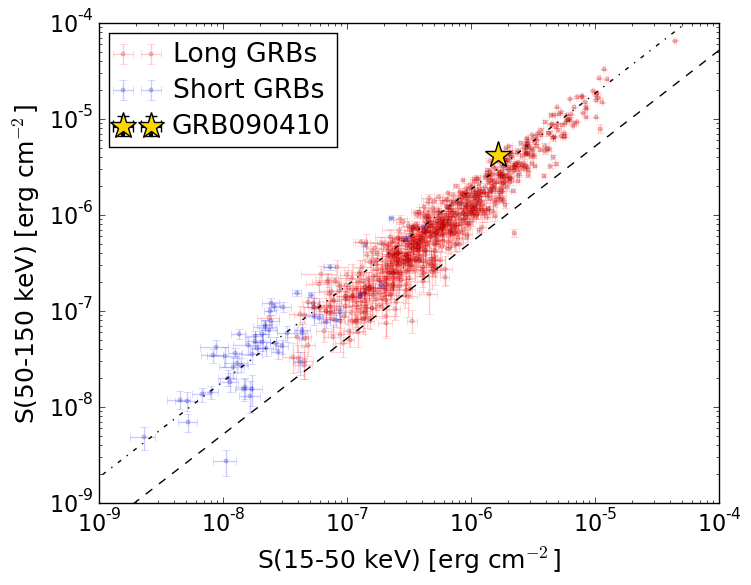
S(15-50 keV)  = 1.6583956e-06
S(50-150 keV) = 4.193395e-06
The dash-dotted line and the dashed line traces the fluences calculated from the Band function with Epeak = 15 and 150 keV, respectively. Both lines assume a canonical values of alpha = -1 and beta = -2.5.
Mask shadow pattern
IMX = 4.152756654939097E-02, IMY = 6.427216593654615E-02
Spacecraft aspect plot
Bright source in the pre-burst/pre-slew/post-slew images
Pre-burst image of 15-350 keV band
Time interval of the image:
-56.003410 -49.224000

# RAcent  DECcent POSerr Theta    Phi  PeakCts   SNR AngSep     Name
#  [deg]    [deg]    ['] [deg]  [deg]                   [']
299.6276  35.1648    2.7  32.9  134.8   0.1806   4.3    2.9	Cyg X-1
307.9703  40.8195   10.9  30.6  150.7   0.0335   1.1   10.2	Cyg X-3
326.3411  38.3808   54.7  21.3  176.2   0.0050   0.2    8.7	Cyg X-2
  9.5536 -15.4761    2.2  50.4  -45.4   0.6296   5.3 ------	UNKNOWN
Pre-slew background subtracted image of 15-350 keV band
Time interval of the image:
-49.224000 139.444000

# RAcent  DECcent POSerr Theta    Phi  PeakCts   SNR AngSep     Name
#  [deg]    [deg]    ['] [deg]  [deg]                   [']
299.4474  35.2523    5.9  33.1  134.8   2.3890   2.0    7.6	Cyg X-1
308.2316  41.1436    0.0  30.7  151.4   1.1494   1.3   12.7	Cyg X-3
325.9834  38.3675   36.3  21.4  175.4   0.2152   0.3    9.3	Cyg X-2
334.9581  15.4214    0.8   4.4  -57.1   9.1258  13.9 ------	UNKNOWN
335.0852  17.8845    2.2   4.0  -91.0   3.2955   5.2 ------	UNKNOWN
355.4365  23.8564    2.3  23.8 -103.7   3.7817   5.0 ------	UNKNOWN
Post-slew image of 15-350 keV band
Time interval of the image:
489.696590 962.579300

# RAcent  DECcent POSerr Theta    Phi  PeakCts   SNR AngSep     Name
#  [deg]    [deg]    ['] [deg]  [deg]                   [']
 83.6342  22.0204    0.3  37.5   13.8  19.7073  36.4    0.4	Crab
 20.2505 -60.2422    3.2  59.4 -163.2  11.0872   3.7 ------	UNKNOWN