Analysis Summary
Notes:
- 1) No attempt has been made to eliminate the non-significant decimal places.
- 2) This batgrbproduct analysis is done using the HEASARC data.
- 3) This batgrbproduct analysis is using the flight position for the mask-weighting calculation.
======================================================================
                  BAT GRB EVENT DATA PROCESSING REPORT
    Process Script Ver: batgrbproduct v2.46
    Process Start Time: Sun Jan 19 17:42:19 EST 2014
             Host Name: batevent1
   Current Working Dir: /local/data/batevent/batevent_reproc/trigger349447
======================================================================

  Trigger: 00349447      Segment: 000

  BAT Trigger Time: 261667048.46   [s; MET]
      Trigger Stop: 261667048.524   [s; MET]
               UTC: 2009-04-17T13:17:23.793440    [includes UTCF correction]
       Where From?: (*SHORT BURST*) TDRSS scaled map message

  BAT
    RA: 34.9949091846811   Dec: -7.18107713636088  [deg; J2000]

     Catalogged Source?: NO
     Point Source?:      YES
     GRB Indicated?:     YES    [ by BAT flight software ]
     Image S/N Ratio:    7.63
     Image Trigger?:     NO
     Rate S/N Ratio:     18.3030052177231  [ if not an image trigger ]
     Image S/N Ratio:    7.63

  Analysis Position:   [ source = BAT ]
    RA: 34.9949091846811   Dec: -7.18107713636088  [deg; J2000]

  Refined Position:   [ source = BAT pre-slew burst ]
    RA: 34.9932389235843   Dec: -7.14606233647583  [deg; J2000]
        { 02h 19m 58.4s , -07d 08' 45.8" }
         +/- 2.7356288920874 [arcmin] (estimated 90% radius based on SNR)
         +/- 1.47160403312466 [arcmin] (formal 1-sigma fit error)
    SNR: 7.22355489196936

  Angular difference between the analysis and refined position is 2.103240 arcmin

  Partial Coding Fraction: 0.3007812    [ including projection effects ]

  Duration
     T90: 0.0679999887943268 +/- 0.0215406475404197
        Measured from: 0
                   to: 0.0679999887943268     [s; relative to TRIGTIME]
     T50: 0.0320000052452087 +/- 0.0126491080018669
        Measured from: 0.0119999945163727
                   to: 0.0439999997615814     [s; relative to TRIGTIME]


  Fluence
     Peak Flux  (peak 1 second)
        Measured from: -0.46000000834465
                   to: 0.53999999165535     [s; relative to TRIGTIME]
     Total Fluence
        Measured from: -0.00400000810623169
                   to: 0.0799999833106995     [s; relative to TRIGTIME]

             Band 1     Band 2     Band 3     Band 4
              15-25      25-50     50-100    100-350     keV
 Total     0.014121   0.021146   0.027197   0.001729
           0.003912   0.004449   0.004108   0.002755 [error]
 Peak      0.029495   0.015953   0.044141  -0.003964
           0.009458   0.009859   0.009110   0.007316 [error]

     [ fluence units of on-axis counts / fully illuminated detector ]

======================================================================


====== Table of the duration information =============================

        Value   tstart    tstop
T100    0.084   -0.004    0.080
T90     0.068    0.000    0.068
T50     0.032    0.012    0.044
Peak    1.000   -0.460    0.540


====== Spectral Analysis Summary =====================================

Model      : spectral model: simple power-law (PL) and cutoff power-law (CPL)
Ph_index   : photon index: E^{Ph_index}
Ph_90err   : 90% error of the photon index
Epeak      : Epeak in keV
Epeak_90err: 90% error of Epeak
Norm       : normalization at 50 keV in both the PL model and CPL model
Nomr_90err : 90% error of the normalization
chi2       : Chi-Squared
dof        : degree of freedo

=== Time-averaged spectral analysis ===
(Best model with acceptable fit: N/A)

Model Ph_index Ph_90err_low Ph_90err_hi  Epeak  Epeak_90err_low  Epeak_90err_hi  Norm       Nomr_90err_low    Norm_90err_hi    chi2    dof
PL      -2.812    -0.360      0.285       -           -               -         1.57e-02     -4.96e-03          4.74e-03      71.350   57
CPL      0.387    -1.529      1.519       42.782     -16.067        10.258      7.17e-01     -7.17e-01          3.82e+00      59.510   56


=== 1-s peak spectral analysis ===
(Best model with acceptable fit: PL)

Model Ph_index Ph_90err_low Ph_90err_hi  Epeak  Epeak_90err_low  Epeak_90err_hi  Norm       Nomr_90err_low    Norm_90err_hi    chi2    dof
PL      -1.445     -0.655     0.604       -           -               -         6.03e-03     -1.98e-03          1.91e-03      54.270   57
CPL     -1.454     -0.649     2.002     9999.360    -9999.360      -9999.360      6.04e-03     -6.04e-03          2.55e-02      54.280   56


=== Fluence/Peak Flux Summary ===

              Model    Band1     Band2     Band3     Band4     Band5     Total
                       15-25     25-50    50-100    100-350    15-150    15-350    keV
Fluence         PL   5.89e-09  4.93e-09  2.81e-09  2.37e-09  1.47e-08  1.60e-08   erg/cm2
      90%_error_low -1.77e-09 -1.33e-09 -1.04e-09 -1.25e-09 -3.93e-09 -4.43e-09   erg/cm2
      90%_error_hi   1.79e-09  1.32e-09  1.00e-09  1.50e-09  3.92e-09  4.44e-09   erg/cm2
Peak flux       PL   2.35e-01  2.45e-01  1.80e-01  2.13e-01  7.43e-01  8.73e-01   ph/cm2/s
      90%_error_low -1.24e-01 -8.75e-02 -7.67e-02 -1.42e-01 -2.37e-01 -2.77e-01   ph/cm2/s
      90%_error_hi   1.49e-01  8.27e-02  7.06e-02  2.39e-01  2.38e-01  2.82e-01   ph/cm2/s

Fluence        CPL   4.37e-09  9.80e-09  7.18e-09  1.08e-09  2.23e-08  2.24e-08   erg/cm2
      90%_error_low -2.32e-09 -2.64e-09 -2.81e-09 -6.43e-10 -5.42e-09 -5.42e-09   erg/cm2
      90%_error_hi   2.20e-09  2.62e-09  3.53e-09  7.62e-10  5.42e-09  5.43e-09   erg/cm2
Peak flux      CPL   2.36e-01  2.45e-01  1.80e-01  2.11e-01  7.43e-01  8.79e-01   ph/cm2/s
      90%_error_low     N/A       N/A       N/A       N/A       N/A   -3.21e-01   ph/cm2/s
      90%_error_hi      N/A       N/A       N/A       N/A       N/A    2.77e-01   ph/cm2/s

======================================================================
Image
Pre-slew 15.0-350.0 keV image (Event data)
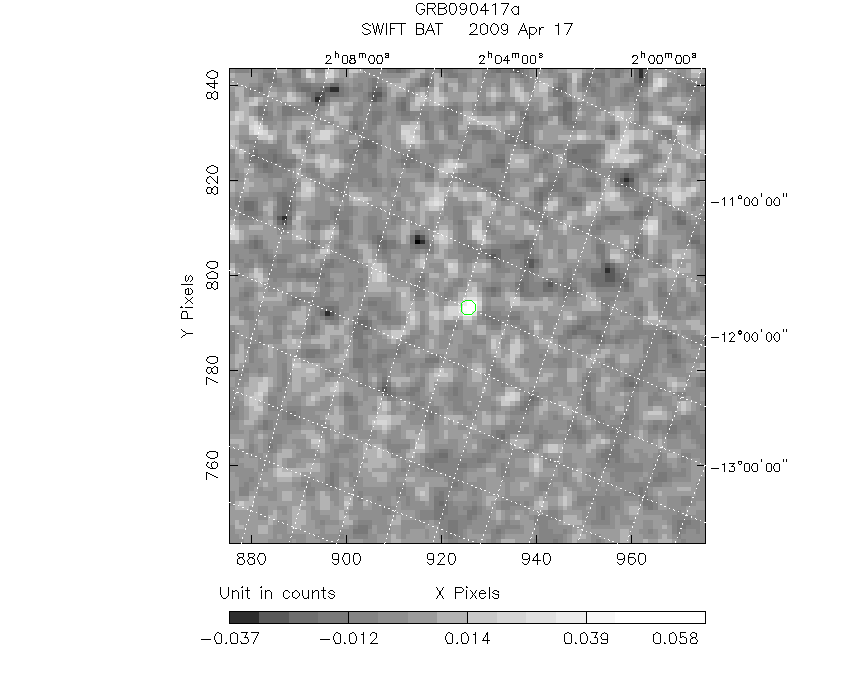
#   RAcent    DECcent   POSerr    Theta     Phi              Peak Cts       SNR   Name
   34.9932    -7.1461   0.0267    33.9036   -98.2825         0.0605495      7.224 TRIG_00349447

Foreground time interval of the image:
 -0.004   0.080 (delta_t =   0.084 [sec])
Background time interval of the image:
-239.460  -0.004 (delta_t = 239.456 [sec])
Light Curves
Note: The mask-weighted lightcurves have units of either count/det or counts/sec/det, where a det is 0.4 x 0.4 = 0.16 sq cm.
Full-time range; 1 s binning
Other quick-look light curves:
- 64 ms binning (zoomed)
- 16 ms binning (zoomed)
- 8 ms binning (zoomed)
- 2 ms binning (zoomed)
- SN=5 or 10 s binning (full-time range)
- Raw light curve
Spectra
- 64 ms binning (zoomed)
- 16 ms binning (zoomed)
- 8 ms binning (zoomed)
- 2 ms binning (zoomed)
- SN=5 or 10 s binning (full-time range)
- Raw light curve
Spectra
Notes:
- 1) The fitting includes the systematic errors.
- 2) When the burst includes telescope slew time periods, the fitting uses an average response file made from multiple 5-s response files through out the slew time plus single time preiod for the non-slew times, and weighted by the total counts in the corresponding time period using addrmf. An average response file is needed becuase a spectral fit using the pre-slew DRM will introduce some errors in both a spectral shape and a normalization if the PHA file contains a lot of the slew/post-slew time interval.
- 3) For fits to more complicated models (e.g. a power-law over a cutoff power-law), the BAT team has decided to require a chi-square improvement of more than 6 for each extra dof.
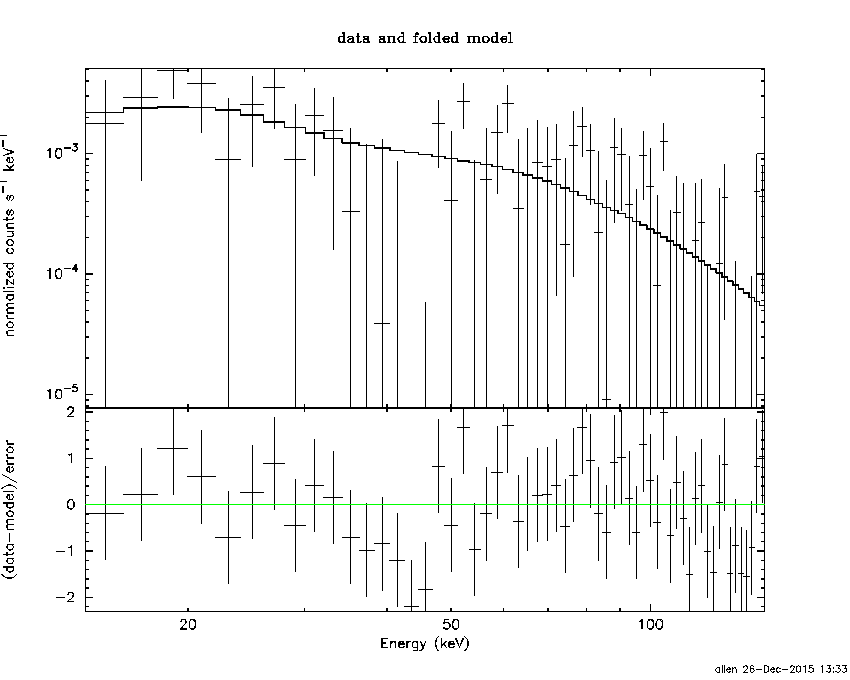
Time averaged spectrum fit using the average DRM
Power-law model
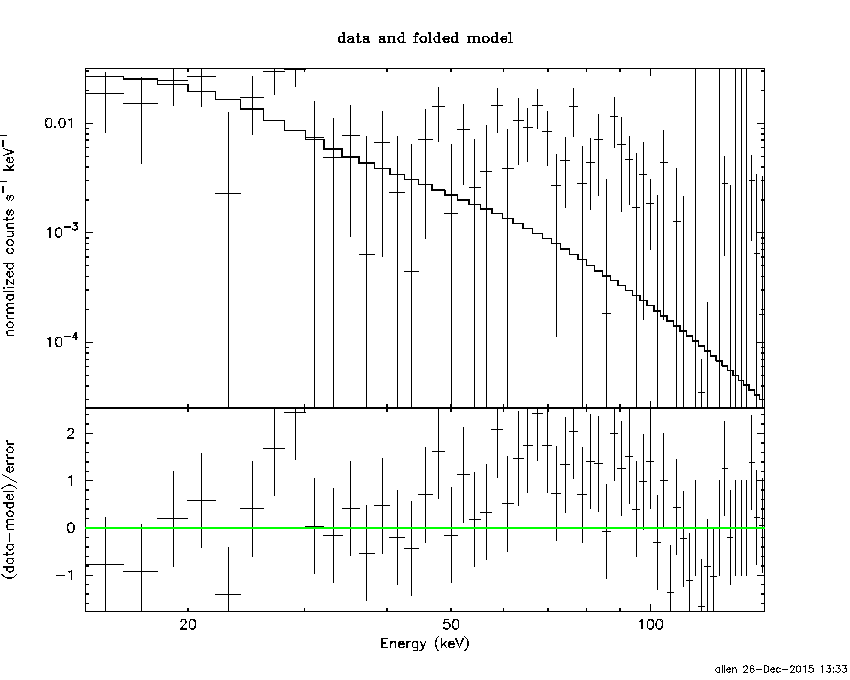
Time interval is from   -0.004 sec. to    0.080 sec.

Spectral model in power-law:
------------------------------------------------------------
Parameters  : value       lower 90%   higher 90%
Photon index: -2.81195     ( -0.359697   0.286027 )
Norm@50keV  : 1.57426E-02    ( -0.00495657   0.00474087 )
------------------------------------------------------------
#Fit statistic : Chi-Squared =          71.35 using 59 PHA bins.
# Reduced chi-squared =          1.252 for     57 degrees of freedom
# Null hypothesis probability =   9.565205e-02

Photon flux (15-150 keV)    in 0.084 sec: 3.79061 ( -1.03217  1.03163 ) ph/cm2/s
Energy fluence (15-150 keV)             : 1.46676e-08 ( -3.9272e-09  3.92456e-09 ) ergs/cm2
Cutoff power-law model
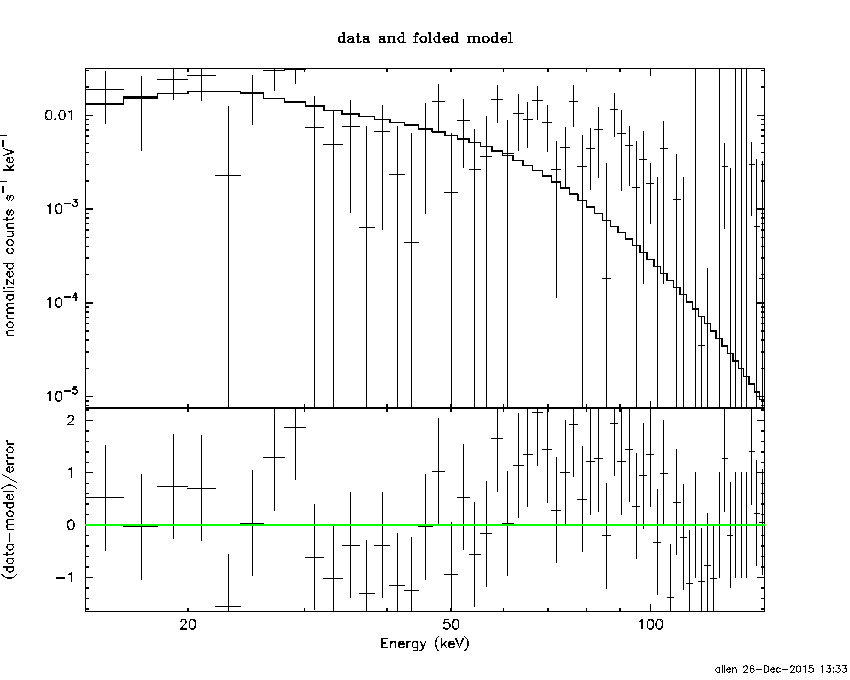
Time interval is from   -0.004 sec. to    0.080 sec.
Spectral model in the cutoff power-law:
------------------------------------------------------------
Parameters  : value       lower 90%   higher 90%
Photon index: 0.387433     ( -1.52809   1.51966 )
Epeak [keV] : 42.7825      ( -16.0678 10.2573 )
Norm@50keV  : 0.716673    ( -0.715872   3.81928 )
------------------------------------------------------------
#Fit statistic : Chi-Squared =          59.51 using 59 PHA bins.
# Reduced chi-squared =          1.063 for     56 degrees of freedom
# Null hypothesis probability =   3.489917e-01

Photon flux (15-150 keV)    in 0.084 sec: 4.59305 ( -1.15392  1.14208 ) ph/cm2/s
Energy fluence (15-150 keV)             : 2.23187e-08 ( -5.41628e-09  5.42211e-09 ) ergs/cm2
1-s peak spectrum fit
Power-law model
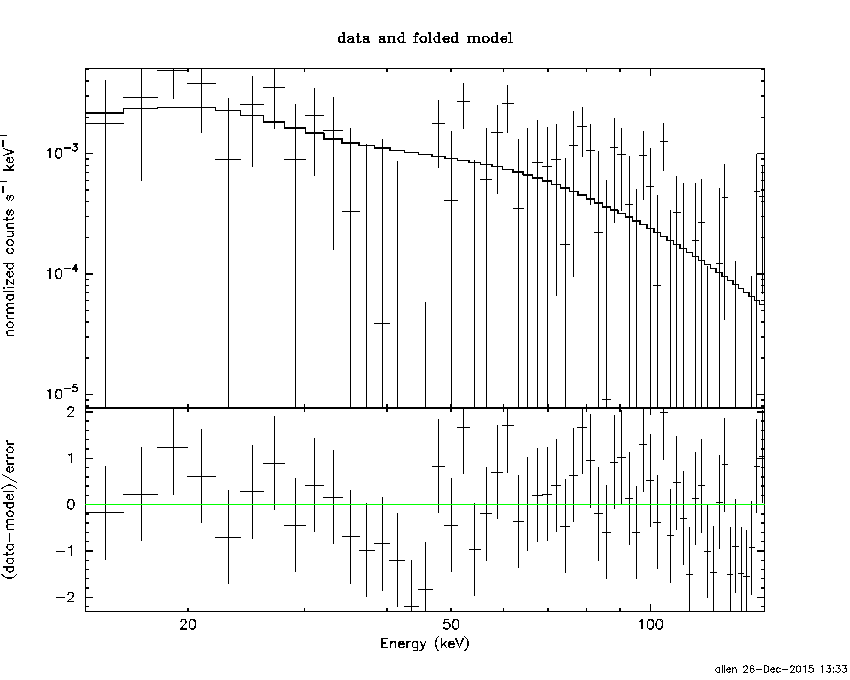
Time interval is from   -0.460 sec. to    0.540 sec.

Spectral model in power-law:
------------------------------------------------------------
Parameters  : value       lower 90%   higher 90%
Photon index: -1.44491     ( -0.655158   0.604344 )
Norm@50keV  : 6.03281E-03    ( -0.00198196   0.00190634 )
------------------------------------------------------------
#Fit statistic : Chi-Squared =          54.27 using 59 PHA bins.
# Reduced chi-squared =         0.9521 for     57 degrees of freedom
# Null hypothesis probability =   5.780794e-01

Photon flux (15-150 keV)    in 1 sec: 0.742538 ( -0.237374  0.237928 ) ph/cm2/s
Energy fluence (15-150 keV)             : 5.77923e-08 ( -2.05334e-08  2.07475e-08 ) ergs/cm2
Cutoff power-law model
Time interval is from   -0.460 sec. to    0.540 sec.
Spectral model in the cutoff power-law:
------------------------------------------------------------
Parameters  : value       lower 90%   higher 90%
Photon index: -1.4535     ( -0.649284   2.00153 )
Epeak [keV] : 9999.36      ( -9999.36 -9999.36 )
Norm@50keV  : 6.04299E-03    ( -0.00604485   0.0255415 )
------------------------------------------------------------
#Fit statistic : Chi-Squared =          54.28 using 59 PHA bins.
# Reduced chi-squared =         0.9692 for     56 degrees of freedom
# Null hypothesis probability =   5.404164e-01

Photon flux (15-150 keV)    in 1 sec: 0.742791 (    ) ph/cm2/s
Energy fluence (15-150 keV)             : 5.77617e-08 ( 0  0 ) ergs/cm2
Time-resolved spectra
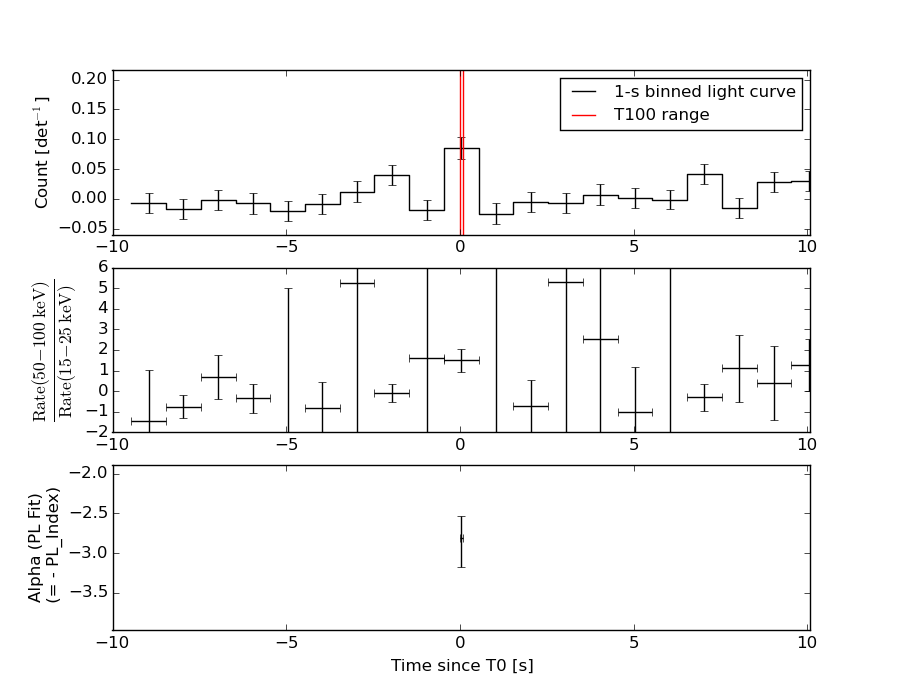
Distribution
T90 vs. Hardness ratio plot
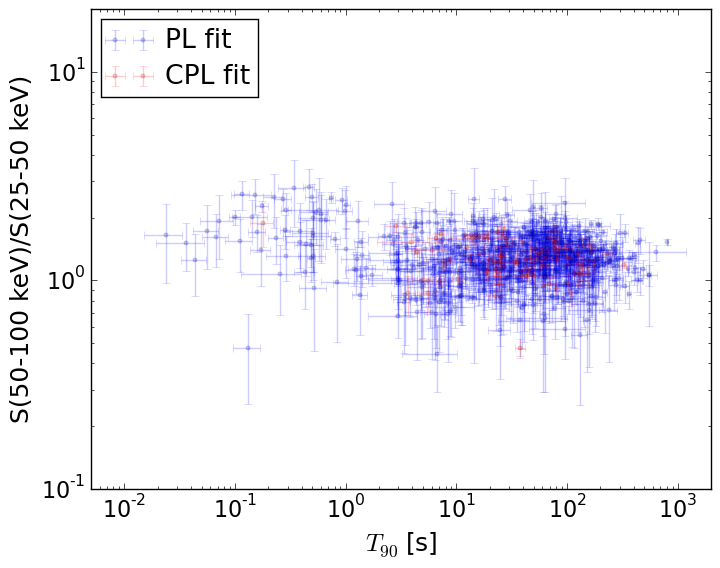
T90                                   = N/A sec.
Hardness ratio (energy fluence ratio) = N/A
S(15-50 keV) vs. S(50-150 keV) plot
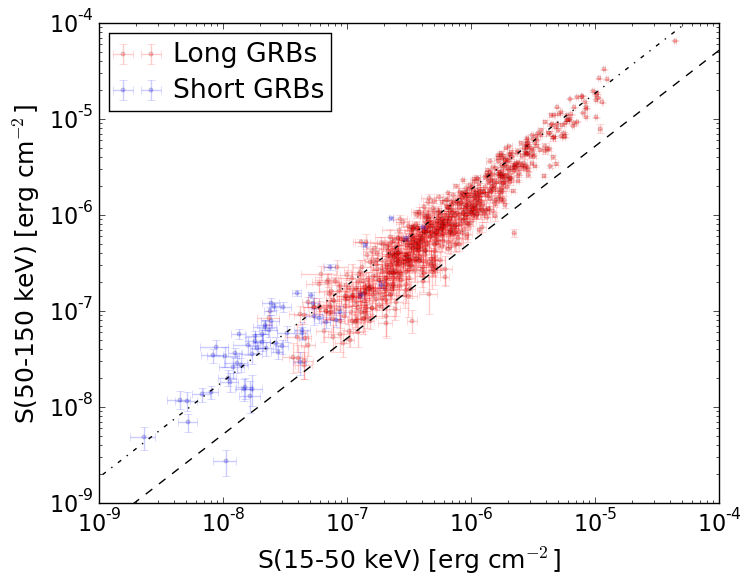
S(15-50 keV)  = N/A
S(50-150 keV) = N/A
The dash-dotted line and the dashed line traces the fluences calculated from the Band function with Epeak = 15 and 150 keV, respectively. Both lines assume a canonical values of alpha = -1 and beta = -2.5.
Mask shadow pattern
IMX = -9.681319995077575E-02, IMY = 6.650541571305872E-01
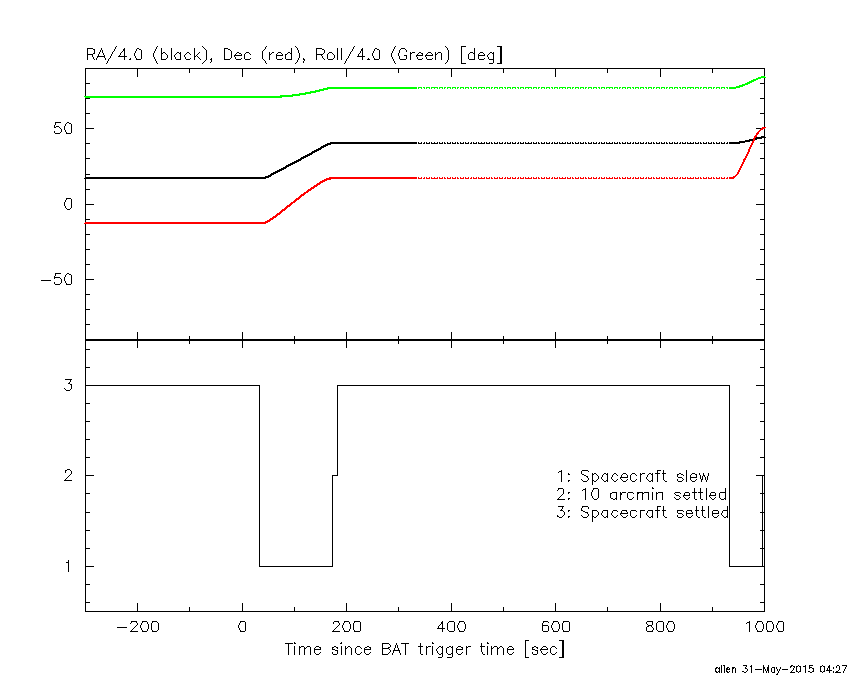
Spacecraft aspect plot
Bright source in the pre-burst/pre-slew/post-slew images
Pre-burst image of 15-350 keV band
Time interval of the image:
-239.460000 -0.004000

# RAcent  DECcent POSerr Theta    Phi  PeakCts   SNR AngSep     Name
#  [deg]    [deg]    ['] [deg]  [deg]                   [']
 83.6346  22.0256    0.3  37.5    8.4   9.4631  36.1    0.7	Crab
 80.4760 -61.4824    2.6  49.6  158.6   2.9173   4.5 ------	UNKNOWN
Pre-slew background subtracted image of 15-350 keV band
Time interval of the image:
-0.004000 0.080000

# RAcent  DECcent POSerr Theta    Phi  PeakCts   SNR AngSep     Name
#  [deg]    [deg]    ['] [deg]  [deg]                   [']
 83.7281  21.9945    4.5  37.5    8.5   0.0128   2.5    5.4	Crab
 99.3549  12.1759    2.4  39.0   37.5   0.0320   4.9 ------	UNKNOWN
 55.2775 -50.7497    2.1  39.8  179.3   0.0277   5.6 ------	UNKNOWN
 47.3758  15.4479    2.1  35.3  -52.2   0.0318   5.5 ------	UNKNOWN
 34.9933  -7.1461    1.6  33.9  -98.3   0.0604   7.2 ------	UNKNOWN
 30.0958   0.7846    2.8  40.8  -88.0   0.0701   4.1 ------	UNKNOWN
Post-slew image of 15-350 keV band
Time interval of the image:
172.440600 933.340600

# RAcent  DECcent POSerr Theta    Phi  PeakCts   SNR AngSep     Name
#  [deg]    [deg]    ['] [deg]  [deg]                   [']
189.5234  -2.6594    2.3  33.9   85.3   4.4988   5.1 ------	UNKNOWN
128.6642 -12.5358    2.6  44.2 -168.3   2.9386   4.5 ------	UNKNOWN
185.7659  63.9561    3.1  49.5  -24.5   3.1819   3.8 ------	UNKNOWN