Analysis Summary
Notes:
- 1) No attempt has been made to eliminate the non-significant decimal places.
- 2) This batgrbproduct analysis is done using the HEASARC data.
- 3) This batgrbproduct analysis is using the flight position for the mask-weighting calculation.
======================================================================
                  BAT GRB EVENT DATA PROCESSING REPORT
    Process Script Ver: batgrbproduct v2.46
    Process Start Time: Sun Jan 19 17:26:56 EST 2014
             Host Name: batevent1
   Current Working Dir: /local/data/batevent/batevent_reproc/trigger349931
======================================================================

  Trigger: 00349931      Segment: 000

  BAT Trigger Time: 262064121.444   [s; MET]
      Trigger Stop: 262064121.508   [s; MET]
               UTC: 2009-04-22T03:35:16.764880    [includes UTCF correction]
       Where From?: (*SHORT BURST*) TDRSS scaled map message

  BAT
    RA: 294.756100929833   Dec: 40.3842290518036  [deg; J2000]

     Catalogged Source?: NO
     Point Source?:      YES
     GRB Indicated?:     YES    [ by BAT flight software ]
     Image S/N Ratio:    7
     Image Trigger?:     NO
     Rate S/N Ratio:     10.3923048454133  [ if not an image trigger ]
     Image S/N Ratio:    7

  Analysis Position:   [ source = BAT ]
    RA: 294.756100929833   Dec: 40.3842290518036  [deg; J2000]

  Refined Position:   [ source = BAT pre-slew burst ]
    RA: 294.743911193011   Dec: 40.3965434901325  [deg; J2000]
        { 19h 38m 58.5s , +40d 23' 47.6" }
         +/- 1.8815490267443 [arcmin] (estimated 90% radius based on SNR)
         +/- 0.811997662561176 [arcmin] (formal 1-sigma fit error)
    SNR: 12.3297231247078

  Angular difference between the analysis and refined position is 0.925330 arcmin

  Partial Coding Fraction: 0.71875    [ including projection effects ]

  Duration
     T90: 8.47600001096725 +/- 0.381764329779977
        Measured from: -0.26800000667572
                   to: 8.20800000429153     [s; relative to TRIGTIME]
     T50: 7.47600001096725 +/- 5.53747958421237
        Measured from: 0.0839999914169312
                   to: 7.56000000238419     [s; relative to TRIGTIME]


  Fluence
     Peak Flux  (peak 1 second)
        Measured from: -0.372000008821487
                   to: 0.627999991178513     [s; relative to TRIGTIME]
     Total Fluence
        Measured from: -0.392000019550323
                   to: 8.49599999189377     [s; relative to TRIGTIME]

             Band 1     Band 2     Band 3     Band 4
              15-25      25-50     50-100    100-350     keV
 Total     0.143956   0.127819   0.103164   0.044286
           0.019264   0.019752   0.017516   0.015413 [error]
 Peak      0.055026   0.073015   0.070125   0.017513
           0.007169   0.007515   0.007033   0.005472 [error]

     [ fluence units of on-axis counts / fully illuminated detector ]

======================================================================


====== Table of the duration information =============================

        Value   tstart    tstop
T100    8.888   -0.392    8.496
T90     8.476   -0.268    8.208
T50     7.476    0.084    7.560
Peak    1.000   -0.372    0.628


====== Spectral Analysis Summary =====================================

Model      : spectral model: simple power-law (PL) and cutoff power-law (CPL)
Ph_index   : photon index: E^{Ph_index}
Ph_90err   : 90% error of the photon index
Epeak      : Epeak in keV
Epeak_90err: 90% error of Epeak
Norm       : normalization at 50 keV in both the PL model and CPL model
Nomr_90err : 90% error of the normalization
chi2       : Chi-Squared
dof        : degree of freedo

=== Time-averaged spectral analysis ===
(Best model with acceptable fit: PL)

Model Ph_index Ph_90err_low Ph_90err_hi  Epeak  Epeak_90err_low  Epeak_90err_hi  Norm       Nomr_90err_low    Norm_90err_hi    chi2    dof
PL      -1.679    -0.295      0.283       -           -               -         2.88e-03     -4.74e-04          4.54e-04      51.680   57
CPL     -1.710    -0.267      0.405     9999.360    -9999.350      -9999.360      2.82e-03        N/A               N/A         51.740   56


=== 1-s peak spectral analysis ===
(Best model with acceptable fit: PL)

Model Ph_index Ph_90err_low Ph_90err_hi  Epeak  Epeak_90err_low  Epeak_90err_hi  Norm       Nomr_90err_low    Norm_90err_hi    chi2    dof
PL      -1.301     -0.172     0.173       -           -               -         1.43e-02     -1.46e-03          1.46e-03      57.760   57
CPL     -0.981     -0.303     0.766      160.432    -160.432      -160.432      2.08e-02     -7.70e-03          2.88e-02      57.090   56


=== Fluence/Peak Flux Summary ===

              Model    Band1     Band2     Band3     Band4     Band5     Total
                       15-25     25-50    50-100    100-350    15-150    15-350    keV
Fluence         PL   3.86e-08  6.36e-08  7.95e-08  1.97e-07  2.37e-07  3.79e-07   erg/cm2
      90%_error_low -8.82e-09 -8.90e-09 -1.83e-08 -8.14e-08 -4.09e-08 -9.97e-08   erg/cm2
      90%_error_hi   9.17e-09  8.88e-09  1.82e-08  1.15e-07  4.18e-08  1.27e-07   erg/cm2
Peak flux       PL   4.86e-01  5.50e-01  4.47e-01  6.05e-01  1.70e+00  2.09e+00   ph/cm2/s
      90%_error_low -8.63e-02 -6.25e-02 -5.53e-02 -1.41e-01 -1.76e-01 -2.22e-01   ph/cm2/s
      90%_error_hi   9.06e-02  6.17e-02  5.47e-02  1.66e-01  1.76e-01  2.25e-01   ph/cm2/s

Fluence        CPL   3.51e-08  4.60e-08  4.62e-08  1.06e-07  1.59e-07  2.36e-07   erg/cm2
      90%_error_low -1.20e-08 -1.36e-08 -1.64e-08    N/A    -4.48e-08 -9.00e-08   erg/cm2
      90%_error_hi   1.04e-08  1.24e-08  1.10e-08    N/A     3.58e-08  4.03e-08   erg/cm2
Peak flux      CPL   4.60e-01  5.69e-01  4.60e-01  4.11e-01  1.68e+00  1.90e+00   ph/cm2/s
      90%_error_low -1.02e-01 -7.24e-02 -6.12e-02 -2.20e-01 -1.81e-01 -2.92e-01   ph/cm2/s
      90%_error_hi   1.03e-01  7.57e-02  6.33e-02  2.45e-01  1.80e-01  3.21e-01   ph/cm2/s

======================================================================
Image
Pre-slew 15.0-350.0 keV image (Event data)
#   RAcent    DECcent   POSerr    Theta     Phi              Peak Cts       SNR   Name
  294.7439    40.3965   0.0157    21.3905   -79.6823         0.4333063     12.330 TRIG_00349931

Foreground time interval of the image:
 -0.392   8.496 (delta_t =   8.888 [sec])
Background time interval of the image:
-239.444  -0.392 (delta_t = 239.052 [sec])
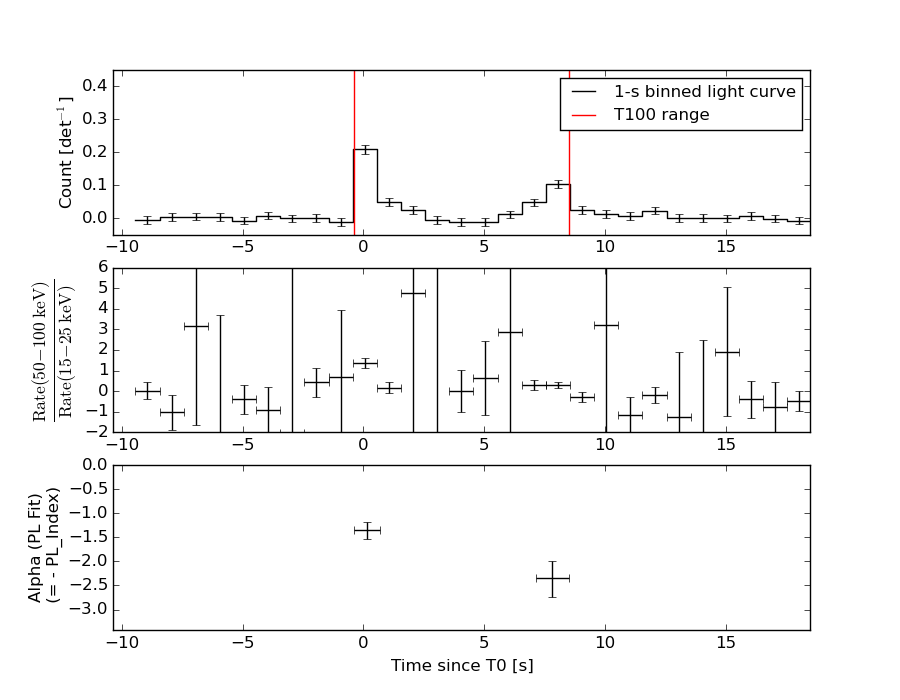
Light Curves
Note: The mask-weighted lightcurves have units of either count/det or counts/sec/det, where a det is 0.4 x 0.4 = 0.16 sq cm.
Full-time range; 1 s binning
Other quick-look light curves:
- 64 ms binning (zoomed)
- 16 ms binning (zoomed)
- 8 ms binning (zoomed)
- 2 ms binning (zoomed)
- SN=5 or 10 s binning (full-time range)
- Raw light curve
Spectra
- 64 ms binning (zoomed)
- 16 ms binning (zoomed)
- 8 ms binning (zoomed)
- 2 ms binning (zoomed)
- SN=5 or 10 s binning (full-time range)
- Raw light curve
Spectra
Notes:
- 1) The fitting includes the systematic errors.
- 2) When the burst includes telescope slew time periods, the fitting uses an average response file made from multiple 5-s response files through out the slew time plus single time preiod for the non-slew times, and weighted by the total counts in the corresponding time period using addrmf. An average response file is needed becuase a spectral fit using the pre-slew DRM will introduce some errors in both a spectral shape and a normalization if the PHA file contains a lot of the slew/post-slew time interval.
- 3) For fits to more complicated models (e.g. a power-law over a cutoff power-law), the BAT team has decided to require a chi-square improvement of more than 6 for each extra dof.
Time averaged spectrum fit using the average DRM
Power-law model
Time interval is from   -0.392 sec. to    8.496 sec.

Spectral model in power-law:
------------------------------------------------------------
Parameters  : value       lower 90%   higher 90%
Photon index: -1.67905     ( -0.294626   0.282721 )
Norm@50keV  : 2.87645E-03    ( -0.000474163   0.000453746 )
------------------------------------------------------------
#Fit statistic : Chi-Squared =          51.68 using 59 PHA bins.
# Reduced chi-squared =         0.9067 for     57 degrees of freedom
# Null hypothesis probability =   6.742088e-01

Photon flux (15-150 keV)    in 8.888 sec: 0.379287 ( -0.053041  0.053065 ) ph/cm2/s
Energy fluence (15-150 keV)             : 2.37156e-07 ( -4.08767e-08  4.18376e-08 ) ergs/cm2
Cutoff power-law model

Time interval is from   -0.392 sec. to    8.496 sec.
Spectral model in the cutoff power-law:
------------------------------------------------------------
Parameters  : value       lower 90%   higher 90%
Photon index: -1.67925     ( -0.268924   0.403676 )
Epeak [keV] : 1.00000E+04      ( -9999.99 -10000 )
Norm@50keV  : 2.88046E-03    (     )
------------------------------------------------------------
#Fit statistic : Chi-Squared =          51.69 using 59 PHA bins.
# Reduced chi-squared =         0.9231 for     56 degrees of freedom
# Null hypothesis probability =   6.384815e-01

Photon flux (15-150 keV)    in 8.888 sec: 0.379312 ( -0.05277  0.053011 ) ph/cm2/s
Energy fluence (15-150 keV)             : 1.58717e-07 ( -4.48095e-08  3.57979e-08 ) ergs/cm2
1-s peak spectrum fit
Power-law model
Time interval is from   -0.372 sec. to    0.628 sec.

Spectral model in power-law:
------------------------------------------------------------
Parameters  : value       lower 90%   higher 90%
Photon index: -1.30087     ( -0.172083   0.173281 )
Norm@50keV  : 1.42748E-02    ( -0.00146283   0.00145866 )
------------------------------------------------------------
#Fit statistic : Chi-Squared =          57.76 using 59 PHA bins.
# Reduced chi-squared =          1.013 for     57 degrees of freedom
# Null hypothesis probability =   4.470572e-01

Photon flux (15-150 keV)    in 1 sec: 1.70331 ( -0.17593  0.1761 ) ph/cm2/s
Energy fluence (15-150 keV)             : 1.41049e-07 ( -1.61497e-08  1.62877e-08 ) ergs/cm2
Cutoff power-law model
Time interval is from   -0.372 sec. to    0.628 sec.
Spectral model in the cutoff power-law:
------------------------------------------------------------
Parameters  : value       lower 90%   higher 90%
Photon index: -0.980722     ( -0.302657   0.76596 )
Epeak [keV] : 160.432      ( -160.455 -160.455 )
Norm@50keV  : 2.07574E-02    ( -0.00769513   0.0288224 )
------------------------------------------------------------
#Fit statistic : Chi-Squared =          57.09 using 59 PHA bins.
# Reduced chi-squared =          1.019 for     56 degrees of freedom
# Null hypothesis probability =   4.344870e-01

Photon flux (15-150 keV)    in 1 sec: 1.68450 ( -0.18085  0.1804 ) ph/cm2/s
Energy fluence (15-150 keV)             : 1.37585e-07 ( -1.80486e-08  1.77717e-08 ) ergs/cm2
Time-resolved spectra
Distribution
T90 vs. Hardness ratio plot
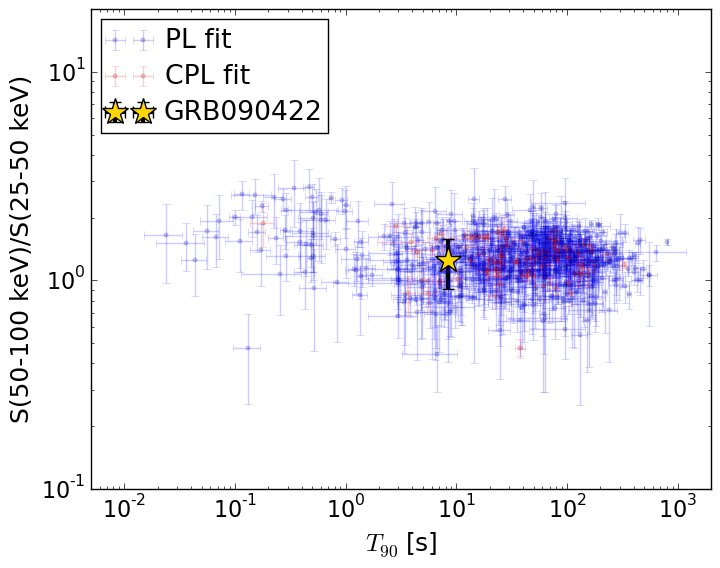
T90                                   = 8.476 sec.
Hardness ratio (energy fluence ratio) = 1.24916543017
S(15-50 keV) vs. S(50-150 keV) plot
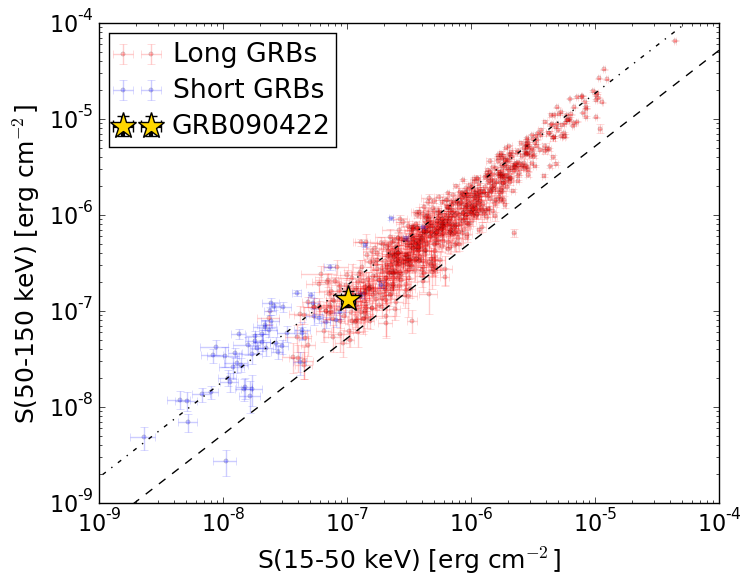
S(15-50 keV)  = 1.0226784e-07
S(50-150 keV) = 1.3488539e-07
The dash-dotted line and the dashed line traces the fluences calculated from the Band function with Epeak = 15 and 150 keV, respectively. Both lines assume a canonical values of alpha = -1 and beta = -2.5.
Mask shadow pattern
IMX = 7.015688471606696E-02, IMY = 3.853698884002041E-01
Spacecraft aspect plot
Bright source in the pre-burst/pre-slew/post-slew images
Pre-burst image of 15-350 keV band
Time interval of the image:
-239.444000 -0.392000

# RAcent  DECcent POSerr Theta    Phi  PeakCts   SNR AngSep     Name
#  [deg]    [deg]    ['] [deg]  [deg]                   [']
254.5309  35.3511    7.9  12.4  139.9   0.2730   1.5    3.6	Her X-1
268.3829  -1.4396    6.8  34.9   38.4   0.5054   1.7    1.2	SW J1753.5-0127
274.0040 -14.0360    8.7  47.7   30.6   0.9861   1.3    0.1	GX 17+2
288.7641  10.9564    0.8  28.7   -6.2   2.8908  14.2    2.1	GRS 1915+105
299.5872  35.2053    0.3  25.0  -66.0   8.5609  36.2    0.3	Cyg X-1
308.1765  41.0625    4.4  31.6  -78.7   0.8168   2.6    7.2	Cyg X-3
231.2929  20.5267    3.3  36.0  115.6   1.5512   3.5 ------	UNKNOWN
255.4201   7.5872    3.0  28.9   66.3   1.2001   3.9 ------	UNKNOWN
270.4597   3.3046    2.5  30.1   34.5   1.1389   4.5 ------	UNKNOWN
217.6351  52.9853    2.6  41.3  171.0   1.4114   4.4 ------	UNKNOWN
319.9033  62.9160    3.0  43.0 -112.2   3.2976   3.8 ------	UNKNOWN
Pre-slew background subtracted image of 15-350 keV band
Time interval of the image:
-0.392000 8.496000

# RAcent  DECcent POSerr Theta    Phi  PeakCts   SNR AngSep     Name
#  [deg]    [deg]    ['] [deg]  [deg]                   [']
254.3488  35.4643    6.3  12.5  140.4  -0.0584  -1.8    9.0	Her X-1
268.4125  -1.5502    3.6  35.0   38.3   0.1770   3.2    6.4	SW J1753.5-0127
274.1412 -14.1256    6.7  47.8   30.4   0.2162   1.7    9.5	GX 17+2
288.7671  10.9460   26.6  28.7   -6.2   0.0155   0.4    1.8	GRS 1915+105
299.8094  35.1235    0.0  25.1  -65.8   0.0556   1.4   11.7	Cyg X-1
308.1292  40.9170    8.5  31.5  -78.4   0.0725   1.4    2.3	Cyg X-3
209.6112  45.9004    2.5  46.5  160.8   0.3238   4.6 ------	UNKNOWN
266.8997   9.1547    2.1  24.4   42.6   0.2157   5.5 ------	UNKNOWN
204.3335  67.8298    2.3  50.0 -169.8   0.3308   5.0 ------	UNKNOWN
294.7439  40.3966    0.9  21.4  -79.7   0.4334  12.3 ------	UNKNOWN
258.5004  72.8842    2.1  39.9 -148.2   0.2608   5.4 ------	UNKNOWN
296.7044  67.0470    2.6  37.2 -126.0   0.2308   4.5 ------	UNKNOWN
Post-slew image of 15-350 keV band
Time interval of the image:
53.256590 962.632500

# RAcent  DECcent POSerr Theta    Phi  PeakCts   SNR AngSep     Name
#  [deg]    [deg]    ['] [deg]  [deg]                   [']
254.5191  35.3671   12.8  31.9  107.0  -0.8887  -0.9    3.4	Her X-1
288.8000  10.9366    0.7  29.9   24.6  10.2510  15.8    0.5	GRS 1915+105
299.5861  35.2015    0.2   6.4  -25.2  32.5421  66.6    0.2	Cyg X-1
308.1078  40.9896    1.5  10.2  -84.9   3.8908   7.6    2.2	Cyg X-3
326.1938  38.2926    7.7  24.3  -82.5   1.1022   1.5    2.0	Cyg X-2
275.5612  33.3766    3.0  16.8   84.4   2.1593   3.9 ------	UNKNOWN
277.5287  55.5176    2.7  18.9  161.8   2.2072   4.3 ------	UNKNOWN
199.8665  78.6819    2.9  51.5  178.4   5.8691   4.0 ------	UNKNOWN
135.8655  80.4408    2.9  58.6 -171.1  15.9320   4.0 ------	UNKNOWN
116.1237  87.0853    3.0  52.5 -167.2   6.1130   3.9 ------	UNKNOWN
 51.3122  83.1585    3.9  53.0 -159.4   4.5827   2.9 ------	UNKNOWN
336.9942  59.6214    3.3  32.4 -127.8   2.6084   3.5 ------	UNKNOWN