Analysis Summary
Notes:
- 1) No attempt has been made to eliminate the non-significant decimal places.
- 2) This batgrbproduct analysis is done using the HEASARC data.
- 3) This batgrbproduct analysis is using the flight position for the mask-weighting calculation.
======================================================================
                  BAT GRB EVENT DATA PROCESSING REPORT
    Process Script Ver: batgrbproduct v2.46
    Process Start Time: Sun Jan 19 17:16:52 EST 2014
             Host Name: batevent1
   Current Working Dir: /local/data/batevent/batevent_reproc/trigger350311
======================================================================

  Trigger: 00350311      Segment: 000

  BAT Trigger Time: 262275134.016   [s; MET]
      Trigger Stop: 262275135.04   [s; MET]
               UTC: 2009-04-24T14:12:09.330200    [includes UTCF correction]
       Where From?: TDRSS position message

  BAT
    RA: 189.537885215137   Dec: 16.8295481175842  [deg; J2000]

     Catalogged Source?: NO
     Point Source?:      YES
     GRB Indicated?:     YES    [ by BAT flight software ]
     Image S/N Ratio:    23.3
     Image Trigger?:     NO
     Rate S/N Ratio:     255.998046867549  [ if not an image trigger ]
     Image S/N Ratio:    23.3

  Analysis Position:   [ source = BAT ]
    RA: 189.537885215137   Dec: 16.8295481175842  [deg; J2000]

  Refined Position:   [ source = BAT pre-slew burst ]
    RA: 189.530585094208   Dec: 16.8293462274994  [deg; J2000]
        { 12h 38m 07.3s , +16d 49' 45.6" }
         +/- 0.837448408297704 [arcmin] (estimated 90% radius based on SNR)
         +/- 0.320800297444586 [arcmin] (formal 1-sigma fit error)
    SNR: 39.1902733062376

  Angular difference between the analysis and refined position is 0.419423 arcmin

  Partial Coding Fraction: 0.1289062    [ including projection effects ]

  Duration
     T90: 49.4600000083447 +/- 2.26859604796511
        Measured from: -0.120000004768372
                   to: 49.3400000035763     [s; relative to TRIGTIME]
     T50: 3.36800000071526 +/- 0.048166349704769
        Measured from: 0.680000007152557
                   to: 4.04800000786781     [s; relative to TRIGTIME]


  Fluence
     Peak Flux  (peak 1 second)
        Measured from: -0.0960000157356262
                   to: 0.903999984264374     [s; relative to TRIGTIME]
     Total Fluence
        Measured from: -0.708000004291534
                   to: 102.520000010729     [s; relative to TRIGTIME]

             Band 1     Band 2     Band 3     Band 4
              15-25      25-50     50-100    100-350     keV
 Total     8.174245  12.340217   9.926880   2.593959
           0.131021   0.152710   0.143717   0.103984 [error]
 Peak      1.757820   2.871438   2.812179   0.878621
           0.048934   0.062862   0.064888   0.041449 [error]

     [ fluence units of on-axis counts / fully illuminated detector ]

======================================================================


====== Table of the duration information =============================

        Value   tstart    tstop
T100  103.228   -0.708  102.520
T90    49.460   -0.120   49.340
T50     3.368    0.680    4.048
Peak    1.000   -0.096    0.904


====== Spectral Analysis Summary =====================================

Model      : spectral model: simple power-law (PL) and cutoff power-law (CPL)
Ph_index   : photon index: E^{Ph_index}
Ph_90err   : 90% error of the photon index
Epeak      : Epeak in keV
Epeak_90err: 90% error of Epeak
Norm       : normalization at 50 keV in both the PL model and CPL model
Nomr_90err : 90% error of the normalization
chi2       : Chi-Squared
dof        : degree of freedo

=== Time-averaged spectral analysis ===
(Best model with acceptable fit: CPL)

Model Ph_index Ph_90err_low Ph_90err_hi  Epeak  Epeak_90err_low  Epeak_90err_hi  Norm       Nomr_90err_low    Norm_90err_hi    chi2    dof
PL      -1.532    -0.034      0.034       -           -               -         2.27e-02     -4.15e-04          4.15e-04      56.880   57
CPL     -1.241    -0.138      0.142      152.785     -31.344        81.407      3.03e-02     -3.78e-03          4.44e-03      43.590   56


=== 1-s peak spectral analysis ===
(Best model with acceptable fit: CPL)

Model Ph_index Ph_90err_low Ph_90err_hi  Epeak  Epeak_90err_low  Epeak_90err_hi  Norm       Nomr_90err_low    Norm_90err_hi    chi2    dof
PL      -1.306     -0.046     0.046       -           -               -         5.96e-01     -1.54e-02          1.54e-02      57.270   57
CPL     -0.984     -0.184     0.191      183.397     -47.119       156.988      8.26e-01     -1.37e-01          1.72e-01      48.110   56


=== Fluence/Peak Flux Summary ===

              Model    Band1     Band2     Band3     Band4     Band5     Total
                       15-25     25-50    50-100    100-350    15-150    15-350    keV
Fluence         PL   3.08e-06  5.55e-06  7.68e-06  2.21e-05  2.21e-05  3.84e-05   erg/cm2
      90%_error_low -1.18e-07 -1.25e-07 -1.61e-07 -1.05e-06 -4.07e-07 -1.12e-06   erg/cm2
      90%_error_hi   1.20e-07  1.24e-07  1.61e-07  1.09e-06  4.07e-07  1.15e-06   erg/cm2
Peak flux       PL   3.54e-03  4.24e-02  4.57e-01  5.51e+01  2.80e+00  5.37e+01   ph/cm2/s
      90%_error_low     N/A       N/A       N/A       N/A       N/A       N/A     ph/cm2/s
      90%_error_hi      N/A       N/A       N/A       N/A       N/A       N/A     ph/cm2/s

Fluence        CPL   2.84e-06  5.61e-06  7.91e-06  1.59e-05  2.18e-05  3.23e-05   erg/cm2
      90%_error_low -1.57e-07 -1.30e-07 -1.93e-07 -2.20e-06 -4.36e-07 -2.23e-06   erg/cm2
      90%_error_hi   1.60e-07  1.30e-07  1.94e-07  2.64e-06  4.36e-07  2.65e-06   erg/cm2
Peak flux      CPL   1.86e+01  2.33e+01  1.94e+01  1.88e+01  6.99e+01  8.01e+01   ph/cm2/s
      90%_error_low -1.37e+00 -7.68e-01 -6.85e-01 -2.79e+00 -2.08e+00 -3.64e+00   ph/cm2/s
      90%_error_hi   1.40e+00  7.71e-01  6.90e-01  3.40e+00  2.08e+00  4.07e+00   ph/cm2/s

======================================================================
Image
Pre-slew 15.0-350.0 keV image (Event data)
#   RAcent    DECcent   POSerr    Theta     Phi              Peak Cts       SNR   Name
  189.5306    16.8293   0.0049    38.7524    56.2910        30.7113191     39.190 TRIG_00350311

Foreground time interval of the image:
 -0.708  15.685 (delta_t =  16.393 [sec])
Background time interval of the image:
-239.016  -0.708 (delta_t = 238.308 [sec])
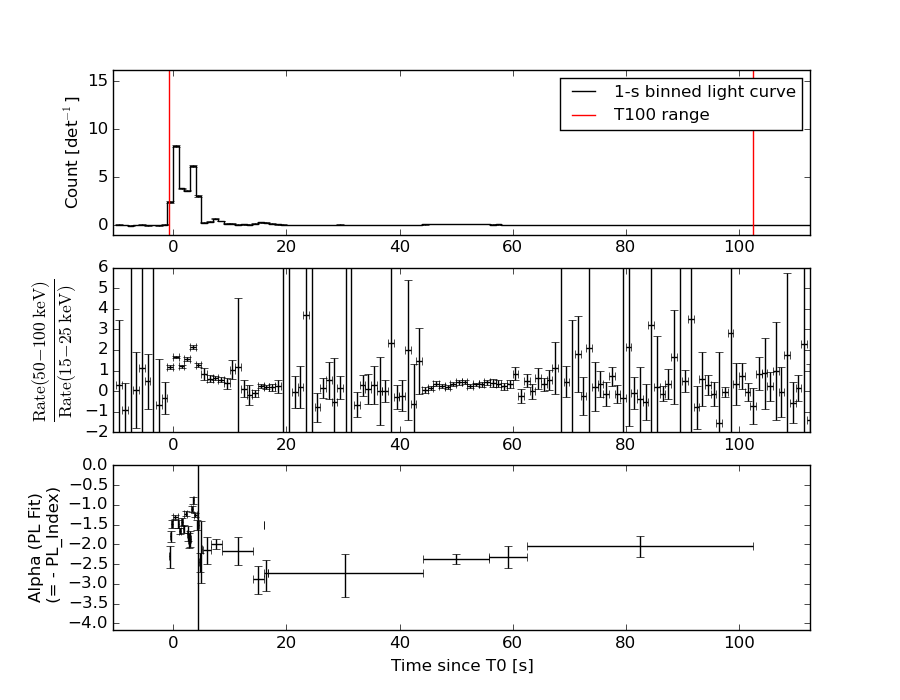
Light Curves
Note: The mask-weighted lightcurves have units of either count/det or counts/sec/det, where a det is 0.4 x 0.4 = 0.16 sq cm.
Full-time range; 1 s binning
Other quick-look light curves:
Spectra
Notes:
- 1) The fitting includes the systematic errors.
- 2) When the burst includes telescope slew time periods, the fitting uses an average response file made from multiple 5-s response files through out the slew time plus single time preiod for the non-slew times, and weighted by the total counts in the corresponding time period using addrmf. An average response file is needed becuase a spectral fit using the pre-slew DRM will introduce some errors in both a spectral shape and a normalization if the PHA file contains a lot of the slew/post-slew time interval.
- 3) For fits to more complicated models (e.g. a power-law over a cutoff power-law), the BAT team has decided to require a chi-square improvement of more than 6 for each extra dof.
Time averaged spectrum fit using the average DRM
Power-law model
Time interval is from   -0.708 sec. to  102.520 sec.

Spectral model in power-law:
------------------------------------------------------------
Parameters  : value       lower 90%   higher 90%
Photon index: -1.53208     ( -0.0340019   0.0340119 )
Norm@50keV  : 2.26984E-02    ( -0.000414694   0.000414604 )
------------------------------------------------------------
#Fit statistic : Chi-Squared =          56.88 using 59 PHA bins.
# Reduced chi-squared =         0.9980 for     57 degrees of freedom
# Null hypothesis probability =   4.793899e-01

Photon flux (15-150 keV)    in 103.2 sec: 2.85889 ( -0.06147  0.06168 ) ph/cm2/s
Energy fluence (15-150 keV)             : 2.21131e-05 ( -4.07082e-07  4.0751e-07 ) ergs/cm2
Cutoff power-law model
Time interval is from   -0.708 sec. to  102.520 sec.
Spectral model in the cutoff power-law:
------------------------------------------------------------
Parameters  : value       lower 90%   higher 90%
Photon index: -1.24149     ( -0.137861   0.142036 )
Epeak [keV] : 152.785      ( -31.3442 81.407 )
Norm@50keV  : 3.02722E-02    ( -0.00377682   0.00444385 )
------------------------------------------------------------
#Fit statistic : Chi-Squared =          43.59 using 59 PHA bins.
# Reduced chi-squared =         0.7785 for     56 degrees of freedom
# Null hypothesis probability =   8.864212e-01

Photon flux (15-150 keV)    in 103.2 sec: 2.78885 ( -0.0684  0.06884 ) ph/cm2/s
Energy fluence (15-150 keV)             : 2.17891e-05 ( -4.36093e-07  4.35762e-07 ) ergs/cm2
1-s peak spectrum fit
Power-law model
Time interval is from   -0.096 sec. to    0.904 sec.

Spectral model in power-law:
------------------------------------------------------------
Parameters  : value       lower 90%   higher 90%
Photon index: -1.30585     ( -0.0455435   0.0455528 )
Norm@50keV  : 0.595633    ( -0.0154208   0.0154186 )
------------------------------------------------------------
#Fit statistic : Chi-Squared =          57.27 using 59 PHA bins.
# Reduced chi-squared =          1.005 for     57 degrees of freedom
# Null hypothesis probability =   4.650168e-01

Photon flux (15-150 keV)    in 1 sec: 2.79531 (    ) ph/cm2/s
Energy fluence (15-150 keV)             : 5.87828e-06 ( -1.60861e-07  1.61067e-07 ) ergs/cm2
Cutoff power-law model
Time interval is from   -0.096 sec. to    0.904 sec.
Spectral model in the cutoff power-law:
------------------------------------------------------------
Parameters  : value       lower 90%   higher 90%
Photon index: -0.984222     ( -0.183783   0.191398 )
Epeak [keV] : 183.397      ( -47.1194 156.988 )
Norm@50keV  : 0.825770    ( -0.137422   0.171855 )
------------------------------------------------------------
#Fit statistic : Chi-Squared =          48.11 using 59 PHA bins.
# Reduced chi-squared =         0.8591 for     56 degrees of freedom
# Null hypothesis probability =   7.642037e-01

Photon flux (15-150 keV)    in 1 sec: 69.9227 ( -2.0775  2.0831 ) ph/cm2/s
Energy fluence (15-150 keV)             : 5.80858e-06 ( -1.67659e-07  1.67274e-07 ) ergs/cm2
Time-resolved spectra
Distribution
T90 vs. Hardness ratio plot
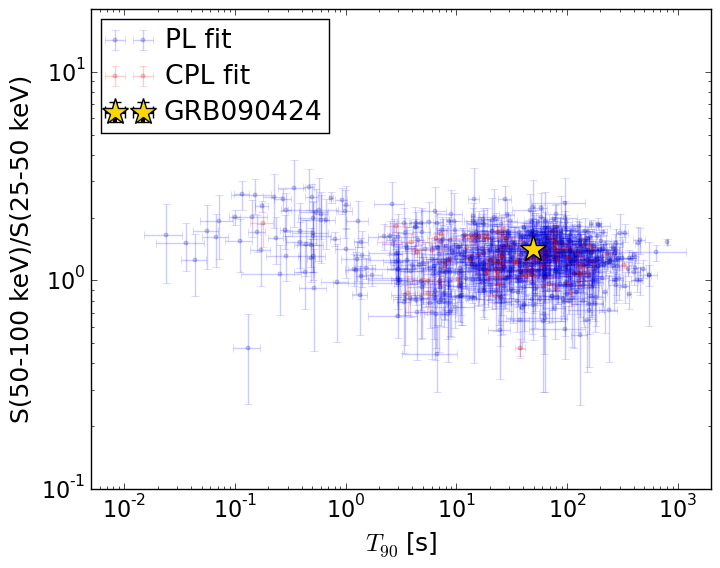
T90                                   = 49.46 sec.
Hardness ratio (energy fluence ratio) = 1.40951600236
S(15-50 keV) vs. S(50-150 keV) plot
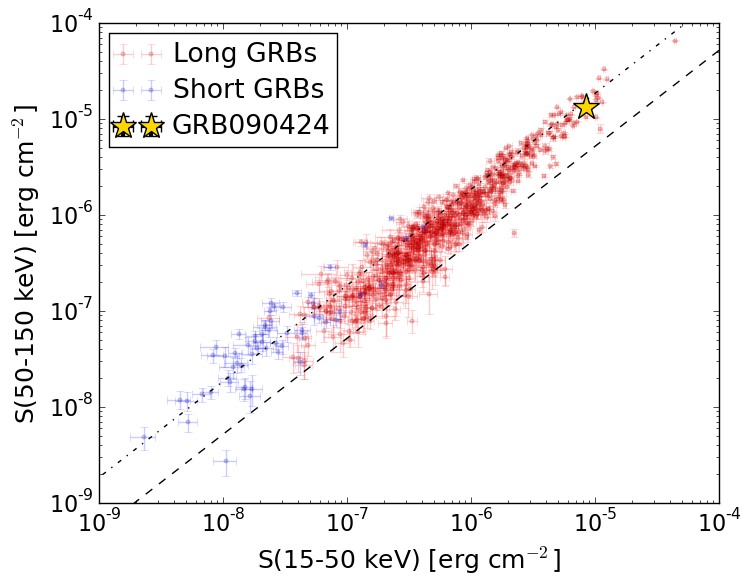
S(15-50 keV)  = 8.450786e-06
S(50-150 keV) = 1.333865e-05
The dash-dotted line and the dashed line traces the fluences calculated from the Band function with Epeak = 15 and 150 keV, respectively. Both lines assume a canonical values of alpha = -1 and beta = -2.5.
Mask shadow pattern
IMX = 4.454533651138777E-01, IMY = -6.677019518283577E-01
Spacecraft aspect plot
Bright source in the pre-burst/pre-slew/post-slew images
Pre-burst image of 15-350 keV band
Time interval of the image:
-239.016000 -0.708000

# RAcent  DECcent POSerr Theta    Phi  PeakCts   SNR AngSep     Name
#  [deg]    [deg]    ['] [deg]  [deg]                   [']
161.7822 -24.5859    2.4  44.6  133.9   3.2723   4.8 ------	UNKNOWN
Pre-slew background subtracted image of 15-350 keV band
Time interval of the image:
-0.708000 15.684620

# RAcent  DECcent POSerr Theta    Phi  PeakCts   SNR AngSep     Name
#  [deg]    [deg]    ['] [deg]  [deg]                   [']
189.5306  16.8293    0.3  38.8   56.3  30.7061  39.2 ------	UNKNOWN
130.0437 -24.6704    2.9  46.6  174.5   1.1704   4.0 ------	UNKNOWN
Post-slew image of 15-350 keV band
Time interval of the image:
73.284590 963.024000

# RAcent  DECcent POSerr Theta    Phi  PeakCts   SNR AngSep     Name
#  [deg]    [deg]    ['] [deg]  [deg]                   [']
246.1553  47.0381    3.7  55.2   -7.6   5.6086   3.2 ------	UNKNOWN
216.7503  57.0968    3.0  45.1  -30.9   3.2453   3.8 ------	UNKNOWN
159.5772  32.9793    3.2  31.4 -104.9   2.3008   3.6 ------	UNKNOWN
172.4443  58.5510    5.1  43.6  -64.3   6.1413   2.2 ------	UNKNOWN