Analysis Summary
Notes:
- 1) No attempt has been made to eliminate the non-significant decimal places.
- 2) This batgrbproduct analysis is done using the HEASARC data.
- 3) This batgrbproduct analysis is using the flight position for the mask-weighting calculation.
======================================================================
BAT GRB EVENT DATA PROCESSING REPORT
Process Script Ver: batgrbproduct v2.46
Process Start Time: Thu Aug 13 13:13:47 EDT 2015
Host Name: bat1
Current Working Dir: /local/data/bat1/alien/Swift_3rdBATcatalog/event/batevent_reproc/trigger351588
======================================================================
Trigger: 00351588 Segment: 000
BAT Trigger Time: 263607785.216 [s; MET]
Trigger Stop: 263607785.472 [s; MET]
UTC: 2009-05-10T00:23:00.487940 [includes UTCF correction]
Where From?: TDRSS position message
BAT
RA: 333.555035285725 Dec: -26.6056164508738 [deg; J2000]
Catalogged Source?: NO
Point Source?: YES
GRB Indicated?: YES [ by BAT flight software ]
Image S/N Ratio: 7.48
Image Trigger?: NO
Rate S/N Ratio: 145.485394455938 [ if not an image trigger ]
Image S/N Ratio: 7.48
Analysis Position: [ source = BAT ]
RA: 333.555035285725 Dec: -26.6056164508738 [deg; J2000]
Refined Position: [ source = BAT pre-slew burst ]
RA: 333.569946892619 Dec: -26.6012273042789 [deg; J2000]
{ 22h 14m 16.8s , -26d 36' 04.4" }
+/- 1.96728534534086 [arcmin] (estimated 90% radius based on SNR)
+/- 0.852833506300009 [arcmin] (formal 1-sigma fit error)
SNR: 11.5693209772609
Angular difference between the analysis and refined position is 0.842205 arcmin
Partial Coding Fraction: 0.1621094 [ including projection effects ]
Duration
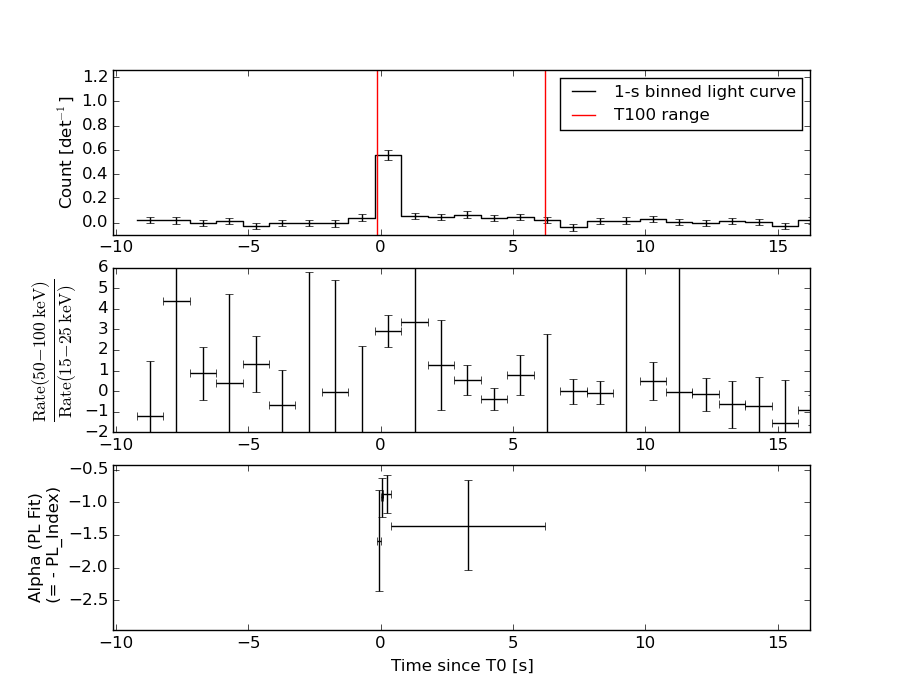
T90: 5.66399997472763 +/- 1.87637094392059
Measured from: -0.0160000026226044
to: 5.64799997210503 [s; relative to TRIGTIME]
T50: 0.399999976158142 +/- 1.68830328395208
Measured from: 0.0480000078678131
to: 0.447999984025955 [s; relative to TRIGTIME]
Fluence
Peak Flux (peak 1 second)
Measured from: -0.315999984741211
to: 0.684000015258789 [s; relative to TRIGTIME]
Total Fluence
Measured from: -0.127999991178513
to: 6.22400000691414 [s; relative to TRIGTIME]
Band 1 Band 2 Band 3 Band 4
15-25 25-50 50-100 100-350 keV
Total 0.168837 0.224745 0.281819 0.170928
0.036318 0.039376 0.036786 0.033040 [error]
Peak 0.074758 0.169725 0.210696 0.108734
0.017892 0.020330 0.021817 0.020422 [error]
[ fluence units of on-axis counts / fully illuminated detector ]
======================================================================
====== Table of the duration information =============================
Value tstart tstop
T100 6.352 -0.128 6.224
T90 5.664 -0.016 5.648
T50 0.400 0.048 0.448
Peak 1.000 -0.316 0.684
====== Spectral Analysis Summary =====================================
Model : spectral model: simple power-law (PL) and cutoff power-law (CPL)
Ph_index : photon index: E^{Ph_index}
Ph_90err : 90% error of the photon index
Epeak : Epeak in keV
Epeak_90err: 90% error of Epeak
Norm : normalization at 50 keV in both the PL model and CPL model
Nomr_90err : 90% error of the normalization
chi2 : Chi-Squared
dof : degree of freedo
=== Time-averaged spectral analysis ===
(Best model with acceptable fit: PL)
Model Ph_index Ph_90err_low Ph_90err_hi Epeak Epeak_90err_low Epeak_90err_hi Norm Nomr_90err_low Norm_90err_hi chi2 dof
PL -1.062 -0.259 0.274 - - - 9.18e-03 -1.37e-03 1.34e-03 52.450 57
CPL -1.055 -0.263 0.334 9999.270 -9999.270 -9999.270 9.21e-03 -1.32e-03 8.34e-03 52.460 56
=== 1-s peak spectral analysis ===
(Best model with acceptable fit: N/A)
Model Ph_index Ph_90err_low Ph_90err_hi Epeak Epeak_90err_low Epeak_90err_hi Norm Nomr_90err_low Norm_90err_hi chi2 dof
PL -0.895 -0.203 0.212 - - - 3.83e-02 -4.70e-03 4.64e-03 46.160 57
CPL -0.567 -0.426 0.924 264.487 -264.487 -264.487 5.27e-02 -1.82e-02 7.07e-02 45.650 56
=== Fluence/Peak Flux Summary ===
Model Band1 Band2 Band3 Band4 Band5 Total
15-25 25-50 50-100 100-350 15-150 15-350 keV
Fluence PL 4.95e-08 1.19e-07 2.28e-07 1.07e-06 6.17e-07 1.46e-06 erg/cm2
90%_error_low -1.50e-08 -2.28e-08 -3.47e-08 -3.40e-07 -9.02e-08 -3.57e-07 erg/cm2
90%_error_hi 1.67e-08 2.21e-08 3.42e-08 4.44e-07 9.04e-08 4.45e-07 erg/cm2
Peak flux PL 1.83e-04 3.25e-03 2.40e-02 3.32e+00 1.65e-01 3.16e+00 ph/cm2/s
90%_error_low 6.00e-05 -2.36e-04 1.01e-02 -3.60e-01 -1.02e-02 -1.52e-01 ph/cm2/s
90%_error_hi 4.75e-04 4.10e-03 5.07e-02 2.06e+00 1.56e-01 2.31e+00 ph/cm2/s
Fluence CPL 4.94e-08 1.19e-07 2.24e-07 1.08e-06 6.19e-07 1.38e-06 erg/cm2
90%_error_low N/A -2.33e-08 -3.84e-08 -6.10e-07 -1.12e-07 -5.15e-07 erg/cm2
90%_error_hi N/A 2.19e-08 5.02e-08 1.90e-07 1.09e-07 5.14e-07 erg/cm2
Peak flux CPL 8.04e-01 1.29e+00 1.44e+00 2.03e+00 4.34e+00 5.57e+00 ph/cm2/s
90%_error_low -2.79e-01 -2.14e-01 -2.09e-01 -1.01e+00 -5.50e-01 -1.19e+00 ph/cm2/s
90%_error_hi 2.85e-01 2.16e-01 2.21e-01 9.57e-01 5.52e-01 1.16e+00 ph/cm2/s
======================================================================
Image
Pre-slew 15.0-350.0 keV image (Event data)
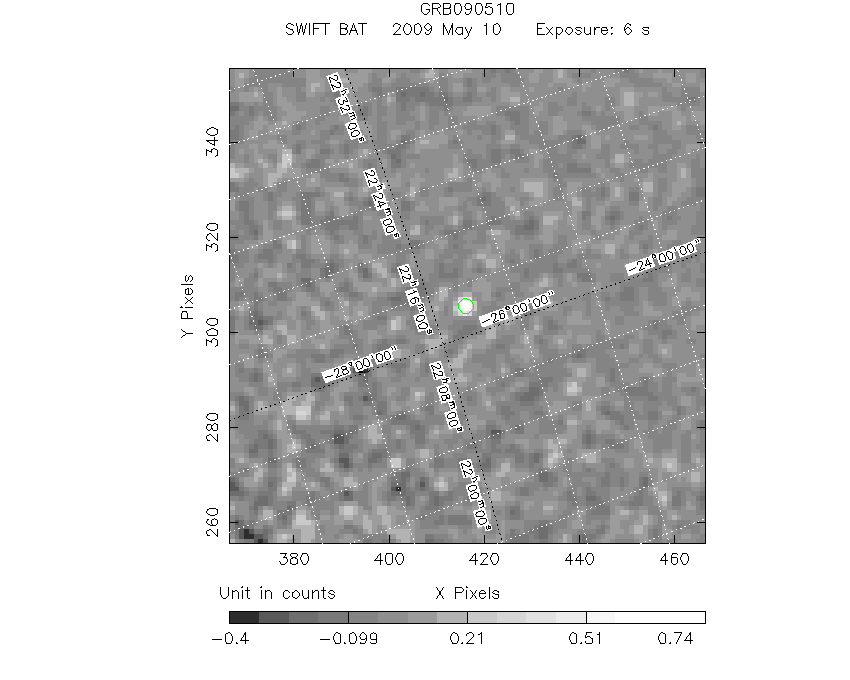
#   RAcent    DECcent   POSerr    Theta     Phi              Peak Cts       SNR   Name
  333.5699   -26.6012   0.0165    46.0716    20.2673         0.9025207     11.569 TRIG_00351588

Foreground time interval of the image:
 -0.128   6.224 (delta_t =   6.352 [sec])
Background time interval of the image:
-212.715  -0.128 (delta_t = 212.587 [sec])
Light Curves
Note: The mask-weighted lightcurves have units of either count/det or counts/sec/det, where a det is 0.4 x 0.4 = 0.16 sq cm.
Full-time range; 1 s binning
Other quick-look light curves:
- 64 ms binning (zoomed)
- 16 ms binning (zoomed)
- 8 ms binning (zoomed)
- 2 ms binning (zoomed)
- SN=5 or 10 s binning (full-time range)
- Raw light curve
Spectra
- 64 ms binning (zoomed)
- 16 ms binning (zoomed)
- 8 ms binning (zoomed)
- 2 ms binning (zoomed)
- SN=5 or 10 s binning (full-time range)
- Raw light curve
Spectra
Notes:
- 1) The fitting includes the systematic errors.
- 2) When the burst includes telescope slew time periods, the fitting uses an average response file made from multiple 5-s response files through out the slew time plus single time preiod for the non-slew times, and weighted by the total counts in the corresponding time period using addrmf. An average response file is needed becuase a spectral fit using the pre-slew DRM will introduce some errors in both a spectral shape and a normalization if the PHA file contains a lot of the slew/post-slew time interval.
- 3) For fits to more complicated models (e.g. a power-law over a cutoff power-law), the BAT team has decided to require a chi-square improvement of more than 6 for each extra dof.
Time averaged spectrum fit using the average DRM
Power-law model
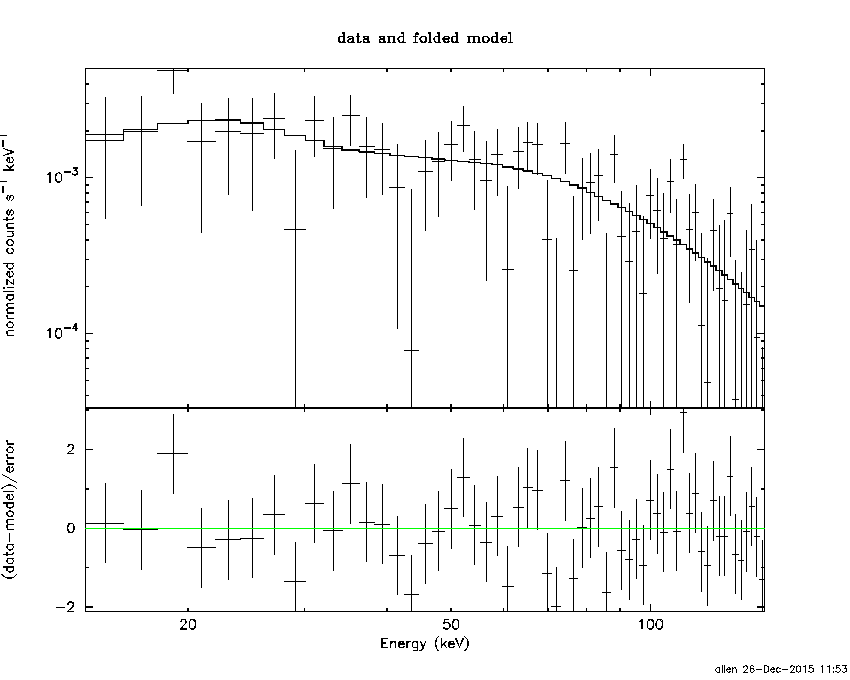
Time interval is from   -0.128 sec. to    6.224 sec.

Spectral model in power-law:
------------------------------------------------------------
Parameters  : value       lower 90%   higher 90%
Photon index: -1.06233     ( -0.259139   0.273625 )
Norm@50keV  : 9.17981E-03    ( -0.00136551   0.00134233 )
------------------------------------------------------------
#Fit statistic : Chi-Squared =          52.45 using 59 PHA bins.
# Reduced chi-squared =         0.9201 for     57 degrees of freedom
# Null hypothesis probability =   6.463856e-01

Photon flux (15-150 keV)    in 6.352 sec: 1.06125 ( -0.163754  0.16494 ) ph/cm2/s
Energy fluence (15-150 keV)             : 6.17249e-07 ( -9.02492e-08  9.03877e-08 ) ergs/cm2
Cutoff power-law model

Time interval is from   -0.128 sec. to    6.224 sec.
Spectral model in the cutoff power-law:
------------------------------------------------------------
Parameters  : value       lower 90%   higher 90%
Photon index: -1.05505     ( -0.262404   0.334024 )
Epeak [keV] : 9999.27      ( -9999.35 -9999.35 )
Norm@50keV  : 9.20748E-03    ( -0.00134348   0.00832292 )
------------------------------------------------------------
#Fit statistic : Chi-Squared =          52.46 using 59 PHA bins.
# Reduced chi-squared =         0.9368 for     56 degrees of freedom
# Null hypothesis probability =   6.096704e-01

Photon flux (15-150 keV)    in 6.352 sec: 1.06115 ( -0.163913  0.16478 ) ph/cm2/s
Energy fluence (15-150 keV)             : 6.18729e-07 ( -1.11621e-07  1.08817e-07 ) ergs/cm2
1-s peak spectrum fit
Power-law model
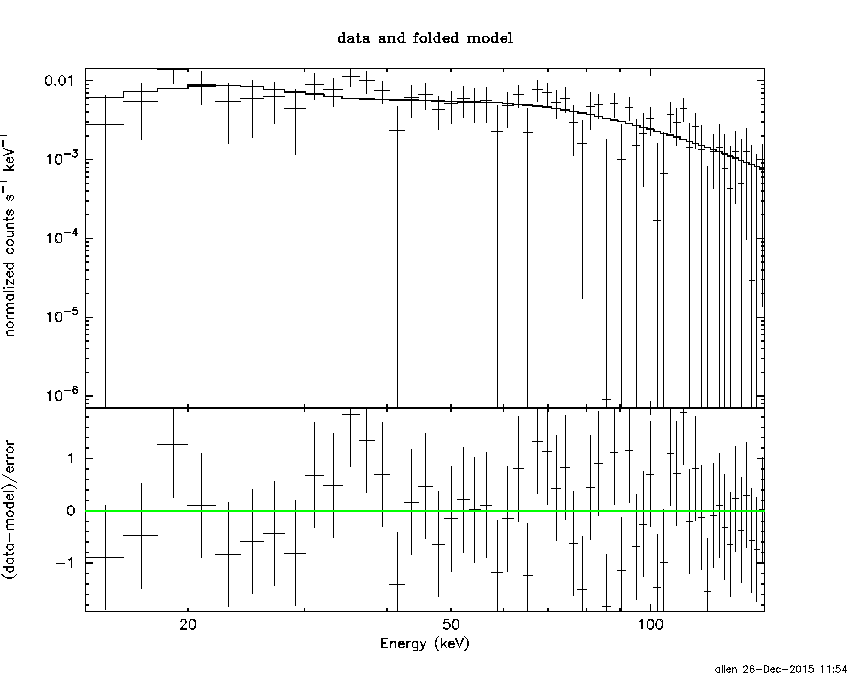
Time interval is from   -0.316 sec. to    0.684 sec.

Spectral model in power-law:
------------------------------------------------------------
Parameters  : value       lower 90%   higher 90%
Photon index: -0.894917     ( -0.20321   0.212476 )
Norm@50keV  : 3.82889E-02    ( -0.00469858   0.00464467 )
------------------------------------------------------------
#Fit statistic : Chi-Squared =          46.16 using 59 PHA bins.
# Reduced chi-squared =         0.8098 for     57 degrees of freedom
# Null hypothesis probability =   8.472341e-01

Photon flux (15-150 keV)    in 1 sec: 0.164894 0.178393 0.176148 0.174435 0.116712 8.00906E-02 5.84951E-02 4.61459E-02 3.90215E-02 3.47509E-02 3.03627E-02 2.57601E-02 (    ) ph/cm2/s
Energy fluence (15-150 keV)             : 4.30606e-07 ( -5.30251e-08  5.31986e-08 ) ergs/cm2
Cutoff power-law model
Time interval is from   -0.316 sec. to    0.684 sec.
Spectral model in the cutoff power-law:
------------------------------------------------------------
Parameters  : value       lower 90%   higher 90%
Photon index: -0.567263     ( -0.426077   0.923741 )
Epeak [keV] : 264.487      ( -264.487 -264.487 )
Norm@50keV  : 5.27062E-02    ( -0.0182405   0.0707348 )
------------------------------------------------------------
#Fit statistic : Chi-Squared =          45.65 using 59 PHA bins.
# Reduced chi-squared =         0.8153 for     56 degrees of freedom
# Null hypothesis probability =   8.367374e-01

Photon flux (15-150 keV)    in 1 sec: 4.34206 ( -0.55041  0.55216 ) ph/cm2/s
Energy fluence (15-150 keV)             : 4.26167e-07 ( -5.53155e-08  5.4617e-08 ) ergs/cm2
Time-resolved spectra
Distribution
T90 vs. Hardness ratio plot
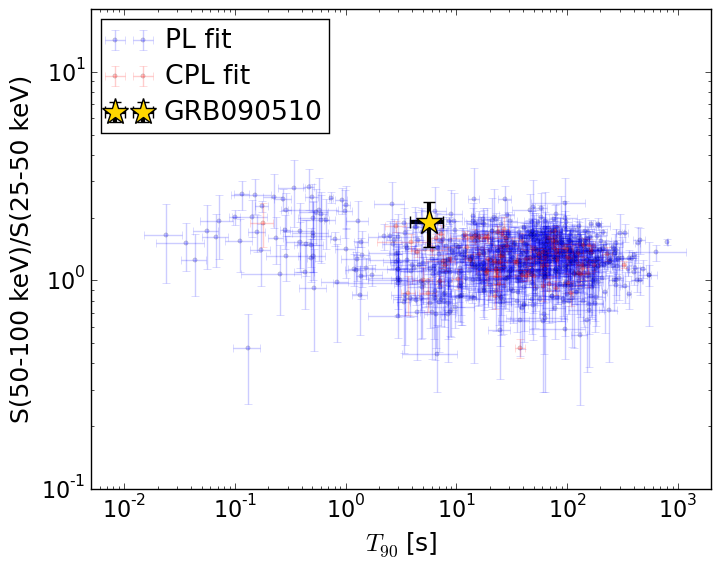
T90                                   = 5.664 sec.
Hardness ratio (energy fluence ratio) = 1.91544588007
S(15-50 keV) vs. S(50-150 keV) plot
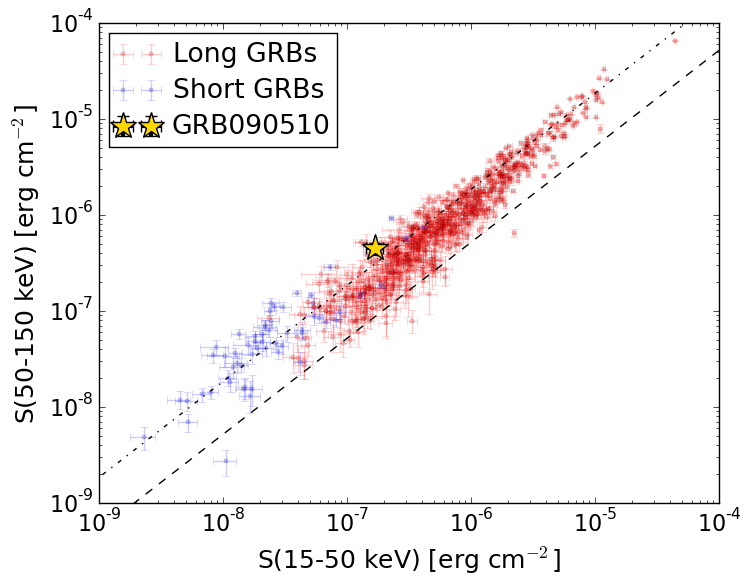
S(15-50 keV)  = 1.6853587e-07
S(50-150 keV) = 4.487127e-07
The dash-dotted line and the dashed line traces the fluences calculated from the Band function with Epeak = 15 and 150 keV, respectively. Both lines assume a canonical values of alpha = -1 and beta = -2.5.
Mask shadow pattern
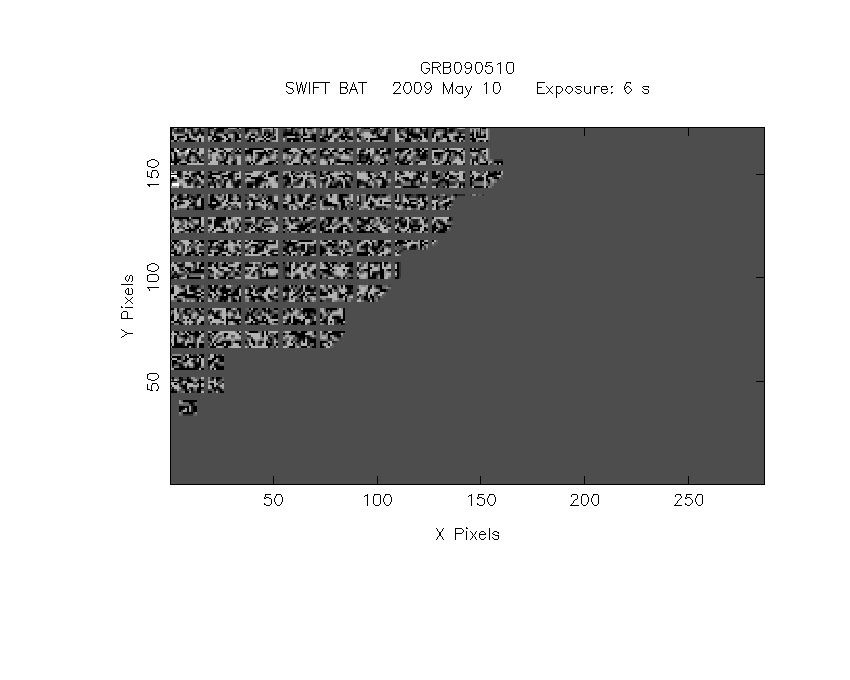
IMX = 9.738492822632381E-01, IMY = -3.596064605939755E-01
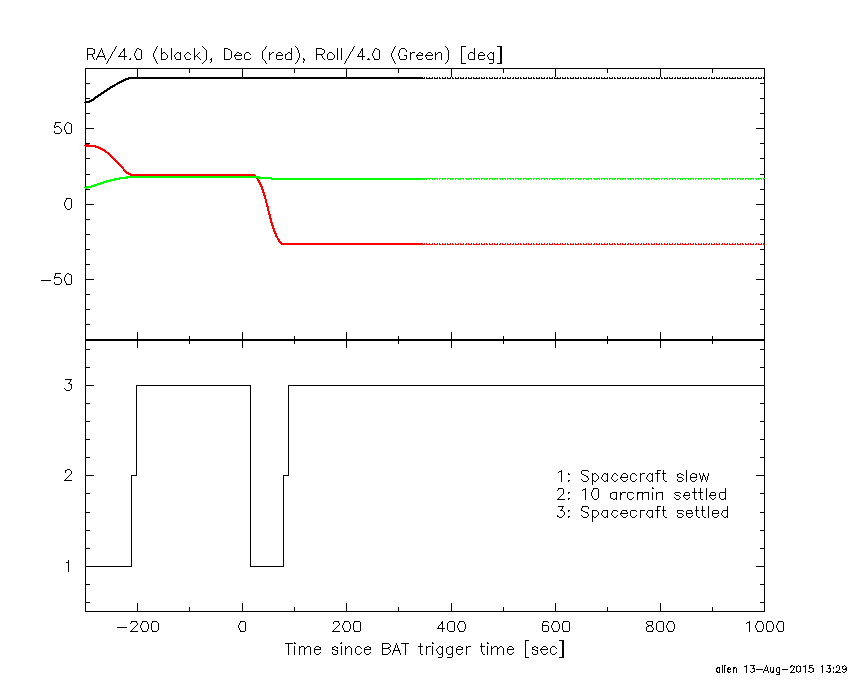
Spacecraft aspect plot
Bright source in the pre-burst/pre-slew/post-slew images
Pre-burst image of 15-350 keV band
Time interval of the image:
-212.715400 -0.128000

# RAcent  DECcent POSerr Theta    Phi  PeakCts   SNR AngSep     Name
#  [deg]    [deg]    ['] [deg]  [deg]                   [']
299.5797  35.1877    0.5  34.7  143.2   7.1896  23.9    1.0	Cyg X-1
308.0275  40.9324    1.9  31.2  158.2   1.4273   6.0    3.9	Cyg X-3
326.1242  38.2501    8.6  20.2  179.2   0.2327   1.3    4.8	Cyg X-2
344.0508 -18.5084    2.1  39.1    4.7   1.5026   5.6 ------	UNKNOWN
347.0993  -1.7928    2.1  24.5  -12.4   0.9835   5.4 ------	UNKNOWN
351.7921  31.3488    2.7  19.5 -112.1   0.7462   4.3 ------	UNKNOWN
 18.5931   9.2361    3.0  43.6  -64.0   3.4926   3.8 ------	UNKNOWN
Pre-slew background subtracted image of 15-350 keV band
Time interval of the image:
-0.128000 6.224000

# RAcent  DECcent POSerr Theta    Phi  PeakCts   SNR AngSep     Name
#  [deg]    [deg]    ['] [deg]  [deg]                   [']
299.5288  35.3447    4.1  34.7  143.5  -0.1322  -2.8    9.1	Cyg X-1
308.0613  41.0511    3.1  31.3  158.4   0.1296   3.7    6.3	Cyg X-3
326.0816  38.1283    0.0  20.1  179.0  -0.0460  -1.8   12.4	Cyg X-2
312.6863 -14.8924    2.5  40.6   52.7   0.4419   4.7 ------	UNKNOWN
333.5700 -26.6012    1.0  46.1   20.3   0.9024  11.6 ------	UNKNOWN
  1.7474  76.2894    2.7  58.5 -153.8   0.6752   4.3 ------	UNKNOWN
Post-slew image of 15-350 keV band
Time interval of the image:
78.284590 962.844000

# RAcent  DECcent POSerr Theta    Phi  PeakCts   SNR AngSep     Name
#  [deg]    [deg]    ['] [deg]  [deg]                   [']
 35.8112 -41.4906    3.1  52.5  -33.3   6.1886   3.8 ------	UNKNOWN
350.0788  19.2221    2.8  48.6 -135.7   7.9176   4.2 ------	UNKNOWN