Analysis Summary
Notes:
- 1) No attempt has been made to eliminate the non-significant decimal places.
- 2) This batgrbproduct analysis is done using the HEASARC data.
- 3) This batgrbproduct analysis is using the flight position for the mask-weighting calculation.
======================================================================
                  BAT GRB EVENT DATA PROCESSING REPORT
    Process Script Ver: batgrbproduct v2.46
    Process Start Time: Sun Jan 19 16:46:19 EST 2014
             Host Name: batevent1
   Current Working Dir: /local/data/batevent/batevent_reproc/trigger352108
======================================================================

  Trigger: 00352108      Segment: 000

  BAT Trigger Time: 264055514.268   [s; MET]
      Trigger Stop: 264055514.3   [s; MET]
               UTC: 2009-05-15T04:45:09.525600    [includes UTCF correction]
       Where From?: (*SHORT BURST*) TDRSS scaled map message

  BAT
    RA: 164.170933861596   Dec: 14.4560193879202  [deg; J2000]

     Catalogged Source?: NO
     Point Source?:      YES
     GRB Indicated?:     YES    [ by BAT flight software ]
     Image S/N Ratio:    9.79
     Image Trigger?:     NO
     Rate S/N Ratio:     38.3927076409049  [ if not an image trigger ]
     Image S/N Ratio:    9.79

  Analysis Position:   [ source = BAT ]
    RA: 164.170933861596   Dec: 14.4560193879202  [deg; J2000]

  Refined Position:   [ source = BAT pre-slew burst ]
    RA: 164.164418927944   Dec: 14.4658259660496  [deg; J2000]
        { 10h 56m 39.5s , +14d 27' 57.0" }
         +/- 2.03775967718021 [arcmin] (estimated 90% radius based on SNR)
         +/- 1.05812041502137 [arcmin] (formal 1-sigma fit error)
    SNR: 11.0019910723503

  Angular difference between the analysis and refined position is 0.699628 arcmin

  Partial Coding Fraction: 0.8671875    [ including projection effects ]

  Duration
     T90: 0.0360000133514404 +/- 0.0164924197847099
        Measured from: 0.00799998641014099
                   to: 0.0439999997615814     [s; relative to TRIGTIME]
     T50: 0.0160000026226044 +/- 0.00894426338008669
        Measured from: 0.0119999945163727
                   to: 0.0279999971389771     [s; relative to TRIGTIME]


  Fluence
     Peak Flux  (peak 1 second)
        Measured from: -0.466000020503998
                   to: 0.533999979496002     [s; relative to TRIGTIME]
     Total Fluence
        Measured from: 0.00799998641014099
                   to: 0.0559999942779541     [s; relative to TRIGTIME]

             Band 1     Band 2     Band 3     Band 4
              15-25      25-50     50-100    100-350     keV
 Total     0.009441   0.015846   0.012522   0.003094
           0.001881   0.002204   0.001982   0.001368 [error]
 Peak      0.009261   0.012798   0.014347  -0.003497
           0.005589   0.005669   0.005274   0.004272 [error]

     [ fluence units of on-axis counts / fully illuminated detector ]

======================================================================


====== Table of the duration information =============================

        Value   tstart    tstop
T100    0.048    0.008    0.056
T90     0.036    0.008    0.044
T50     0.016    0.012    0.028
Peak    1.000   -0.466    0.534


====== Spectral Analysis Summary =====================================

Model      : spectral model: simple power-law (PL) and cutoff power-law (CPL)
Ph_index   : photon index: E^{Ph_index}
Ph_90err   : 90% error of the photon index
Epeak      : Epeak in keV
Epeak_90err: 90% error of Epeak
Norm       : normalization at 50 keV in both the PL model and CPL model
Nomr_90err : 90% error of the normalization
chi2       : Chi-Squared
dof        : degree of freedo

=== Time-averaged spectral analysis ===
(Best model with acceptable fit: PL)

Model Ph_index Ph_90err_low Ph_90err_hi  Epeak  Epeak_90err_low  Epeak_90err_hi  Norm       Nomr_90err_low    Norm_90err_hi    chi2    dof
PL      -1.409    -0.238      0.233       -           -               -         4.82e-02     -7.89e-03          7.87e-03      44.740   57
CPL     -0.151    -1.002      1.273       79.757     -19.313        93.954      1.96e-01     -1.96e-01          5.61e-01      39.990   56


=== 1-s peak spectral analysis ===
(Best model with acceptable fit: N/A)

Model Ph_index Ph_90err_low Ph_90err_hi  Epeak  Epeak_90err_low  Epeak_90err_hi  Norm       Nomr_90err_low    Norm_90err_hi    chi2    dof
PL      -1.019     -0.739     0.838       -           -               -         2.56e-03     -1.12e-03          1.09e-03      56.440   57
CPL     -0.333      0.333     5.081      137.778    -137.778      -137.778      5.22e-03     -5.22e-03          1.54e+00      56.270   56


=== Fluence/Peak Flux Summary ===

              Model    Band1     Band2     Band3     Band4     Band5     Total
                       15-25     25-50    50-100    100-350    15-150    15-350    keV
Fluence         PL   2.71e-09  5.27e-09  7.94e-09  2.59e-08  2.23e-08  4.18e-08   erg/cm2
      90%_error_low -6.67e-10 -9.02e-10 -1.56e-09 -8.88e-09 -3.92e-09 -1.05e-08   erg/cm2
      90%_error_hi   7.04e-10  8.94e-10  1.53e-09  1.10e-08  3.93e-09  1.21e-08   erg/cm2
Peak flux       PL   6.67e-02  8.94e-02  8.83e-02  1.57e-01  2.96e-01  4.01e-01   ph/cm2/s
      90%_error_low -4.75e-02 -4.85e-02 -4.08e-02 -1.57e-01 -1.28e-01 -1.75e-01   ph/cm2/s
      90%_error_hi   6.52e-02  4.66e-02  3.97e-02  2.17e-01  1.30e-01  1.98e-01   ph/cm2/s

Fluence        CPL   2.16e-09  6.07e-09  9.30e-09  7.70e-09  2.21e-08  2.52e-08   erg/cm2
      90%_error_low -7.91e-10 -1.14e-09 -1.99e-09 -4.75e-09 -4.05e-09 -6.14e-09   erg/cm2
      90%_error_hi   8.32e-10  1.19e-09  2.07e-09  1.20e-08  4.04e-09  1.16e-08   erg/cm2
Peak flux      CPL   5.59e-02  9.28e-02  9.53e-02  8.34e-02  2.87e-01  3.27e-01   ph/cm2/s
      90%_error_low -5.59e-02 -9.28e-02 -4.62e-02 -8.34e-02 -1.31e-01 -1.68e-01   ph/cm2/s
      90%_error_hi   7.35e-02  5.63e-02  5.22e-02  1.05e-01  1.34e-01  2.48e-01   ph/cm2/s

======================================================================
Image
Pre-slew 15.0-350.0 keV image (Event data)
#   RAcent    DECcent   POSerr    Theta     Phi              Peak Cts       SNR   Name
  164.1644    14.4658   0.0175    21.9041    20.5417         0.0421650     11.002 TRIG_00352108

Foreground time interval of the image:
  0.008   0.056 (delta_t =   0.048 [sec])
Background time interval of the image:
-100.167   0.008 (delta_t = 100.175 [sec])
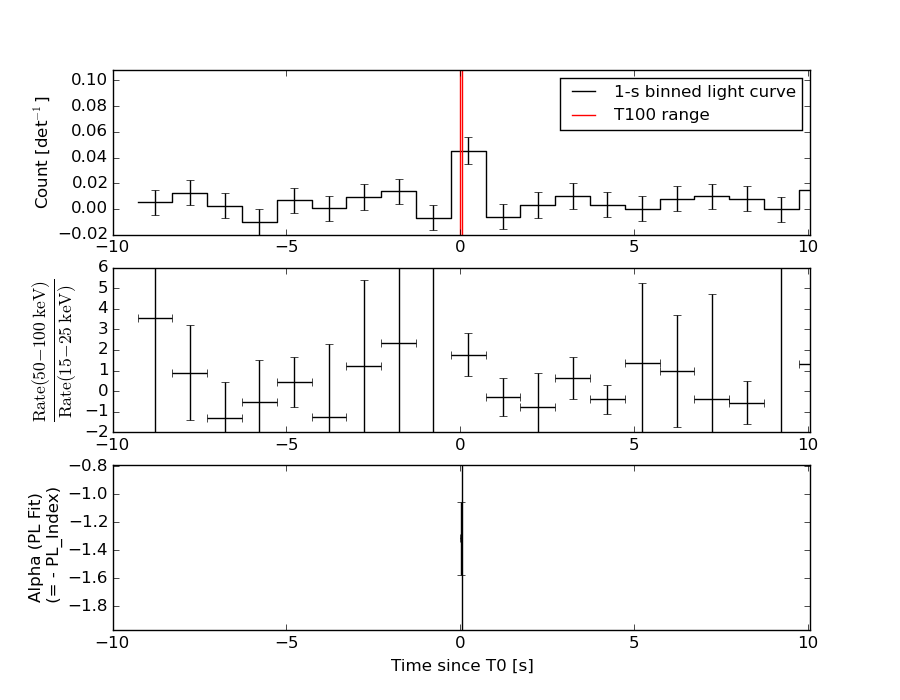
Light Curves
Note: The mask-weighted lightcurves have units of either count/det or counts/sec/det, where a det is 0.4 x 0.4 = 0.16 sq cm.
Full-time range; 1 s binning
Other quick-look light curves:
- 64 ms binning (zoomed)
- 16 ms binning (zoomed)
- 8 ms binning (zoomed)
- 2 ms binning (zoomed)
- SN=5 or 10 s binning (full-time range)
- Raw light curve
Spectra
- 64 ms binning (zoomed)
- 16 ms binning (zoomed)
- 8 ms binning (zoomed)
- 2 ms binning (zoomed)
- SN=5 or 10 s binning (full-time range)
- Raw light curve
Spectra
Notes:
- 1) The fitting includes the systematic errors.
- 2) When the burst includes telescope slew time periods, the fitting uses an average response file made from multiple 5-s response files through out the slew time plus single time preiod for the non-slew times, and weighted by the total counts in the corresponding time period using addrmf. An average response file is needed becuase a spectral fit using the pre-slew DRM will introduce some errors in both a spectral shape and a normalization if the PHA file contains a lot of the slew/post-slew time interval.
- 3) For fits to more complicated models (e.g. a power-law over a cutoff power-law), the BAT team has decided to require a chi-square improvement of more than 6 for each extra dof.
Time averaged spectrum fit using the average DRM
Power-law model
Time interval is from    0.008 sec. to    0.056 sec.

Spectral model in power-law:
------------------------------------------------------------
Parameters  : value       lower 90%   higher 90%
Photon index: -1.40896     ( -0.237794   0.233253 )
Norm@50keV  : 4.81823E-02    ( -0.00788995   0.00787016 )
------------------------------------------------------------
#Fit statistic : Chi-Squared =          44.74 using 59 PHA bins.
# Reduced chi-squared =         0.7850 for     57 degrees of freedom
# Null hypothesis probability =   8.807372e-01

Photon flux (15-150 keV)    in 0.048 sec: 5.87988 ( -0.96951  0.97055 ) ph/cm2/s
Energy fluence (15-150 keV)             : 2.23096e-08 ( -3.91622e-09  3.93086e-09 ) ergs/cm2
Cutoff power-law model
Time interval is from    0.008 sec. to    0.056 sec.
Spectral model in the cutoff power-law:
------------------------------------------------------------
Parameters  : value       lower 90%   higher 90%
Photon index: -0.151045     ( -1.00202   1.27295 )
Epeak [keV] : 79.7569      ( -19.3128 93.9538 )
Norm@50keV  : 0.195515    ( -0.195515   0.561146 )
------------------------------------------------------------
#Fit statistic : Chi-Squared =          39.99 using 59 PHA bins.
# Reduced chi-squared =         0.7141 for     56 degrees of freedom
# Null hypothesis probability =   9.476776e-01

Photon flux (15-150 keV)    in 0.048 sec: 5.83860 ( -0.97639  0.97634 ) ph/cm2/s
Energy fluence (15-150 keV)             : 2.21387e-08 ( -4.04688e-09  4.04204e-09 ) ergs/cm2
1-s peak spectrum fit
Power-law model

Time interval is from   -0.466 sec. to    0.534 sec.

Spectral model in power-law:
------------------------------------------------------------
Parameters  : value       lower 90%   higher 90%
Photon index: -1.01852     ( -0.738818   0.838218 )
Norm@50keV  : 2.56406E-03    ( -0.00112072   0.00109195 )
------------------------------------------------------------
#Fit statistic : Chi-Squared =          56.44 using 59 PHA bins.
# Reduced chi-squared =         0.9903 for     57 degrees of freedom
# Null hypothesis probability =   4.958786e-01

Photon flux (15-150 keV)    in 1 sec: 0.295508 ( -0.128141  0.129919 ) ph/cm2/s
Energy fluence (15-150 keV)             : 2.75499e-08 ( -1.23097e-08  1.2619e-08 ) ergs/cm2
Cutoff power-law model
Time interval is from   -0.466 sec. to    0.534 sec.
Spectral model in the cutoff power-law:
------------------------------------------------------------
Parameters  : value       lower 90%   higher 90%
Photon index: -0.332599     ( 0.332635   5.08098 )
Epeak [keV] : 137.778      ( -137.781 -137.781 )
Norm@50keV  : 5.21760E-03    ( -0.00521745   1.53631 )
------------------------------------------------------------
#Fit statistic : Chi-Squared =          56.27 using 59 PHA bins.
# Reduced chi-squared =          1.005 for     56 degrees of freedom
# Null hypothesis probability =   4.649157e-01

Photon flux (15-150 keV)    in 1 sec: 0.287492 ( -0.130847  0.133628 ) ph/cm2/s
Energy fluence (15-150 keV)             : 2.65938e-08 ( -1.34791e-08  1.382e-08 ) ergs/cm2
Time-resolved spectra
Distribution
T90 vs. Hardness ratio plot
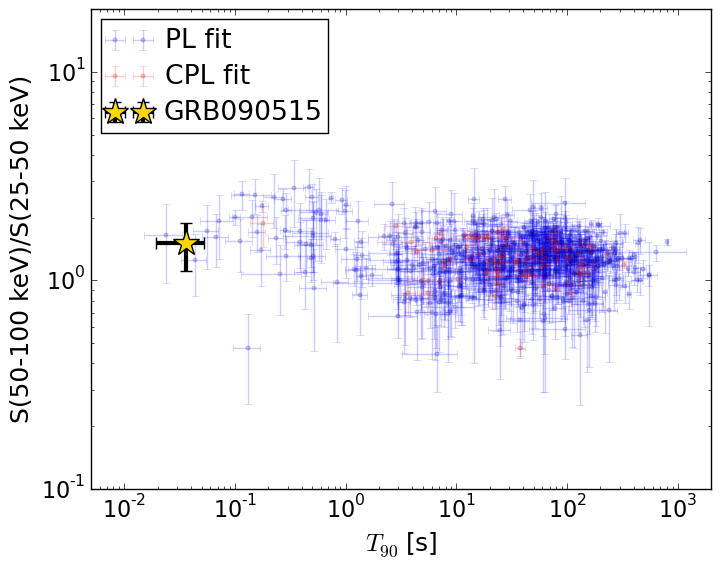
T90                                   = 0.03600001 sec.
Hardness ratio (energy fluence ratio) = 1.50632939744
S(15-50 keV) vs. S(50-150 keV) plot
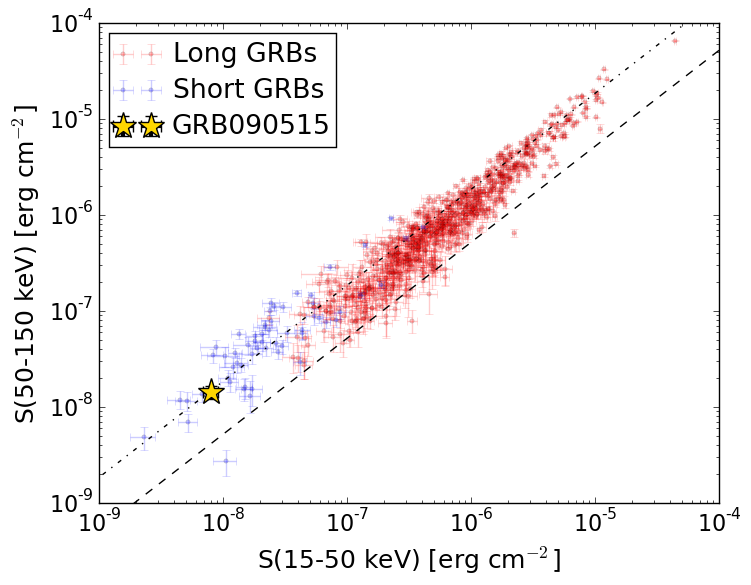
S(15-50 keV)  = 7.980254e-09
S(50-150 keV) = 1.4329239e-08
The dash-dotted line and the dashed line traces the fluences calculated from the Band function with Epeak = 15 and 150 keV, respectively. Both lines assume a canonical values of alpha = -1 and beta = -2.5.
Mask shadow pattern
IMX = 3.765145791083049E-01, IMY = -1.410852250382248E-01
Spacecraft aspect plot

Bright source in the pre-burst/pre-slew/post-slew images
Pre-burst image of 15-350 keV band
Time interval of the image:
-100.167400 0.008000

# RAcent  DECcent POSerr Theta    Phi  PeakCts   SNR AngSep     Name
#  [deg]    [deg]    ['] [deg]  [deg]                   [']
135.5520 -40.5878    1.5  42.3  164.5   1.3653   7.6    2.3	Vela X-1
117.9707 -50.2739    2.7  56.5  173.3   2.6944   4.2 ------	UNKNOWN
123.7540 -29.7594    2.5  37.5 -174.1   0.6076   4.7 ------	UNKNOWN
Pre-slew background subtracted image of 15-350 keV band
Time interval of the image:
0.008000 0.056000

# RAcent  DECcent POSerr Theta    Phi  PeakCts   SNR AngSep     Name
#  [deg]    [deg]    ['] [deg]  [deg]                   [']
135.5135 -40.6185    5.7  42.4  164.5  -0.0122  -2.0    3.9	Vela X-1
155.7681 -22.0505    2.7  23.9  131.4   0.0181   4.3 ------	UNKNOWN
164.1644  14.4658    1.1  21.9   20.5   0.0422  11.0 ------	UNKNOWN
116.2102 -34.5550    2.5  45.4 -172.1   0.0255   4.6 ------	UNKNOWN
Post-slew image of 15-350 keV band
Time interval of the image:
52.832600 962.783500

# RAcent  DECcent POSerr Theta    Phi  PeakCts   SNR AngSep     Name
#  [deg]    [deg]    ['] [deg]  [deg]                   [']
210.7524  43.3167    2.3  49.0   20.0   8.3299   5.0 ------	UNKNOWN
164.4606 -26.5279    2.6  41.0  155.1   4.2118   4.5 ------	UNKNOWN
190.7676  46.6979    2.9  39.1    4.7   2.6279   4.0 ------	UNKNOWN
171.9713  51.2562    2.8  37.3  -16.4   2.3165   4.2 ------	UNKNOWN
131.2189  -1.1523    4.4  36.2 -137.3   1.7203   2.7 ------	UNKNOWN
129.0817  52.3974    3.2  47.0  -53.1   7.9407   3.6 ------	UNKNOWN