Analysis Summary
Notes:
- 1) No attempt has been made to eliminate the non-significant decimal places.
- 2) This batgrbproduct analysis is done using the HEASARC data.
- 3) This batgrbproduct analysis is using the flight position for the mask-weighting calculation.
======================================================================
BAT GRB EVENT DATA PROCESSING REPORT
Process Script Ver: batgrbproduct v2.46
Process Start Time: Sun May 10 18:34:38 EDT 2015
Host Name: bat1
Current Working Dir: /local/data/bat1/alien/Swift_3rdBATcatalog/event/batevent_reproc/trigger352190
======================================================================
Trigger: 00352190 Segment: 000
BAT Trigger Time: 264155275.52 [s; MET]
Trigger Stop: 264155302.4 [s; MET]
UTC: 2009-05-16T08:27:50.774420 [includes UTCF correction]
Where From?: TDRSS position message
BAT
RA: 138.27070715192 Dec: -11.8577686574517 [deg; J2000]
Catalogged Source?: NO
Point Source?: YES
GRB Indicated?: YES [ by BAT flight software ]
Image S/N Ratio: 8.83
Image Trigger?: NO
Rate S/N Ratio: 14.1067359796659 [ if not an image trigger ]
Image S/N Ratio: 8.83
Analysis Position: [ source = BAT ]
RA: 138.27070715192 Dec: -11.8577686574517 [deg; J2000]
Refined Position: [ source = BAT pre-slew burst ]
RA: 138.254422253179 Dec: -11.855054128057 [deg; J2000]
{ 09h 13m 01.1s , -11d 51' 18.2" }
+/- 1.65577330511421 [arcmin] (estimated 90% radius based on SNR)
+/- 0.676737277251186 [arcmin] (formal 1-sigma fit error)
SNR: 14.7999410315788
Angular difference between the analysis and refined position is 0.970019 arcmin
Partial Coding Fraction: 0.06054688 [ including projection effects ]
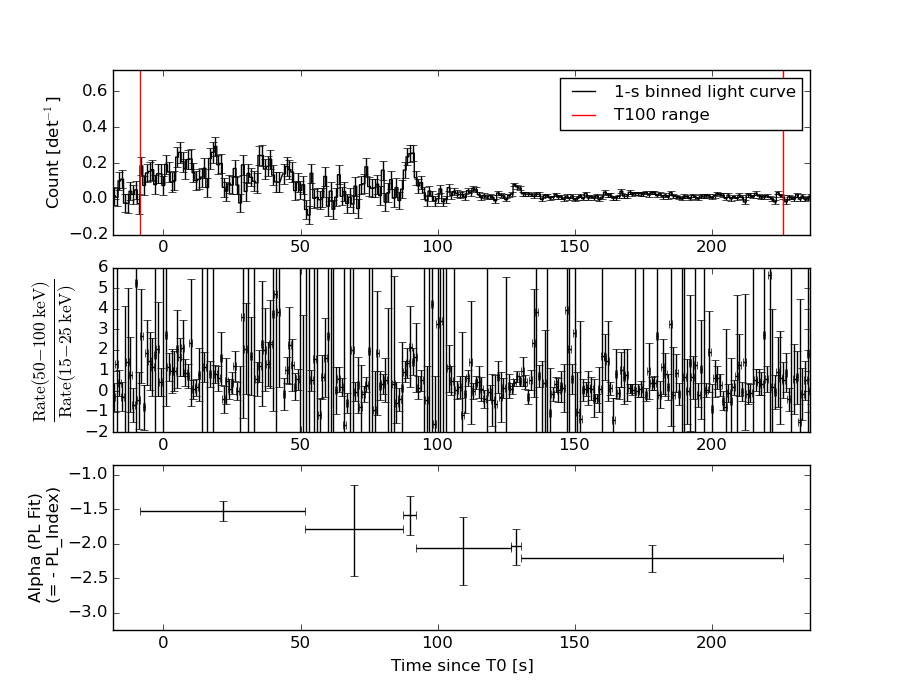
Duration
T90: 181.00799998641 +/- 41.2551374382676
Measured from: -4.27200001478195
to: 176.735999971628 [s; relative to TRIGTIME]
T50: 76.3679999709129 +/- 11.3270620988023
Measured from: 11.7759999930859
to: 88.1439999639988 [s; relative to TRIGTIME]
Fluence
Peak Flux (peak 1 second)
Measured from: 5.15599998831749
to: 6.15599998831749 [s; relative to TRIGTIME]
Total Fluence
Measured from: -8.54399999976158
to: 225.743999987841 [s; relative to TRIGTIME]
Band 1 Band 2 Band 3 Band 4
15-25 25-50 50-100 100-350 keV
Total 3.385923 4.987197 3.492670 1.408950
0.277476 0.294842 0.273270 0.253677 [error]
Peak 0.065860 0.088430 0.131480 0.025508
0.028545 0.030056 0.029860 0.027937 [error]
[ fluence units of on-axis counts / fully illuminated detector ]
======================================================================
====== Table of the duration information =============================
Value tstart tstop
T100 234.288 -8.544 225.744
T90 181.008 -4.272 176.736
T50 76.368 11.776 88.144
Peak 1.000 5.156 6.156
====== Spectral Analysis Summary =====================================
Model : spectral model: simple power-law (PL) and cutoff power-law (CPL)
Ph_index : photon index: E^{Ph_index}
Ph_90err : 90% error of the photon index
Epeak : Epeak in keV
Epeak_90err: 90% error of Epeak
Norm : normalization at 50 keV in both the PL model and CPL model
Nomr_90err : 90% error of the normalization
chi2 : Chi-Squared
dof : degree of freedo
=== Time-averaged spectral analysis ===
(Best model with acceptable fit: PL)
Model Ph_index Ph_90err_low Ph_90err_hi Epeak Epeak_90err_low Epeak_90err_hi Norm Nomr_90err_low Norm_90err_hi chi2 dof
PL -1.673 -0.125 0.124 - - - 4.26e-03 -2.97e-04 2.95e-04 45.650 57
CPL -1.669 -0.499 0.283 9999.070 N/A N/A 4.26e-03 N/A N/A 45.660 56
=== 1-s peak spectral analysis ===
(Best model with acceptable fit: N/A)
Model Ph_index Ph_90err_low Ph_90err_hi Epeak Epeak_90err_low Epeak_90err_hi Norm Nomr_90err_low Norm_90err_hi chi2 dof
PL -2.457 -0.640 0.490 - - - 1.21e-02 -5.51e-03 5.35e-03 76.600 57
CPL 2.828 -3.332 6.766 52.345 -14.035 12.190 3.07e+00 -3.07e+00 1.01e+03 68.220 56
=== Fluence/Peak Flux Summary ===
Model Band1 Band2 Band3 Band4 Band5 Total
15-25 25-50 50-100 100-350 15-150 15-350 keV
Fluence PL 1.49e-06 2.47e-06 3.09e-06 7.73e-06 9.21e-06 1.48e-05 erg/cm2
90%_error_low -1.76e-07 -1.77e-07 -2.83e-07 -1.43e-06 -6.71e-07 -1.66e-06 erg/cm2
90%_error_hi 1.83e-07 1.76e-07 2.81e-07 1.63e-06 6.75e-07 1.81e-06 erg/cm2
Peak flux PL 1.25e+00 7.23e-01 2.64e-01 1.28e-01 2.31e+00 2.37e+00 ph/cm2/s
90%_error_low -5.84e-01 -2.84e-01 -1.40e-01 -1.28e-01 -9.26e-01 -9.32e-01 ph/cm2/s
90%_error_hi 6.40e-01 2.84e-01 1.40e-01 1.32e-01 9.38e-01 9.47e-01 ph/cm2/s
Fluence CPL 1.52e-06 2.45e-06 3.07e-06 7.70e-06 9.28e-06 1.49e-05 erg/cm2
90%_error_low -2.09e-07 -1.86e-07 N/A N/A -7.45e-07 -3.36e-06 erg/cm2
90%_error_hi 1.55e-07 2.11e-07 N/A N/A 5.99e-07 1.71e-06 erg/cm2
Peak flux CPL 3.52e-01 1.03e+00 6.14e-01 3.43e-02 2.02e+00 2.04e+00 ph/cm2/s
90%_error_low -3.52e-01 -5.03e-01 N/A -3.43e-02 -7.98e-01 -8.18e-01 ph/cm2/s
90%_error_hi 7.60e-01 4.22e-01 N/A 6.37e-02 9.31e-01 9.38e-01 ph/cm2/s
======================================================================
Image
Pre-slew 15.0-350.0 keV image (Event data)
#   RAcent    DECcent   POSerr    Theta     Phi              Peak Cts       SNR   Name
  138.2544   -11.8551   0.0128    58.1917  -164.2665         9.1456107     14.800 TRIG_00352190

Foreground time interval of the image:
 -8.544  42.480 (delta_t =  51.024 [sec])
 43.480  80.781 (delta_t =  37.301 [sec])
Background time interval of the image:
-239.520  -8.544 (delta_t = 230.976 [sec])
Light Curves
Note: The mask-weighted lightcurves have units of either count/det or counts/sec/det, where a det is 0.4 x 0.4 = 0.16 sq cm.
Full-time range; 1 s binning
Other quick-look light curves:
- 64 ms binning (zoomed)
- 16 ms binning (zoomed)
- 8 ms binning (zoomed)
- 2 ms binning (zoomed)
- SN=5 or 10 s binning (full-time range)
- Raw light curve
Spectra
- 64 ms binning (zoomed)
- 16 ms binning (zoomed)
- 8 ms binning (zoomed)
- 2 ms binning (zoomed)
- SN=5 or 10 s binning (full-time range)
- Raw light curve
Spectra
Notes:
- 1) The fitting includes the systematic errors.
- 2) When the burst includes telescope slew time periods, the fitting uses an average response file made from multiple 5-s response files through out the slew time plus single time preiod for the non-slew times, and weighted by the total counts in the corresponding time period using addrmf. An average response file is needed becuase a spectral fit using the pre-slew DRM will introduce some errors in both a spectral shape and a normalization if the PHA file contains a lot of the slew/post-slew time interval.
- 3) For fits to more complicated models (e.g. a power-law over a cutoff power-law), the BAT team has decided to require a chi-square improvement of more than 6 for each extra dof.
Time averaged spectrum fit using the average DRM
Power-law model
Multiple GTIs in the spectrum
tstart tstop
-8.544000 42.480000
43.480000 225.744000

Spectral model in power-law:
------------------------------------------------------------
Parameters  : value       lower 90%   higher 90%
Photon index: -1.67279     ( -0.125025   0.123676 )
Norm@50keV  : 4.25551E-03    ( -0.000296576   0.00029525 )
------------------------------------------------------------
#Fit statistic : Chi-Squared =          45.65 using 59 PHA bins.
# Reduced chi-squared =         0.8009 for     57 degrees of freedom
# Null hypothesis probability =   8.597364e-01

Photon flux (15-150 keV)    in 233.3 sec: 0.559936 ( -0.040175  0.04035 ) ph/cm2/s
Energy fluence (15-150 keV)             : 9.21477e-06 ( -6.71484e-07  6.74515e-07 ) ergs/cm2
Cutoff power-law model
Multiple GTIs in the spectrum
tstart tstop
-8.544000 42.480000
43.480000 225.744000
Spectral model in the cutoff power-law:
------------------------------------------------------------
Parameters  : value       lower 90%   higher 90%
Photon index: -2.11838     ( -0.0489578   0.732378 )
Epeak [keV] : 48.7435      (   )
Norm@50keV  : 2.34013E-03    (     )
------------------------------------------------------------
#Fit statistic : Chi-Squared =          45.14 using 59 PHA bins.
# Reduced chi-squared =         0.8060 for     56 degrees of freedom
# Null hypothesis probability =   8.502457e-01

Photon flux (15-150 keV)    in 233.3 sec: 0.563192 ( -0.043652  0.037204 ) ph/cm2/s
Energy fluence (15-150 keV)             : 9.28249e-06 ( -7.44521e-07  5.98594e-07 ) ergs/cm2
1-s peak spectrum fit
Power-law model
Time interval is from    5.156 sec. to    6.156 sec.

Spectral model in power-law:
------------------------------------------------------------
Parameters  : value       lower 90%   higher 90%
Photon index: -2.45739     ( -0.648597   0.48097 )
Norm@50keV  : 1.20634E-02    ( -0.00552423   0.00533364 )
------------------------------------------------------------
#Fit statistic : Chi-Squared =          76.60 using 59 PHA bins.
# Reduced chi-squared =          1.344 for     57 degrees of freedom
# Null hypothesis probability =   4.266422e-02

Photon flux (15-150 keV)    in 1 sec: 2.30729 ( -0.9259  0.93818 ) ph/cm2/s
Energy fluence (15-150 keV)             : 1.19435e-07 ( -4.76556e-08  4.80284e-08 ) ergs/cm2
Cutoff power-law model
Time interval is from    5.156 sec. to    6.156 sec.
Spectral model in the cutoff power-law:
------------------------------------------------------------
Parameters  : value       lower 90%   higher 90%
Photon index: 2.82817     ( -3.3531   6.74468 )
Epeak [keV] : 52.3451      ( -14.3555 11.8692 )
Norm@50keV  : 3.06854    ( -3.26304   1010.83 )
------------------------------------------------------------
#Fit statistic : Chi-Squared =          68.22 using 59 PHA bins.
# Reduced chi-squared =          1.218 for     56 degrees of freedom
# Null hypothesis probability =   1.266575e-01

Photon flux (15-150 keV)    in 1 sec: 2.01683 ( -0.79842  0.93146 ) ph/cm2/s
Energy fluence (15-150 keV)             : 1.41981e-07 ( -4.6596e-08  5.00273e-08 ) ergs/cm2
Time-resolved spectra
Distribution
T90 vs. Hardness ratio plot
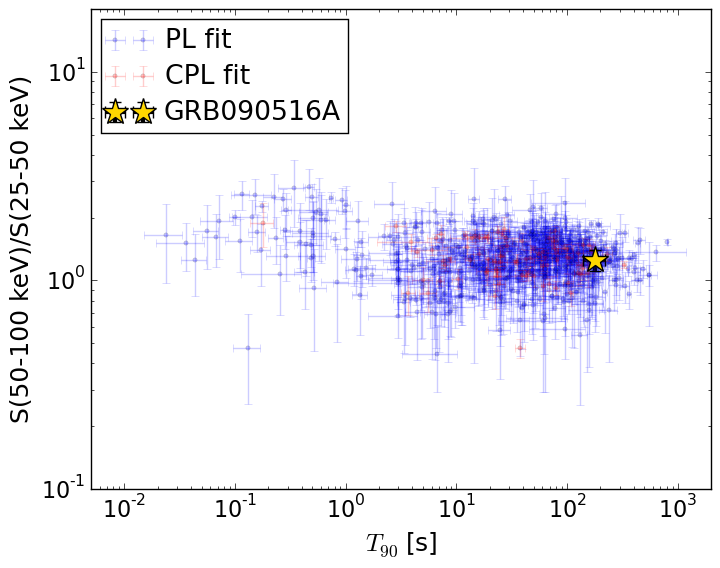
T90                                   = 181.008 sec.
Hardness ratio (energy fluence ratio) = 1.25464291116
S(15-50 keV) vs. S(50-150 keV) plot
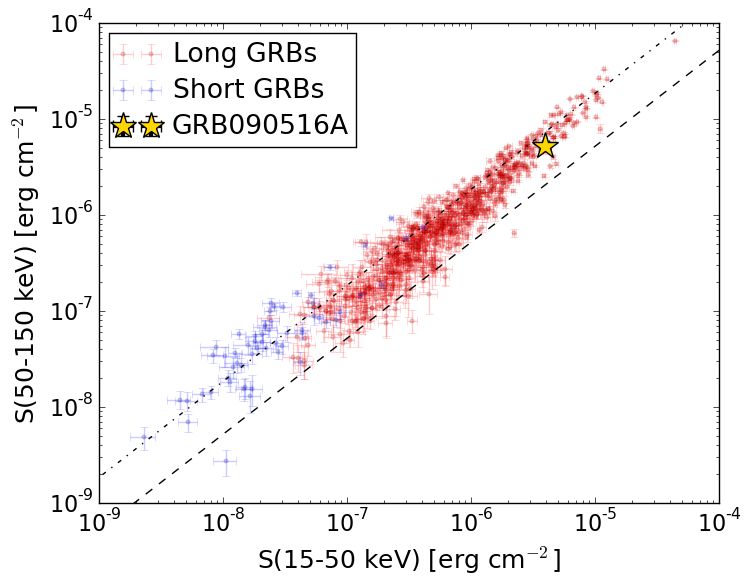
S(15-50 keV)  = 3.957375e-06
S(50-150 keV) = 5.257364e-06
The dash-dotted line and the dashed line traces the fluences calculated from the Band function with Epeak = 15 and 150 keV, respectively. Both lines assume a canonical values of alpha = -1 and beta = -2.5.
Mask shadow pattern
IMX = -1.551903772399309E+00, IMY = 4.372005025302858E-01
Spacecraft aspect plot
Bright source in the pre-burst/pre-slew/post-slew images
Pre-burst image of 15-350 keV band
Time interval of the image:
-239.520000 -8.544000

# RAcent  DECcent POSerr Theta    Phi  PeakCts   SNR AngSep     Name
#  [deg]    [deg]    ['] [deg]  [deg]                   [']
145.3927  -2.7243    2.9  47.7 -158.2   1.4577   4.0 ------	UNKNOWN
151.9503  14.0858    3.3  36.2 -137.2   0.9551   3.5 ------	UNKNOWN
197.0440  67.3351    2.6  50.7  -44.4   4.3175   4.4 ------	UNKNOWN
Pre-slew background subtracted image of 15-350 keV band
Time interval of the image:
-8.544000 42.480000
43.480000 80.780600

# RAcent  DECcent POSerr Theta    Phi  PeakCts   SNR AngSep     Name
#  [deg]    [deg]    ['] [deg]  [deg]                   [']
150.4887 -20.3213    2.4  53.3  179.2   1.7308   4.9 ------	UNKNOWN
138.2545 -11.8551    0.8  58.2 -164.3   9.1318  13.8 ------	UNKNOWN
Post-slew image of 15-350 keV band
Time interval of the image:
155.380600 606.380600

# RAcent  DECcent POSerr Theta    Phi  PeakCts   SNR AngSep     Name
#  [deg]    [deg]    ['] [deg]  [deg]                   [']
135.5402 -40.5580    0.4  28.8  164.8  10.6120  32.3    0.6	Vela X-1
138.2680 -11.8874    1.7   0.0  175.9   1.8768   6.7 ------	UNKNOWN
124.2645  39.0957    3.9  52.6  -33.3   3.1587   2.9 ------	UNKNOWN