Analysis Summary
Notes:
- 1) No attempt has been made to eliminate the non-significant decimal places.
- 2) This batgrbproduct analysis is done using the HEASARC data.
- 3) This batgrbproduct analysis is using the flight position for the mask-weighting calculation.
======================================================================
BAT GRB EVENT DATA PROCESSING REPORT
Process Script Ver: batgrbproduct v2.46
Process Start Time: Sun Jan 19 16:36:33 EST 2014
Host Name: batevent1
Current Working Dir: /local/data/batevent/batevent_reproc/trigger352420
======================================================================
Trigger: 00352420 Segment: 000
BAT Trigger Time: 264304489.024 [s; MET]
Trigger Stop: 264304489.28 [s; MET]
UTC: 2009-05-18T01:54:44.273640 [includes UTCF correction]
Where From?: TDRSS position message
BAT
RA: 119.933320952001 Dec: 0.767979769129691 [deg; J2000]
Catalogged Source?: NO
Point Source?: YES
GRB Indicated?: YES [ by BAT flight software ]
Image S/N Ratio: 9.03
Image Trigger?: NO
Rate S/N Ratio: 14.6287388383278 [ if not an image trigger ]
Image S/N Ratio: 9.03
Analysis Position: [ source = BAT ]
RA: 119.933320952001 Dec: 0.767979769129691 [deg; J2000]
Refined Position: [ source = BAT pre-slew burst ]
RA: 119.947725085362 Dec: 0.779777316984645 [deg; J2000]
{ 07h 59m 47.5s , +00d 46' 47.2" }
+/- 1.40248311327375 [arcmin] (estimated 90% radius based on SNR)
+/- 0.626690239514826 [arcmin] (formal 1-sigma fit error)
SNR: 18.7613725487338
Angular difference between the analysis and refined position is 1.117069 arcmin
Partial Coding Fraction: 0.7578125 [ including projection effects ]
Duration
T90: 85.8240000009537 +/- 23.782007304977
Measured from: -1.19999998807907
to: 84.6240000128746 [s; relative to TRIGTIME]
T50: 39.9360000193119 +/- 26.1148233951774
Measured from: 0.400000005960464
to: 40.3360000252724 [s; relative to TRIGTIME]
Fluence
Peak Flux (peak 1 second)
Measured from: -0.0679999887943268
to: 0.932000011205673 [s; relative to TRIGTIME]
Total Fluence
Measured from: -2.47999998927116
to: 93.3280000090599 [s; relative to TRIGTIME]
Band 1 Band 2 Band 3 Band 4
15-25 25-50 50-100 100-350 keV
Total 0.313223 0.404779 0.257267 0.185064
0.051829 0.052857 0.046489 0.041209 [error]
Peak 0.073545 0.108577 0.078179 0.022948
0.007157 0.007813 0.007125 0.005406 [error]
[ fluence units of on-axis counts / fully illuminated detector ]
======================================================================
====== Table of the duration information =============================
Value tstart tstop
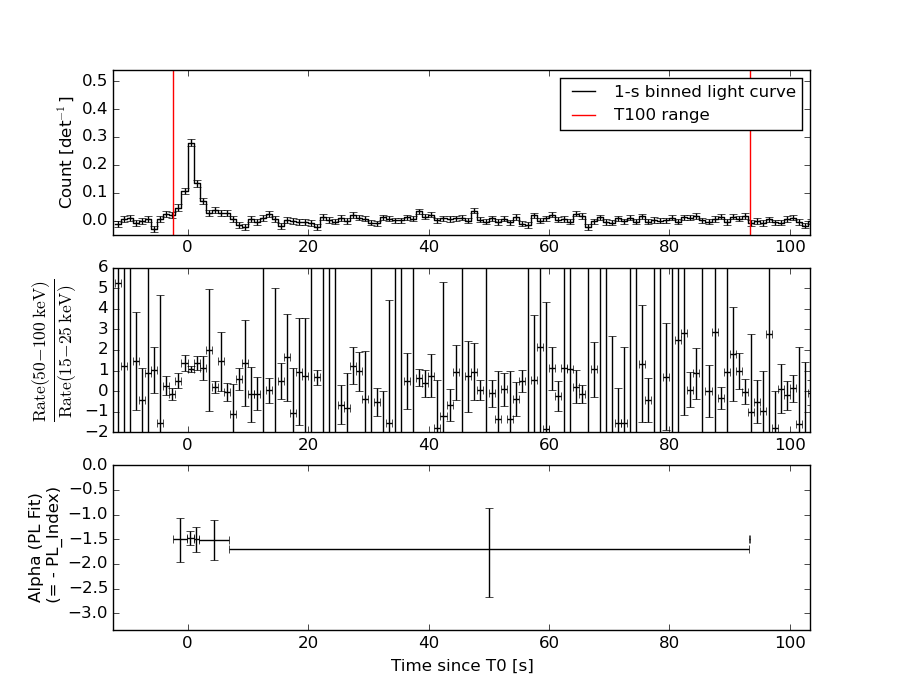
T100 95.808 -2.480 93.328
T90 85.824 -1.200 84.624
T50 39.936 0.400 40.336
Peak 1.000 -0.068 0.932
====== Spectral Analysis Summary =====================================
Model : spectral model: simple power-law (PL) and cutoff power-law (CPL)
Ph_index : photon index: E^{Ph_index}
Ph_90err : 90% error of the photon index
Epeak : Epeak in keV
Epeak_90err: 90% error of Epeak
Norm : normalization at 50 keV in both the PL model and CPL model
Nomr_90err : 90% error of the normalization
chi2 : Chi-Squared
dof : degree of freedo
=== Time-averaged spectral analysis ===
(Best model with acceptable fit: PL)
Model Ph_index Ph_90err_low Ph_90err_hi Epeak Epeak_90err_low Epeak_90err_hi Norm Nomr_90err_low Norm_90err_hi chi2 dof
PL -1.531 -0.268 0.263 - - - 7.24e-04 -1.11e-04 1.09e-04 61.610 57
CPL -1.532 -0.266 0.458 9999.360 -9999.360 -9999.360 7.26e-04 -1.11e-04 1.19e-03 61.610 56
=== 1-s peak spectral analysis ===
(Best model with acceptable fit: PL)
Model Ph_index Ph_90err_low Ph_90err_hi Epeak Epeak_90err_low Epeak_90err_hi Norm Nomr_90err_low Norm_90err_hi chi2 dof
PL -1.501 -0.142 0.140 - - - 1.89e-02 -1.61e-03 1.60e-03 62.640 57
CPL -1.119 -0.450 0.636 112.064 -47.314 -112.064 2.98e-02 -1.33e-02 3.33e-02 61.280 56
=== Fluence/Peak Flux Summary ===
Model Band1 Band2 Band3 Band4 Band5 Total
15-25 25-50 50-100 100-350 15-150 15-350 keV
Fluence PL 9.12e-08 1.64e-07 2.28e-07 6.56e-07 6.55e-07 1.14e-06 erg/cm2
90%_error_low -2.14e-08 -2.43e-08 -4.67e-08 -2.46e-07 -1.10e-07 -2.91e-07 erg/cm2
90%_error_hi 2.25e-08 2.41e-08 4.64e-08 3.35e-07 1.12e-07 3.65e-07 erg/cm2
Peak flux PL 7.78e-01 7.83e-01 5.53e-01 6.20e-01 2.36e+00 2.73e+00 ph/cm2/s
90%_error_low -1.04e-01 -6.70e-02 -5.99e-02 -1.26e-01 -1.94e-01 -2.29e-01 ph/cm2/s
90%_error_hi 1.08e-01 6.66e-02 5.95e-02 1.44e-01 1.94e-01 2.30e-01 ph/cm2/s
Fluence CPL 9.21e-08 1.63e-07 2.28e-07 6.53e-07 6.65e-07 1.15e-06 erg/cm2
90%_error_low N/A N/A N/A N/A -1.22e-07 -5.86e-07 erg/cm2
90%_error_hi N/A N/A N/A N/A 1.00e-07 1.98e-07 erg/cm2
Peak flux CPL 7.32e-01 8.14e-01 5.68e-01 3.92e-01 2.32e+00 2.51e+00 ph/cm2/s
90%_error_low -1.24e-01 -8.09e-02 -6.50e-02 -1.89e-01 -2.01e-01 -2.85e-01 ph/cm2/s
90%_error_hi 1.26e-01 8.37e-02 6.64e-02 2.75e-01 2.00e-01 3.66e-01 ph/cm2/s
======================================================================
Image
Pre-slew 15.0-350.0 keV image (Event data)
#   RAcent    DECcent   POSerr    Theta     Phi              Peak Cts       SNR   Name
  119.9477     0.7798   0.0103    26.8576   -45.7307         0.7893076     18.761 TRIG_00352420

Foreground time interval of the image:
 -2.480   9.677 (delta_t =  12.157 [sec])
Background time interval of the image:
-119.024  -2.480 (delta_t = 116.544 [sec])
Light Curves
Note: The mask-weighted lightcurves have units of either count/det or counts/sec/det, where a det is 0.4 x 0.4 = 0.16 sq cm.
Full-time range; 1 s binning
Other quick-look light curves:
- 64 ms binning (zoomed)
- 16 ms binning (zoomed)
- 8 ms binning (zoomed)
- 2 ms binning (zoomed)
- SN=5 or 10 s binning (full-time range)
- Raw light curve
Spectra
- 64 ms binning (zoomed)
- 16 ms binning (zoomed)
- 8 ms binning (zoomed)
- 2 ms binning (zoomed)
- SN=5 or 10 s binning (full-time range)
- Raw light curve
Spectra
Notes:
- 1) The fitting includes the systematic errors.
- 2) When the burst includes telescope slew time periods, the fitting uses an average response file made from multiple 5-s response files through out the slew time plus single time preiod for the non-slew times, and weighted by the total counts in the corresponding time period using addrmf. An average response file is needed becuase a spectral fit using the pre-slew DRM will introduce some errors in both a spectral shape and a normalization if the PHA file contains a lot of the slew/post-slew time interval.
- 3) For fits to more complicated models (e.g. a power-law over a cutoff power-law), the BAT team has decided to require a chi-square improvement of more than 6 for each extra dof.
Time averaged spectrum fit using the average DRM
Power-law model

Time interval is from   -2.480 sec. to   93.328 sec.

Spectral model in power-law:
------------------------------------------------------------
Parameters  : value       lower 90%   higher 90%
Photon index: -1.53107     ( -0.267698   0.263232 )
Norm@50keV  : 7.24091E-04    ( -0.00011102   0.000109121 )
------------------------------------------------------------
#Fit statistic : Chi-Squared =          61.61 using 59 PHA bins.
# Reduced chi-squared =          1.081 for     57 degrees of freedom
# Null hypothesis probability =   3.147171e-01

Photon flux (15-150 keV)    in 95.81 sec: 9.11739E-02 ( -0.0131758  0.0131911 ) ph/cm2/s
Energy fluence (15-150 keV)             : 6.55015e-07 ( -1.09657e-07  1.11783e-07 ) ergs/cm2
Cutoff power-law model
Time interval is from   -2.480 sec. to   93.328 sec.
Spectral model in the cutoff power-law:
------------------------------------------------------------
Parameters  : value       lower 90%   higher 90%
Photon index: -1.53157     ( -0.266488   0.458006 )
Epeak [keV] : 9999.36      ( -9999.36 -9999.36 )
Norm@50keV  : 7.25649E-04    ( -0.000111532   0.00118896 )
------------------------------------------------------------
#Fit statistic : Chi-Squared =          61.61 using 59 PHA bins.
# Reduced chi-squared =          1.100 for     56 degrees of freedom
# Null hypothesis probability =   2.822728e-01

Photon flux (15-150 keV)    in 95.81 sec: 9.15651E-02 ( -0.0147457  0.0139599 ) ph/cm2/s
Energy fluence (15-150 keV)             : 6.648e-07 ( -1.22073e-07  1.00217e-07 ) ergs/cm2
1-s peak spectrum fit
Power-law model
Time interval is from   -0.068 sec. to    0.932 sec.

Spectral model in power-law:
------------------------------------------------------------
Parameters  : value       lower 90%   higher 90%
Photon index: -1.50145     ( -0.142382   0.140446 )
Norm@50keV  : 1.88821E-02    ( -0.00161098   0.0016004 )
------------------------------------------------------------
#Fit statistic : Chi-Squared =          62.64 using 59 PHA bins.
# Reduced chi-squared =          1.099 for     57 degrees of freedom
# Null hypothesis probability =   2.830798e-01

Photon flux (15-150 keV)    in 1 sec: 2.35820 ( -0.19365  0.19377 ) ph/cm2/s
Energy fluence (15-150 keV)             : 1.79106e-07 ( -1.6798e-08  1.6977e-08 ) ergs/cm2
Cutoff power-law model
Time interval is from   -0.068 sec. to    0.932 sec.
Spectral model in the cutoff power-law:
------------------------------------------------------------
Parameters  : value       lower 90%   higher 90%
Photon index: -1.11948     ( -0.450299   0.636022 )
Epeak [keV] : 112.064      ( -47.3178 -112.068 )
Norm@50keV  : 2.98367E-02    ( -0.0133483   0.0333065 )
------------------------------------------------------------
#Fit statistic : Chi-Squared =          61.28 using 59 PHA bins.
# Reduced chi-squared =          1.094 for     56 degrees of freedom
# Null hypothesis probability =   2.924638e-01

Photon flux (15-150 keV)    in 1 sec: 2.32277 ( -0.20134  0.20034 ) ph/cm2/s
Energy fluence (15-150 keV)             : 1.73516e-07 ( -1.89799e-08  1.88375e-08 ) ergs/cm2
Time-resolved spectra
Distribution
T90 vs. Hardness ratio plot
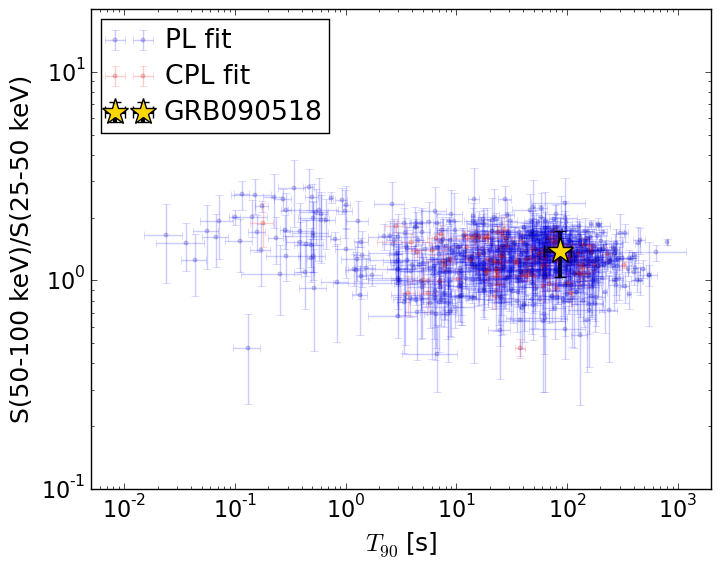
T90                                   = 85.824 sec.
Hardness ratio (energy fluence ratio) = 1.38410788531
S(15-50 keV) vs. S(50-150 keV) plot
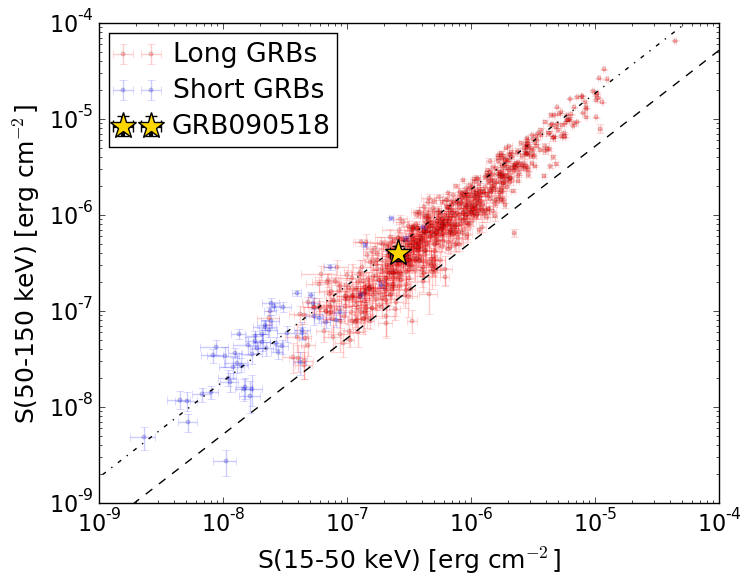
S(15-50 keV)  = 2.5564676e-07
S(50-150 keV) = 3.993601e-07
The dash-dotted line and the dashed line traces the fluences calculated from the Band function with Epeak = 15 and 150 keV, respectively. Both lines assume a canonical values of alpha = -1 and beta = -2.5.
Mask shadow pattern
IMX = 3.534827324777359E-01, IMY = 3.626152797423156E-01
Spacecraft aspect plot
Bright source in the pre-burst/pre-slew/post-slew images
Pre-burst image of 15-350 keV band
Time interval of the image:
-119.024000 -2.480000

# RAcent  DECcent POSerr Theta    Phi  PeakCts   SNR AngSep     Name
#  [deg]    [deg]    ['] [deg]  [deg]                   [']
135.5337 -40.5600    0.3  16.9  140.3   4.9139  40.5    0.4	Vela X-1
108.1407 -71.2747    2.6  48.4  165.0   1.4599   4.4 ------	UNKNOWN
148.3491  21.4450    2.2  49.3   -0.7   1.5771   5.2 ------	UNKNOWN
Pre-slew background subtracted image of 15-350 keV band
Time interval of the image:
-2.480000 9.676600

# RAcent  DECcent POSerr Theta    Phi  PeakCts   SNR AngSep     Name
#  [deg]    [deg]    ['] [deg]  [deg]                   [']
135.5522 -40.5780    1.4  16.9  140.3  -0.3176  -8.5    1.8	Vela X-1
119.9477   0.7798    0.6  26.9  -45.7   0.7893  18.8 ------	UNKNOWN
Post-slew image of 15-350 keV band
Time interval of the image:
57.276660 963.022400

# RAcent  DECcent POSerr Theta    Phi  PeakCts   SNR AngSep     Name
#  [deg]    [deg]    ['] [deg]  [deg]                   [']
 83.6085  22.0072    0.8  41.2  -77.3  33.3870  15.2    1.4	Crab
135.5380 -40.5569    0.6  43.7  141.9  29.1965  18.3    0.4	Vela X-1
133.9082  38.5645    2.9  39.9   -3.8   3.0032   4.1 ------	UNKNOWN