Analysis Summary
Notes:
- 1) No attempt has been made to eliminate the non-significant decimal places.
- 2) This batgrbproduct analysis is done using the HEASARC data.
- 3) This batgrbproduct analysis is using the flight position for the mask-weighting calculation.
======================================================================
BAT GRB EVENT DATA PROCESSING REPORT
Process Script Ver: batgrbproduct v2.46
Process Start Time: Sun Jan 19 16:31:31 EST 2014
Host Name: batevent1
Current Working Dir: /local/data/batevent/batevent_reproc/trigger352648
======================================================================
Trigger: 00352648 Segment: 000
BAT Trigger Time: 264460141.184 [s; MET]
Trigger Stop: 264460153.344 [s; MET]
UTC: 2009-05-19T21:08:56.428660 [includes UTCF correction]
Where From?: TDRSS position message
BAT
RA: 142.292608313677 Dec: 0.182991992937532 [deg; J2000]
Catalogged Source?: NO
Point Source?: YES
GRB Indicated?: YES [ by BAT flight software ]
Image S/N Ratio: 8.61
Image Trigger?: NO
Rate S/N Ratio: 13.6747943311773 [ if not an image trigger ]
Image S/N Ratio: 8.61
Analysis Position: [ source = BAT ]
RA: 142.292608313677 Dec: 0.182991992937532 [deg; J2000]
Refined Position: [ source = BAT pre-slew burst ]
RA: 142.309062770082 Dec: 0.185176383180289 [deg; J2000]
{ 09h 29m 14.2s , +00d 11' 06.6" }
+/- 1.97870528261701 [arcmin] (estimated 90% radius based on SNR)
+/- 0.781407827699815 [arcmin] (formal 1-sigma fit error)
SNR: 11.4740513635122
Angular difference between the analysis and refined position is 0.995924 arcmin
Partial Coding Fraction: 0.578125 [ including projection effects ]
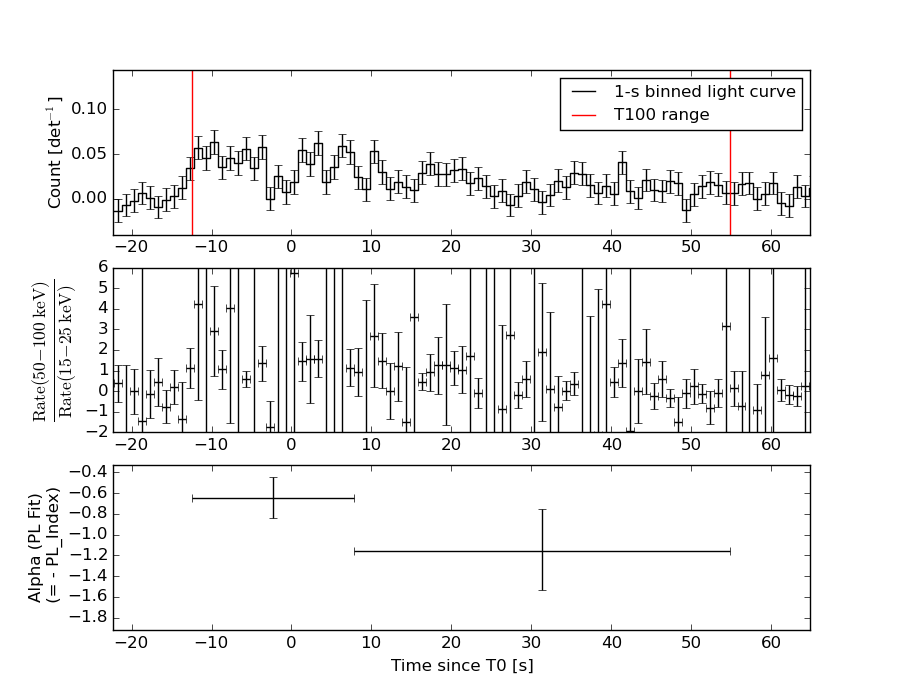
Duration
T90: 58.0360000133514 +/- 8.18314682376177
Measured from: -10.863999992609
to: 47.1720000207424 [s; relative to TRIGTIME]
T50: 26.0920000076294 +/- 12.8469646408324
Measured from: -4.24799999594688
to: 21.8440000116825 [s; relative to TRIGTIME]
Fluence
Peak Flux (peak 1 second)
Measured from: -10.4039999842644
to: -9.40399998426437 [s; relative to TRIGTIME]
Total Fluence
Measured from: -12.3999999761581
to: 54.8880000114441 [s; relative to TRIGTIME]
Band 1 Band 2 Band 3 Band 4
15-25 25-50 50-100 100-350 keV
Total 0.287525 0.518887 0.563350 0.230266
0.055707 0.057391 0.051980 0.046681 [error]
Peak 0.010710 0.017326 0.034327 0.014305
0.006742 0.007244 0.006732 0.006399 [error]
[ fluence units of on-axis counts / fully illuminated detector ]
======================================================================
====== Table of the duration information =============================
Value tstart tstop
T100 67.288 -12.400 54.888
T90 58.036 -10.864 47.172
T50 26.092 -4.248 21.844
Peak 1.000 -10.404 -9.404
====== Spectral Analysis Summary =====================================
Model : spectral model: simple power-law (PL) and cutoff power-law (CPL)
Ph_index : photon index: E^{Ph_index}
Ph_90err : 90% error of the photon index
Epeak : Epeak in keV
Epeak_90err: 90% error of Epeak
Norm : normalization at 50 keV in both the PL model and CPL model
Nomr_90err : 90% error of the normalization
chi2 : Chi-Squared
dof : degree of freedo
=== Time-averaged spectral analysis ===
(Best model with acceptable fit: PL)
Model Ph_index Ph_90err_low Ph_90err_hi Epeak Epeak_90err_low Epeak_90err_hi Norm Nomr_90err_low Norm_90err_hi chi2 dof
PL -0.852 -0.199 0.210 - - - 1.53e-03 -1.73e-04 1.70e-04 63.780 57
CPL -0.781 -0.272 0.519 995.501 -995.501 -995.501 1.65e-03 -2.77e-04 5.64e-05 64.020 56
=== 1-s peak spectral analysis ===
(Best model with acceptable fit: N/A)
Model Ph_index Ph_90err_low Ph_90err_hi Epeak Epeak_90err_low Epeak_90err_hi Norm Nomr_90err_low Norm_90err_hi chi2 dof
PL -0.307 -0.564 0.721 - - - 4.61e-03 -1.84e-03 1.62e-03 46.240 57
CPL -0.199 -0.681 2.187 974.581 -974.581 -974.581 5.16e-03 -2.36e-03 -5.16e-03 46.420 56
=== Fluence/Peak Flux Summary ===
Model Band1 Band2 Band3 Band4 Band5 Total
15-25 25-50 50-100 100-350 15-150 15-350 keV
Fluence PL 7.20e-08 1.97e-07 4.38e-07 2.56e-06 1.18e-06 3.27e-06 erg/cm2
90%_error_low -1.73e-08 -2.92e-08 -4.87e-08 -6.37e-07 -1.31e-07 -6.58e-07 erg/cm2
90%_error_hi 1.89e-08 2.85e-08 4.82e-08 7.97e-07 1.32e-07 8.01e-07 erg/cm2
Peak flux PL 6.13e-02 1.27e-01 2.05e-01 7.42e-01 5.67e-01 1.14e+00 ph/cm2/s
90%_error_low -4.19e-02 -1.27e-01 -5.28e-02 -3.65e-01 -1.56e-01 -3.55e-01 ph/cm2/s
90%_error_hi 6.58e-02 6.79e-02 5.14e-02 6.58e-01 1.61e-01 5.62e-01 ph/cm2/s
Fluence CPL 7.30e-08 1.97e-07 4.29e-07 2.72e-06 1.19e-06 3.23e-06 erg/cm2
90%_error_low -2.84e-08 -3.26e-08 N/A -1.43e-06 N/A -1.23e-06 erg/cm2
90%_error_hi 1.98e-08 3.26e-08 N/A 1.91e-07 N/A 3.68e-07 erg/cm2
Peak flux CPL 6.11e-02 1.27e-01 2.05e-01 7.31e-01 5.67e-01 1.18e+00 ph/cm2/s
90%_error_low N/A N/A N/A N/A -1.57e-01 -5.87e-01 ph/cm2/s
90%_error_hi N/A N/A N/A N/A 1.60e-01 5.00e-01 ph/cm2/s
======================================================================
Image
Pre-slew 15.0-350.0 keV image (Event data)
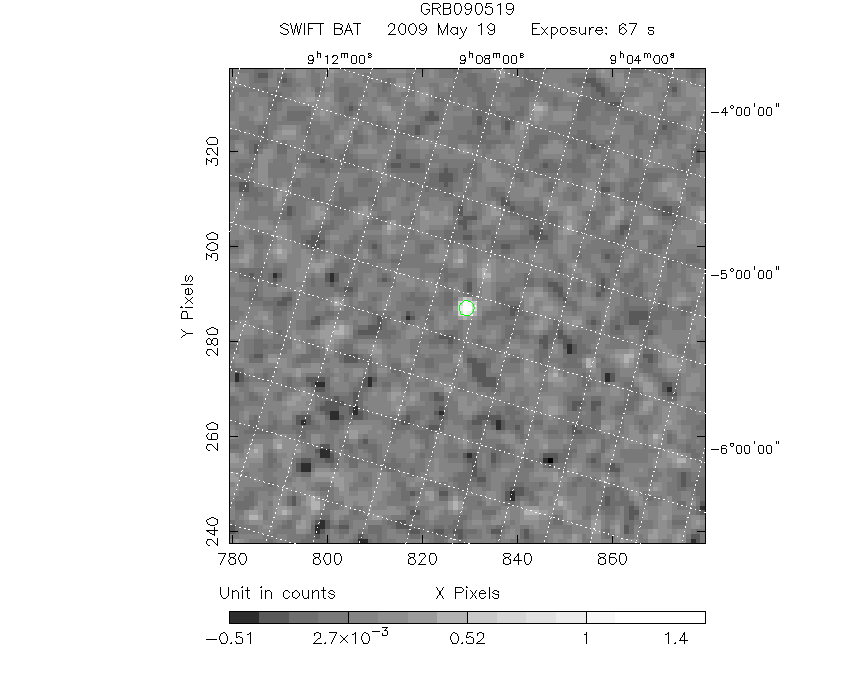
#   RAcent    DECcent   POSerr    Theta     Phi              Peak Cts       SNR   Name
  142.3091     0.1852   0.0166    22.3988    75.1332         1.6790839     11.474 TRIG_00352648

Foreground time interval of the image:
-12.400  54.888 (delta_t =  67.288 [sec])
Background time interval of the image:
-100.683 -12.400 (delta_t =  88.283 [sec])
Light Curves
Note: The mask-weighted lightcurves have units of either count/det or counts/sec/det, where a det is 0.4 x 0.4 = 0.16 sq cm.
Full-time range; 1 s binning
Other quick-look light curves:
- 64 ms binning (zoomed)
- 16 ms binning (zoomed)
- 8 ms binning (zoomed)
- 2 ms binning (zoomed)
- SN=5 or 10 s binning (full-time range)
- Raw light curve
Spectra
- 64 ms binning (zoomed)
- 16 ms binning (zoomed)
- 8 ms binning (zoomed)
- 2 ms binning (zoomed)
- SN=5 or 10 s binning (full-time range)
- Raw light curve
Spectra
Notes:
- 1) The fitting includes the systematic errors.
- 2) When the burst includes telescope slew time periods, the fitting uses an average response file made from multiple 5-s response files through out the slew time plus single time preiod for the non-slew times, and weighted by the total counts in the corresponding time period using addrmf. An average response file is needed becuase a spectral fit using the pre-slew DRM will introduce some errors in both a spectral shape and a normalization if the PHA file contains a lot of the slew/post-slew time interval.
- 3) For fits to more complicated models (e.g. a power-law over a cutoff power-law), the BAT team has decided to require a chi-square improvement of more than 6 for each extra dof.
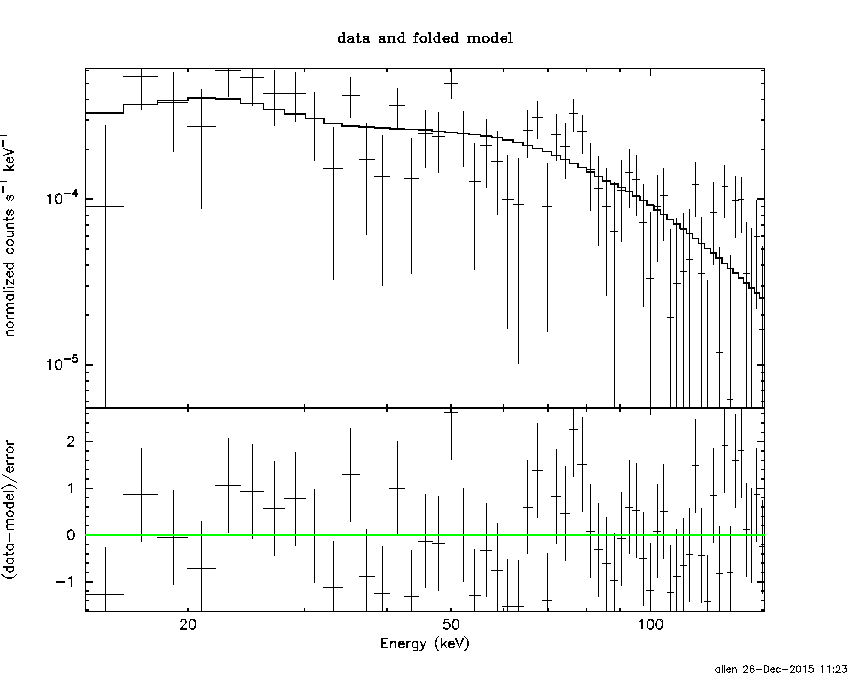
Time averaged spectrum fit using the average DRM
Power-law model

Time interval is from  -12.400 sec. to   54.888 sec.

Spectral model in power-law:
------------------------------------------------------------
Parameters  : value       lower 90%   higher 90%
Photon index: -0.851553     ( -0.19913   0.210162 )
Norm@50keV  : 1.53258E-03    ( -0.000173097   0.000170094 )
------------------------------------------------------------
#Fit statistic : Chi-Squared =          63.78 using 59 PHA bins.
# Reduced chi-squared =          1.119 for     57 degrees of freedom
# Null hypothesis probability =   2.502981e-01

Photon flux (15-150 keV)    in 67.29 sec: 0.175922 ( -0.019452  0.019577 ) ph/cm2/s
Energy fluence (15-150 keV)             : 1.17992e-06 ( -1.31315e-07  1.31892e-07 ) ergs/cm2
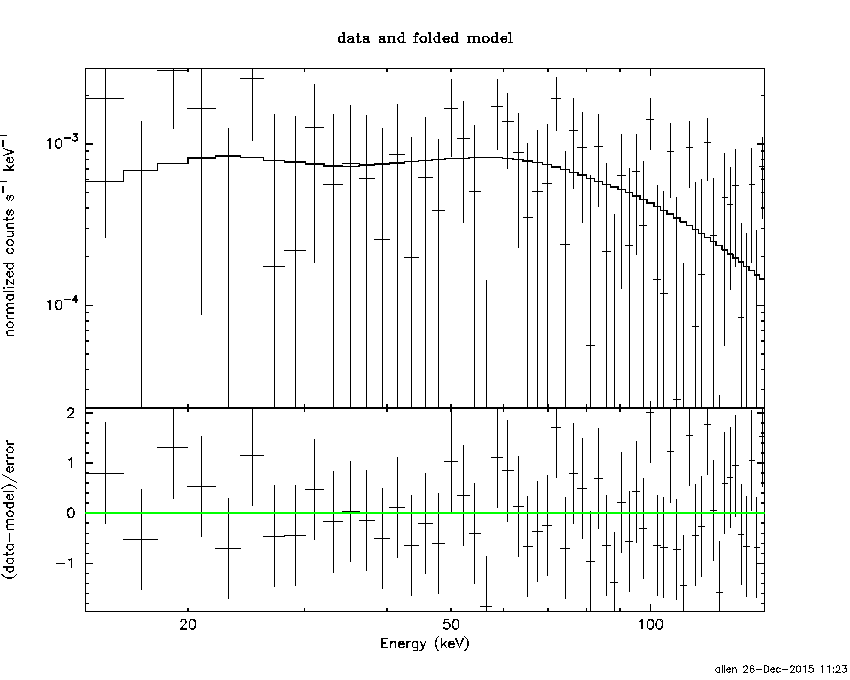
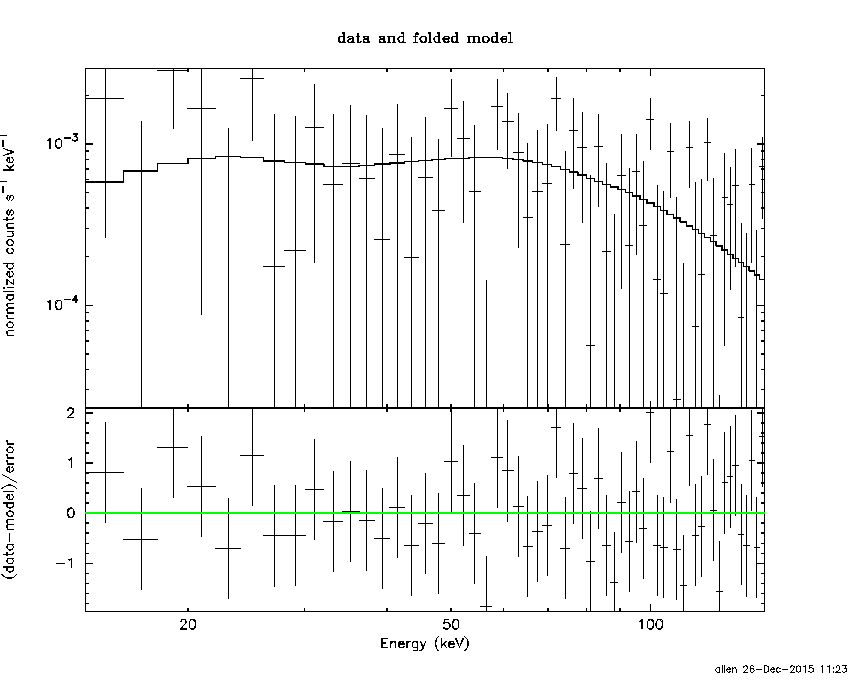
Cutoff power-law model
Time interval is from  -12.400 sec. to   54.888 sec.
Spectral model in the cutoff power-law:
------------------------------------------------------------
Parameters  : value       lower 90%   higher 90%
Photon index: -0.844738     ( -0.272217   0.519396 )
Epeak [keV] : 1.00000E+04      ( -10000 -10000 )
Norm@50keV  : 1.54295E-03    ( -0.000173613   0.000160214 )
------------------------------------------------------------
#Fit statistic : Chi-Squared =          63.80 using 59 PHA bins.
# Reduced chi-squared =          1.139 for     56 degrees of freedom
# Null hypothesis probability =   2.212563e-01

Photon flux (15-150 keV)    in 67.29 sec: 0.175871 ( -0.019453  0.019534 ) ph/cm2/s
Energy fluence (15-150 keV)             : 1.18932e-06 ( 0  0 ) ergs/cm2
1-s peak spectrum fit
Power-law model
Time interval is from  -10.404 sec. to   -9.404 sec.

Spectral model in power-law:
------------------------------------------------------------
Parameters  : value       lower 90%   higher 90%
Photon index: -0.30749     ( -0.564186   0.720879 )
Norm@50keV  : 4.60667E-03    ( -0.00184327   0.00162289 )
------------------------------------------------------------
#Fit statistic : Chi-Squared =          46.24 using 59 PHA bins.
# Reduced chi-squared =         0.8113 for     57 degrees of freedom
# Null hypothesis probability =   8.450420e-01

Photon flux (15-150 keV)    in 1 sec: 0.567275 ( -0.156022  0.160547 ) ph/cm2/s
Energy fluence (15-150 keV)             : 6.85693e-08 ( -1.74423e-08  1.74231e-08 ) ergs/cm2
Cutoff power-law model
Time interval is from  -10.404 sec. to   -9.404 sec.
Spectral model in the cutoff power-law:
------------------------------------------------------------
Parameters  : value       lower 90%   higher 90%
Photon index: -0.293086     ( -0.6814   2.18567 )
Epeak [keV] : 1.00000E+04      ( -10000 -10000 )
Norm@50keV  : 4.64380E-03    ( -0.00184693   -0.00464544 )
------------------------------------------------------------
#Fit statistic : Chi-Squared =          46.26 using 59 PHA bins.
# Reduced chi-squared =         0.8260 for     56 degrees of freedom
# Null hypothesis probability =   8.201719e-01

Photon flux (15-150 keV)    in 1 sec: 0.567351 ( -0.157025  0.160115 ) ph/cm2/s
Energy fluence (15-150 keV)             : 6.80754e-08 ( 0  0 ) ergs/cm2
Time-resolved spectra
Distribution
T90 vs. Hardness ratio plot
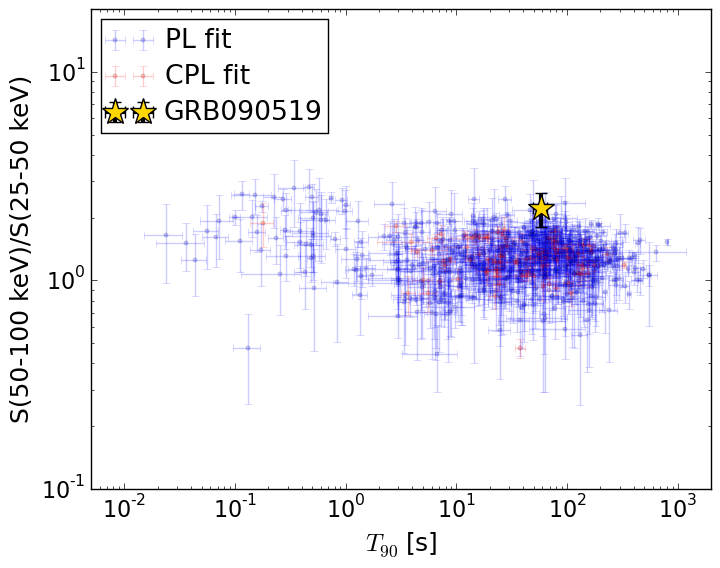
T90                                   = 58.036 sec.
Hardness ratio (energy fluence ratio) = 2.21676712101
S(15-50 keV) vs. S(50-150 keV) plot
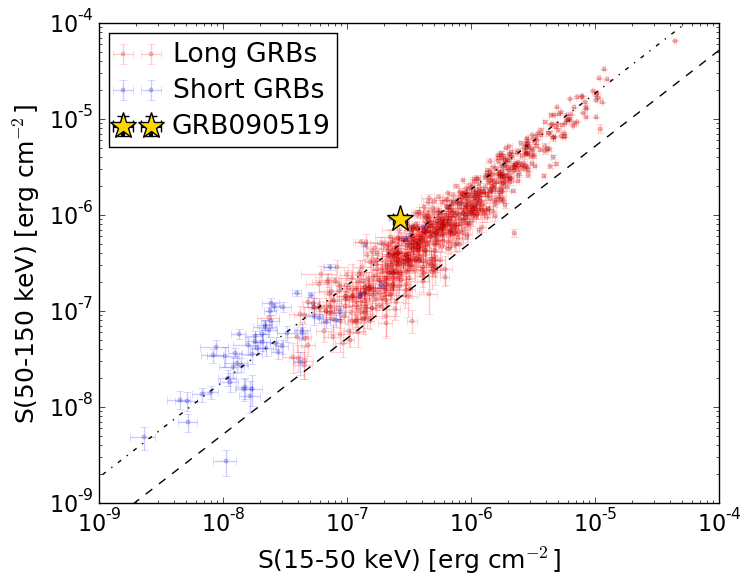
S(15-50 keV)  = 2.6943265e-07
S(50-150 keV) = 9.104804e-07
The dash-dotted line and the dashed line traces the fluences calculated from the Band function with Epeak = 15 and 150 keV, respectively. Both lines assume a canonical values of alpha = -1 and beta = -2.5.
Mask shadow pattern
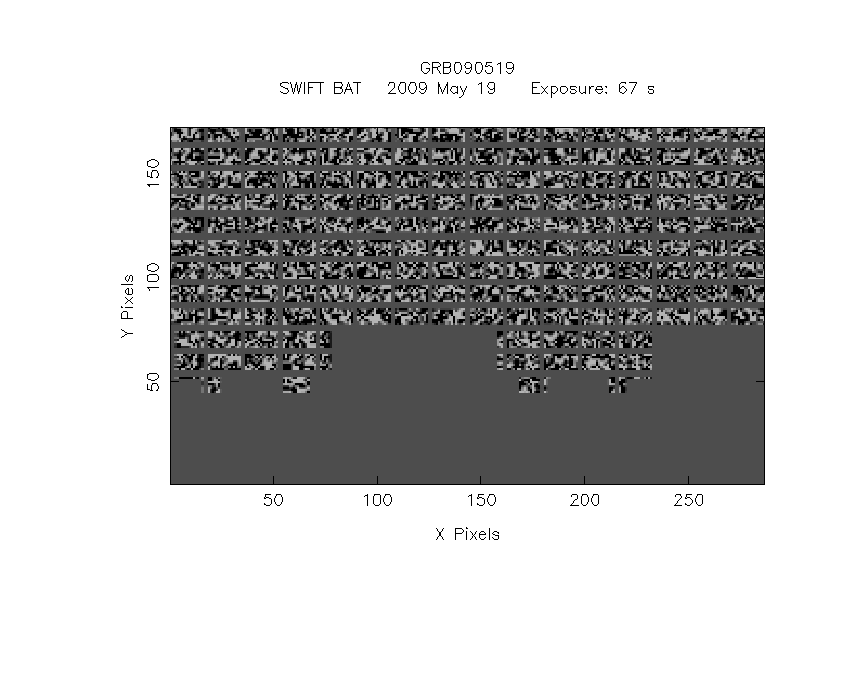
IMX = 1.057455153147989E-01, IMY = -3.983484153796124E-01
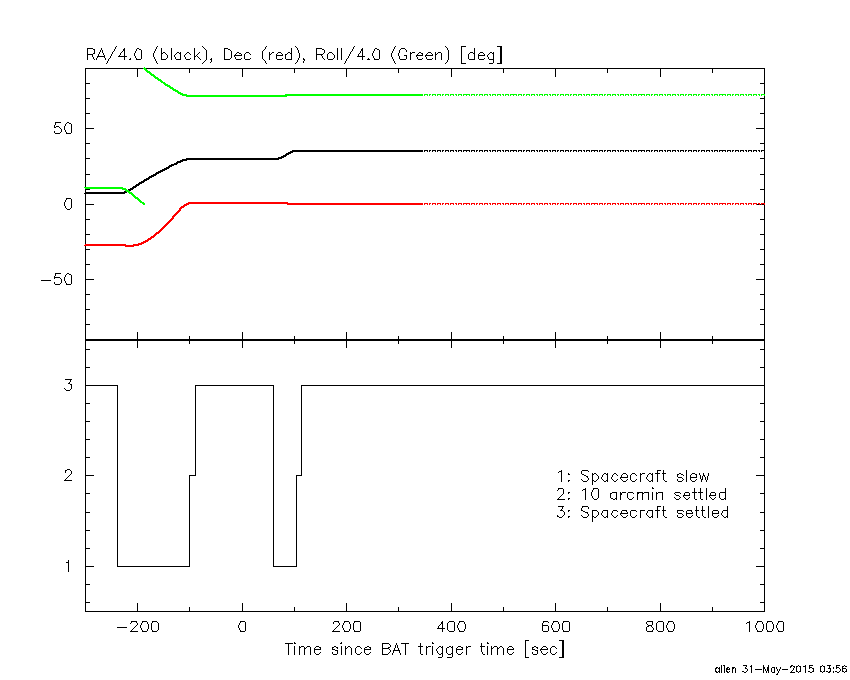
Spacecraft aspect plot
Bright source in the pre-burst/pre-slew/post-slew images
Pre-burst image of 15-350 keV band
Time interval of the image:
-100.683400 -12.400000

# RAcent  DECcent POSerr Theta    Phi  PeakCts   SNR AngSep     Name
#  [deg]    [deg]    ['] [deg]  [deg]                   [']
 83.6253  22.0064    1.4  41.2  -72.8   3.0824   8.2    0.7	Crab
135.5589 -40.5709    2.8  43.8  146.4   1.0272   4.1    1.7	Vela X-1
126.8493   5.1276    2.3   8.2   41.6   0.4775   5.1 ------	UNKNOWN
107.6359  14.9046    2.8  18.6  -56.5   0.4206   4.1 ------	UNKNOWN
Pre-slew background subtracted image of 15-350 keV band
Time interval of the image:
-12.400000 54.888000

# RAcent  DECcent POSerr Theta    Phi  PeakCts   SNR AngSep     Name
#  [deg]    [deg]    ['] [deg]  [deg]                   [']
 83.5011  22.1388    0.0  41.4  -72.7   0.5821   1.4   10.5	Crab
135.6966 -40.5323  107.0  43.8  146.3  -0.0289  -0.1    7.8	Vela X-1
142.3091   0.1852    1.0  22.4   75.1   1.6792  11.5 ------	UNKNOWN
138.4355  41.5117    2.2  44.0    3.7   1.0667   5.2 ------	UNKNOWN
136.3281  55.8719    2.9  56.6   -5.4   2.2762   3.9 ------	UNKNOWN
Post-slew image of 15-350 keV band
Time interval of the image:
104.316590 962.861100

# RAcent  DECcent POSerr Theta    Phi  PeakCts   SNR AngSep     Name
#  [deg]    [deg]    ['] [deg]  [deg]                   [']
135.5667 -40.5687    0.7  41.2  168.0  14.1231  16.6    1.9	Vela X-1
150.6677 -13.0831    2.6  15.7  128.5   2.2942   4.4 ------	UNKNOWN
171.1154  49.6593    2.8  55.3    2.6  11.4742   4.1 ------	UNKNOWN
141.4419  -6.1069    2.4   6.4  167.8   2.4359   4.8 ------	UNKNOWN