Analysis Summary
Notes:
- 1) No attempt has been made to eliminate the non-significant decimal places.
- 2) This batgrbproduct analysis is done using the HEASARC data.
- 3) This batgrbproduct analysis is using the flight position for the mask-weighting calculation.
======================================================================
                  BAT GRB EVENT DATA PROCESSING REPORT
    Process Script Ver: batgrbproduct v2.46
    Process Start Time: Sun Jan 19 16:13:58 EST 2014
             Host Name: batevent1
   Current Working Dir: /local/data/batevent/batevent_reproc/trigger353627
======================================================================

  Trigger: 00353627      Segment: 000

  BAT Trigger Time: 265427122.176   [s; MET]
      Trigger Stop: 265427123.2   [s; MET]
               UTC: 2009-05-31T01:45:17.389720    [includes UTCF correction]
       Where From?: TDRSS position message

  BAT
    RA: 178.687245045651   Dec: 7.79948396161114  [deg; J2000]

     Catalogged Source?: NO
     Point Source?:      YES
     GRB Indicated?:     YES    [ by BAT flight software ]
     Image S/N Ratio:    7.22
     Image Trigger?:     NO
     Rate S/N Ratio:     9  [ if not an image trigger ]
     Image S/N Ratio:    7.22

  Analysis Position:   [ source = BAT ]
    RA: 178.687245045651   Dec: 7.79948396161114  [deg; J2000]

  Refined Position:   [ source = BAT pre-slew burst ]
    RA: 178.664302922707   Dec: 7.82967615401671  [deg; J2000]
        { 11h 54m 39.4s , +07d 49' 46.8" }
         +/- 1.06918127737931 [arcmin] (estimated 90% radius based on SNR)
         +/- 0.449743546938196 [arcmin] (formal 1-sigma fit error)
    SNR: 27.6449913478382

  Angular difference between the analysis and refined position is 2.267475 arcmin

  Partial Coding Fraction: 0.734375    [ including projection effects ]

  Duration
     T90: 42.8000000119209 +/- 8.08223434240787
        Measured from: -16.8079999983311
                   to: 25.9920000135899     [s; relative to TRIGTIME]
     T50: 15.0040000081062 +/- 1.80621702921914
        Measured from: -1.21200001239777
                   to: 13.7919999957085     [s; relative to TRIGTIME]


  Fluence
     Peak Flux  (peak 1 second)
        Measured from: 9.29199999570847
                   to: 10.2919999957085     [s; relative to TRIGTIME]
     Total Fluence
        Measured from: -25.5399999916553
                   to: 34.608000010252     [s; relative to TRIGTIME]

             Band 1     Band 2     Band 3     Band 4
              15-25      25-50     50-100    100-350     keV
 Total     0.720954   1.076535   0.735958   0.110662
           0.044600   0.047169   0.042810   0.038903 [error]
 Peak      0.033089   0.060454   0.052940   0.013857
           0.006234   0.006653   0.006192   0.005225 [error]

     [ fluence units of on-axis counts / fully illuminated detector ]

======================================================================


====== Table of the duration information =============================

        Value   tstart    tstop
T100   60.148  -25.540   34.608
T90    42.800  -16.808   25.992
T50    15.004   -1.212   13.792
Peak    1.000    9.292   10.292


====== Spectral Analysis Summary =====================================

Model      : spectral model: simple power-law (PL) and cutoff power-law (CPL)
Ph_index   : photon index: E^{Ph_index}
Ph_90err   : 90% error of the photon index
Epeak      : Epeak in keV
Epeak_90err: 90% error of Epeak
Norm       : normalization at 50 keV in both the PL model and CPL model
Nomr_90err : 90% error of the normalization
chi2       : Chi-Squared
dof        : degree of freedo

=== Time-averaged spectral analysis ===
(Best model with acceptable fit: CPL)

Model Ph_index Ph_90err_low Ph_90err_hi  Epeak  Epeak_90err_low  Epeak_90err_hi  Norm       Nomr_90err_low    Norm_90err_hi    chi2    dof
PL      -1.578    -0.095      0.095       -           -               -         2.91e-03     -1.62e-04          1.62e-04      73.830   57
CPL     -0.940    -0.403      0.446       78.619     -15.562        53.334      6.27e-03     -2.37e-03          4.38e-03      66.130   56


=== 1-s peak spectral analysis ===
(Best model with acceptable fit: N/A)

Model Ph_index Ph_90err_low Ph_90err_hi  Epeak  Epeak_90err_low  Epeak_90err_hi  Norm       Nomr_90err_low    Norm_90err_hi    chi2    dof
PL      -1.167     -0.202     0.206       -           -               -         1.07e-02     -1.29e-03          1.29e-03      79.370   57
CPL     -0.692     -0.575     0.947      144.546     -65.546      -144.546      1.82e-02     -8.34e-03          3.29e-02      78.340   56


=== Fluence/Peak Flux Summary ===

              Model    Band1     Band2     Band3     Band4     Band5     Total
                       15-25     25-50    50-100    100-350    15-150    15-350    keV
Fluence         PL   2.40e-07  4.21e-07  5.64e-07  1.55e-06  1.64e-06  2.77e-06   erg/cm2
      90%_error_low -2.09e-08 -2.28e-08 -4.19e-08 -2.31e-07 -9.94e-08 -2.68e-07   erg/cm2
      90%_error_hi   2.14e-08  2.28e-08  4.20e-08  2.58e-07  1.00e-07  2.90e-07   erg/cm2
Peak flux       PL   3.19e-01  3.92e-01  3.49e-01  5.37e-01  1.25e+00  1.60e+00   ph/cm2/s
      90%_error_low -7.00e-02 -5.53e-02 -4.88e-02 -1.42e-01 -1.53e-01 -2.05e-01   ph/cm2/s
      90%_error_hi   7.47e-02  5.44e-02  4.83e-02  1.71e-01  1.53e-01  2.10e-01   ph/cm2/s

Fluence        CPL   2.18e-07  4.49e-07  5.72e-07  6.02e-07  1.54e-06  1.84e-06   erg/cm2
      90%_error_low -2.48e-08 -2.89e-08 -4.60e-08 -2.47e-07 -1.16e-07 -2.72e-07   erg/cm2
      90%_error_hi   2.51e-08  2.95e-08  4.60e-08  4.55e-07  1.17e-07  4.62e-07   erg/cm2
Peak flux      CPL   2.91e-01  4.09e-01  3.66e-01  3.20e-01  1.23e+00  1.39e+00   ph/cm2/s
      90%_error_low -8.35e-02 -6.27e-02 -5.65e-02 -1.79e-01 -7.91e-02 -2.45e-01   ph/cm2/s
      90%_error_hi   8.76e-02  6.52e-02  5.83e-02  2.75e-01  1.57e-01  3.30e-01   ph/cm2/s

======================================================================
Image
Pre-slew 15.0-350.0 keV image (Event data)
#   RAcent    DECcent   POSerr    Theta     Phi              Peak Cts       SNR   Name
  178.6643     7.8297   0.0070    20.4890   -77.7437         2.6596604     27.645 TRIG_00353627

Foreground time interval of the image:
-25.540  34.608 (delta_t =  60.148 [sec])
Background time interval of the image:
-438.075 -367.137 (delta_t =  70.938 [sec])
-239.176 -25.540 (delta_t = 213.636 [sec])
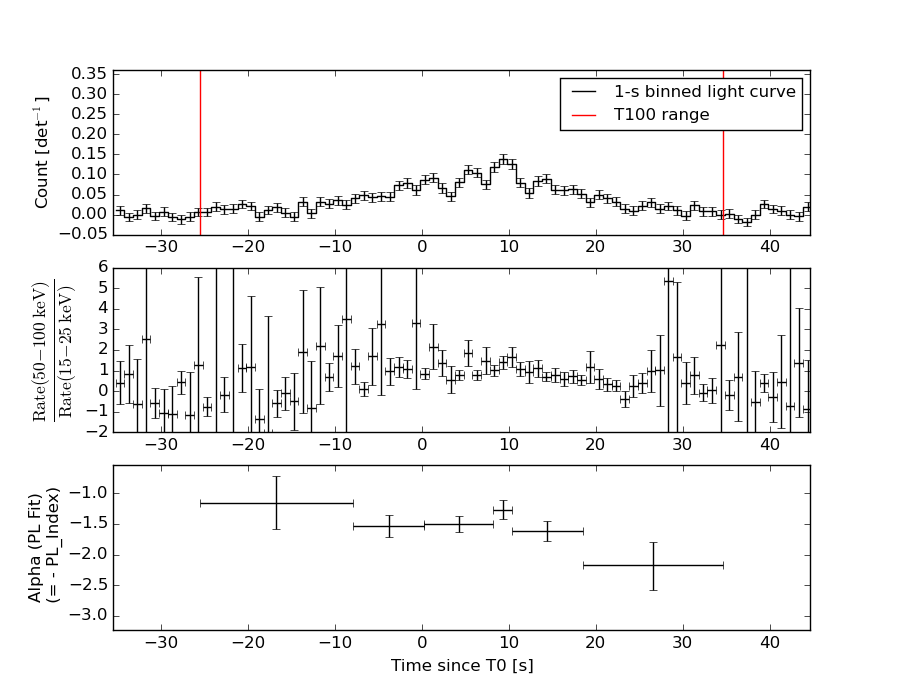
Light Curves
Note: The mask-weighted lightcurves have units of either count/det or counts/sec/det, where a det is 0.4 x 0.4 = 0.16 sq cm.
Full-time range; 1 s binning
Other quick-look light curves:
- 64 ms binning (zoomed)
- 16 ms binning (zoomed)
- 8 ms binning (zoomed)
- 2 ms binning (zoomed)
- SN=5 or 10 s binning (full-time range)
- Raw light curve
Spectra
- 64 ms binning (zoomed)
- 16 ms binning (zoomed)
- 8 ms binning (zoomed)
- 2 ms binning (zoomed)
- SN=5 or 10 s binning (full-time range)
- Raw light curve
Spectra
Notes:
- 1) The fitting includes the systematic errors.
- 2) When the burst includes telescope slew time periods, the fitting uses an average response file made from multiple 5-s response files through out the slew time plus single time preiod for the non-slew times, and weighted by the total counts in the corresponding time period using addrmf. An average response file is needed becuase a spectral fit using the pre-slew DRM will introduce some errors in both a spectral shape and a normalization if the PHA file contains a lot of the slew/post-slew time interval.
- 3) For fits to more complicated models (e.g. a power-law over a cutoff power-law), the BAT team has decided to require a chi-square improvement of more than 6 for each extra dof.
Time averaged spectrum fit using the average DRM
Power-law model
Time interval is from  -25.540 sec. to   34.608 sec.

Spectral model in power-law:
------------------------------------------------------------
Parameters  : value       lower 90%   higher 90%
Photon index: -1.57751     ( -0.0954326   0.0945779 )
Norm@50keV  : 2.90584E-03    ( -0.000162333   0.00016157 )
------------------------------------------------------------
#Fit statistic : Chi-Squared =          73.83 using 59 PHA bins.
# Reduced chi-squared =          1.295 for     57 degrees of freedom
# Null hypothesis probability =   6.619858e-02

Photon flux (15-150 keV)    in 60.15 sec: 0.370872 ( -0.019893  0.01991 ) ph/cm2/s
Energy fluence (15-150 keV)             : 1.63948e-06 ( -9.94255e-08  1.00266e-07 ) ergs/cm2
Cutoff power-law model
Time interval is from  -25.540 sec. to   34.608 sec.
Spectral model in the cutoff power-law:
------------------------------------------------------------
Parameters  : value       lower 90%   higher 90%
Photon index: -0.940168     ( -0.402528   0.44592 )
Epeak [keV] : 78.6192      ( -15.5616 53.3341 )
Norm@50keV  : 6.26852E-03    ( -0.00236953   0.00438042 )
------------------------------------------------------------
#Fit statistic : Chi-Squared =          66.13 using 59 PHA bins.
# Reduced chi-squared =          1.181 for     56 degrees of freedom
# Null hypothesis probability =   1.667281e-01

Photon flux (15-150 keV)    in 60.15 sec: 0.358678 ( -0.021254  0.021246 ) ph/cm2/s
Energy fluence (15-150 keV)             : 1.5398e-06 ( -1.15982e-07  1.17093e-07 ) ergs/cm2
1-s peak spectrum fit
Power-law model
Time interval is from    9.292 sec. to   10.292 sec.

Spectral model in power-law:
------------------------------------------------------------
Parameters  : value       lower 90%   higher 90%
Photon index: -1.16674     ( -0.202274   0.206217 )
Norm@50keV  : 1.06700E-02    ( -0.00128525   0.00128524 )
------------------------------------------------------------
#Fit statistic : Chi-Squared =          79.37 using 59 PHA bins.
# Reduced chi-squared =          1.392 for     57 degrees of freedom
# Null hypothesis probability =   2.674567e-02

Photon flux (15-150 keV)    in 1 sec: 1.24690 ( -0.15327  0.15349 ) ph/cm2/s
Energy fluence (15-150 keV)             : 1.09308e-07 ( -1.46516e-08  1.47801e-08 ) ergs/cm2
Cutoff power-law model

Time interval is from    9.292 sec. to   10.292 sec.
Spectral model in the cutoff power-law:
------------------------------------------------------------
Parameters  : value       lower 90%   higher 90%
Photon index: -0.691566     ( -0.574968   0.947172 )
Epeak [keV] : 144.546      ( -65.5461 -144.546 )
Norm@50keV  : 1.82108E-02    ( -0.00834203   0.032882 )
------------------------------------------------------------
#Fit statistic : Chi-Squared =          78.34 using 59 PHA bins.
# Reduced chi-squared =          1.399 for     56 degrees of freedom
# Null hypothesis probability =   2.603401e-02

Photon flux (15-150 keV)    in 1 sec: 1.22648 ( -0.07913  0.15736 ) ph/cm2/s
Energy fluence (15-150 keV)             : 1.05833e-07 ( -1.61727e-08  1.59593e-08 ) ergs/cm2
Time-resolved spectra
Distribution
T90 vs. Hardness ratio plot
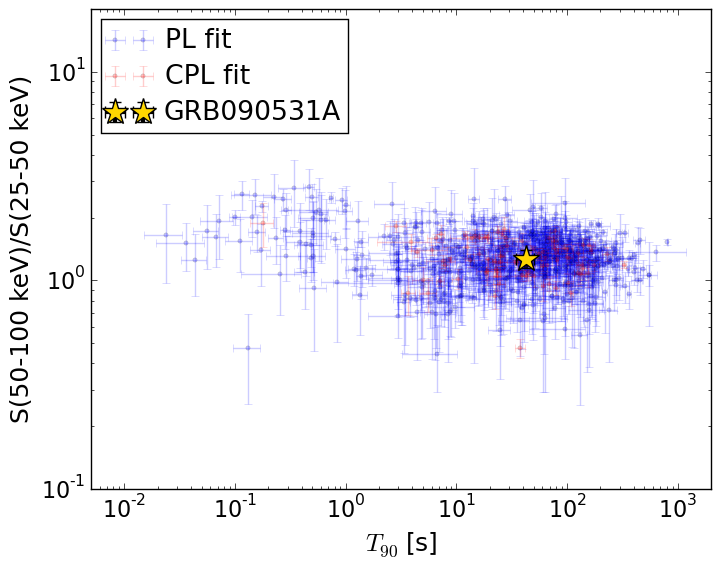
T90                                   = 42.8 sec.
Hardness ratio (energy fluence ratio) = 1.27394325526
S(15-50 keV) vs. S(50-150 keV) plot
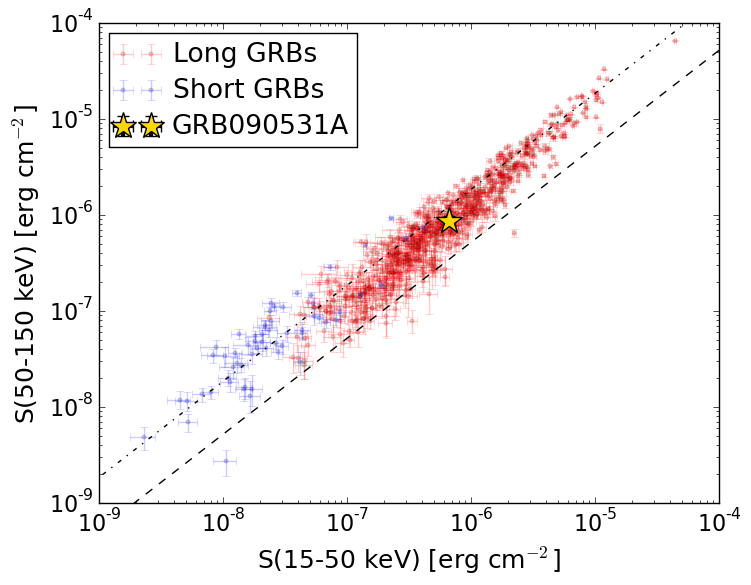
S(15-50 keV)  = 6.671289e-07
S(50-150 keV) = 8.726656e-07
The dash-dotted line and the dashed line traces the fluences calculated from the Band function with Epeak = 15 and 150 keV, respectively. Both lines assume a canonical values of alpha = -1 and beta = -2.5.
Mask shadow pattern
IMX = 7.932345979961761E-02, IMY = 3.651492954307809E-01
Spacecraft aspect plot
Bright source in the pre-burst/pre-slew/post-slew images
Pre-burst image of 15-350 keV band
Time interval of the image:
-438.075400 -367.136900
-239.176000 -25.540000

# RAcent  DECcent POSerr Theta    Phi  PeakCts   SNR AngSep     Name
#  [deg]    [deg]    ['] [deg]  [deg]                   [']
Pre-slew background subtracted image of 15-350 keV band
Time interval of the image:
-25.540000 34.608000

# RAcent  DECcent POSerr Theta    Phi  PeakCts   SNR AngSep     Name
#  [deg]    [deg]    ['] [deg]  [deg]                   [']
229.8625  24.1943    2.5  46.0   18.7   0.8680   4.6 ------	UNKNOWN
179.9547 -24.1314    2.2  22.8 -174.3   0.4349   5.3 ------	UNKNOWN
178.6643   7.8296    0.4  20.5  -77.7   2.6584  27.6 ------	UNKNOWN
204.3238  43.5653    2.5  50.2  -19.5   0.8953   4.5 ------	UNKNOWN
184.8079  39.4252    2.2  46.0  -39.1   1.0527   5.2 ------	UNKNOWN
Post-slew image of 15-350 keV band
Time interval of the image:
440.224610 602.831900

# RAcent  DECcent POSerr Theta    Phi  PeakCts   SNR AngSep     Name
#  [deg]    [deg]    ['] [deg]  [deg]                   [']
254.6279  35.2012    0.0  21.4   50.2  -0.1354  -0.2   11.9	Her X-1
299.7430  35.2421   12.7  49.3    5.4   1.3320   0.9    7.9	Cyg X-1
307.9732  40.9227  160.9  50.9   -5.6  -0.0993  -0.1    6.5	Cyg X-3
251.7387  18.0653    3.4  35.2   73.2   4.6232   3.4 ------	UNKNOWN
211.9597  13.4373    4.4  40.5  137.6   4.0443   2.6 ------	UNKNOWN
266.0345  26.1085    3.0  34.6   46.0   3.5964   3.9 ------	UNKNOWN
193.2026  31.8436    3.3  34.8  178.4   2.5491   3.5 ------	UNKNOWN
176.8505  33.7211    2.6  43.9 -165.0   4.5238   4.4 ------	UNKNOWN
313.2996  49.6912    4.2  48.9  -17.8   3.5170   2.8 ------	UNKNOWN
318.8006  62.0239    2.5  45.5  -34.5   5.8746   4.7 ------	UNKNOWN
176.7217  73.1484    3.1  33.3 -101.6   4.2039   3.7 ------	UNKNOWN
153.8836  54.3627    3.1  46.3 -127.9  10.4695   3.7 ------	UNKNOWN