Analysis Summary
Notes:
- 1) No attempt has been made to eliminate the non-significant decimal places.
- 2) This batgrbproduct analysis is done using the HEASARC data.
- 3) This batgrbproduct analysis is using the flight position for the mask-weighting calculation.
======================================================================
                  BAT GRB EVENT DATA PROCESSING REPORT
    Process Script Ver: batgrbproduct v2.46
    Process Start Time: Sun Jan 19 16:04:42 EST 2014
             Host Name: batevent1
   Current Working Dir: /local/data/batevent/batevent_reproc/trigger353728
======================================================================

  Trigger: 00353728      Segment: 000

  BAT Trigger Time: 265487760.96   [s; MET]
      Trigger Stop: 265487761.984   [s; MET]
               UTC: 2009-05-31T18:35:56.171780    [includes UTCF correction]
       Where From?: TDRSS position message

  BAT
    RA: 252.064493860549   Dec: -36.0245188355297  [deg; J2000]

     Catalogged Source?: NO
     Point Source?:      YES
     GRB Indicated?:     YES    [ by BAT flight software ]
     Image S/N Ratio:    11.06
     Image Trigger?:     NO
     Rate S/N Ratio:     48.4148737476408  [ if not an image trigger ]
     Image S/N Ratio:    11.06

  Analysis Position:   [ source = BAT ]
    RA: 252.064493860549   Dec: -36.0245188355297  [deg; J2000]

  Refined Position:   [ source = BAT pre-slew burst ]
    RA: 252.050663288647   Dec: -36.0371248300275  [deg; J2000]
        { 16h 48m 12.2s , -36d 02' 13.6" }
         +/- 1.63203383503178 [arcmin] (estimated 90% radius based on SNR)
         +/- 0.668135944031281 [arcmin] (formal 1-sigma fit error)
    SNR: 15.1084385497323

  Angular difference between the analysis and refined position is 1.011157 arcmin

  Partial Coding Fraction: 1.015625    [ including projection effects ]

  Duration
     T90: 54.9959999918938 +/- 6.13174035585667
        Measured from: 0.439999997615814
                   to: 55.4359999895096     [s; relative to TRIGTIME]
     T50: 39.6159999966621 +/- 13.3353342529601
        Measured from: 1.60400000214577
                   to: 41.2199999988079     [s; relative to TRIGTIME]


  Fluence
     Peak Flux  (peak 1 second)
        Measured from: 0.25
                   to: 1.25     [s; relative to TRIGTIME]
     Total Fluence
        Measured from: 0.252000004053116
                   to: 56.1319999992847     [s; relative to TRIGTIME]

             Band 1     Band 2     Band 3     Band 4
              15-25      25-50     50-100    100-350     keV
 Total     0.345998   0.326109   0.291201   0.099008
           0.041058   0.038554   0.032767   0.027373 [error]
 Peak      0.049357   0.071327   0.087462   0.033839
           0.006112   0.006192   0.006156   0.005358 [error]

     [ fluence units of on-axis counts / fully illuminated detector ]

======================================================================


====== Table of the duration information =============================

        Value   tstart    tstop
T100   55.880    0.252   56.132
T90    54.996    0.440   55.436
T50    39.616    1.604   41.220
Peak    1.000    0.250    1.250


====== Spectral Analysis Summary =====================================

Model      : spectral model: simple power-law (PL) and cutoff power-law (CPL)
Ph_index   : photon index: E^{Ph_index}
Ph_90err   : 90% error of the photon index
Epeak      : Epeak in keV
Epeak_90err: 90% error of Epeak
Norm       : normalization at 50 keV in both the PL model and CPL model
Nomr_90err : 90% error of the normalization
chi2       : Chi-Squared
dof        : degree of freedo

=== Time-averaged spectral analysis ===
(Best model with acceptable fit: PL)

Model Ph_index Ph_90err_low Ph_90err_hi  Epeak  Epeak_90err_low  Epeak_90err_hi  Norm       Nomr_90err_low    Norm_90err_hi    chi2    dof
PL      -1.516    -0.215      0.214       -           -               -         1.16e-03     -1.32e-04          1.31e-04      57.410   57
CPL     -1.528    -0.800      0.232     9999.360      N/A           N/A         1.15e-03        N/A               N/A         57.440   56


=== 1-s peak spectral analysis ===
(Best model with acceptable fit: PL)

Model Ph_index Ph_90err_low Ph_90err_hi  Epeak  Epeak_90err_low  Epeak_90err_hi  Norm       Nomr_90err_low    Norm_90err_hi    chi2    dof
PL      -0.948     -0.157     0.160       -           -               -         1.52e-02     -1.25e-03          1.24e-03      63.270   57
CPL     -0.879     -0.230     0.346      973.617    -973.617      -973.617      1.62e-02     -2.20e-03          5.27e-03      63.650   56


=== Fluence/Peak Flux Summary ===

              Model    Band1     Band2     Band3     Band4     Band5     Total
                       15-25     25-50    50-100    100-350    15-150    15-350    keV
Fluence         PL   8.40e-08  1.53e-07  2.14e-07  6.25e-07  6.13e-07  1.08e-06   erg/cm2
      90%_error_low -1.64e-08 -1.78e-08 -3.31e-08 -1.90e-07 -7.70e-08 -2.17e-07   erg/cm2
      90%_error_hi   1.73e-08  1.76e-08  3.27e-08  2.43e-07  7.80e-08  2.61e-07   erg/cm2
Peak flux       PL   3.69e-01  5.16e-01  5.36e-01  1.02e+00  1.74e+00  2.44e+00   ph/cm2/s
      90%_error_low -6.52e-02 -5.54e-02 -4.87e-02 -2.00e-01 -1.45e-01 -2.28e-01   ph/cm2/s
      90%_error_hi   6.99e-02  5.45e-02  4.82e-02  2.32e-01  1.45e-01  2.39e-01   ph/cm2/s

Fluence        CPL   8.40e-08  1.49e-07  2.10e-07  7.10e-07  6.19e-07  1.07e-06   erg/cm2
      90%_error_low -1.65e-08 -1.41e-08 -2.98e-08 -3.69e-07 -8.28e-08 -2.81e-07   erg/cm2
      90%_error_hi   1.73e-08  2.12e-08  3.60e-08  4.28e-08  7.23e-08  2.63e-07   erg/cm2
Peak flux      CPL   3.68e-01  5.17e-01  5.34e-01  1.09e+00  1.76e+00  2.44e+00   ph/cm2/s
      90%_error_low     N/A   -5.65e-02 -4.76e-02     N/A   -1.58e-01 -3.58e-01   ph/cm2/s
      90%_error_hi      N/A    2.73e-02  5.02e-02     N/A    1.32e-01  2.14e-01   ph/cm2/s

======================================================================
Image
Pre-slew 15.0-350.0 keV image (Event data)
#   RAcent    DECcent   POSerr    Theta     Phi              Peak Cts       SNR   Name
  252.0507   -36.0371   0.0128    12.5680    11.9314         1.1102854     15.108 TRIG_00353728

Foreground time interval of the image:
  0.252  56.132 (delta_t =  55.880 [sec])
Background time interval of the image:
-620.859 -588.914 (delta_t =  31.945 [sec])
-239.960   0.252 (delta_t = 240.212 [sec])
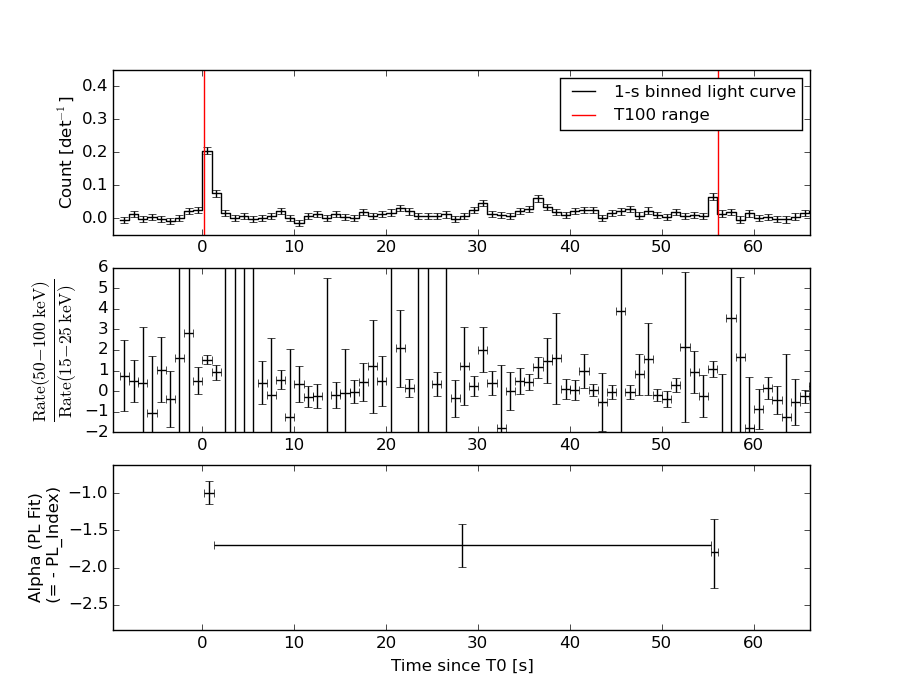
Light Curves
Note: The mask-weighted lightcurves have units of either count/det or counts/sec/det, where a det is 0.4 x 0.4 = 0.16 sq cm.
Full-time range; 1 s binning
Other quick-look light curves:
- 64 ms binning (zoomed)
- 16 ms binning (zoomed)
- 8 ms binning (zoomed)
- 2 ms binning (zoomed)
- SN=5 or 10 s binning (full-time range)
- Raw light curve
Spectra
- 64 ms binning (zoomed)
- 16 ms binning (zoomed)
- 8 ms binning (zoomed)
- 2 ms binning (zoomed)
- SN=5 or 10 s binning (full-time range)
- Raw light curve
Spectra
Notes:
- 1) The fitting includes the systematic errors.
- 2) When the burst includes telescope slew time periods, the fitting uses an average response file made from multiple 5-s response files through out the slew time plus single time preiod for the non-slew times, and weighted by the total counts in the corresponding time period using addrmf. An average response file is needed becuase a spectral fit using the pre-slew DRM will introduce some errors in both a spectral shape and a normalization if the PHA file contains a lot of the slew/post-slew time interval.
- 3) For fits to more complicated models (e.g. a power-law over a cutoff power-law), the BAT team has decided to require a chi-square improvement of more than 6 for each extra dof.
Time averaged spectrum fit using the average DRM
Power-law model
Time interval is from    0.252 sec. to   56.132 sec.

Spectral model in power-law:
------------------------------------------------------------
Parameters  : value       lower 90%   higher 90%
Photon index: -1.51636     ( -0.214969   0.213755 )
Norm@50keV  : 1.15968E-03    ( -0.000132126   0.000130726 )
------------------------------------------------------------
#Fit statistic : Chi-Squared =          57.41 using 59 PHA bins.
# Reduced chi-squared =          1.007 for     57 degrees of freedom
# Null hypothesis probability =   4.599344e-01

Photon flux (15-150 keV)    in 55.88 sec: 0.145424 ( -0.016303  0.016361 ) ph/cm2/s
Energy fluence (15-150 keV)             : 6.13222e-07 ( -7.70222e-08  7.80146e-08 ) ergs/cm2
Cutoff power-law model
Time interval is from    0.252 sec. to   56.132 sec.
Spectral model in the cutoff power-law:
------------------------------------------------------------
Parameters  : value       lower 90%   higher 90%
Photon index: -2.24222     ( -0.0863455   0.946285 )
Epeak [keV] : 88.2551      (   )
Norm@50keV  : 5.03494E-04    (     )
------------------------------------------------------------
#Fit statistic : Chi-Squared =          56.26 using 59 PHA bins.
# Reduced chi-squared =          1.005 for     56 degrees of freedom
# Null hypothesis probability =   4.651582e-01

Photon flux (15-150 keV)    in 55.88 sec: 0.145410 ( -0.016324  0.016348 ) ph/cm2/s
Energy fluence (15-150 keV)             : 6.18709e-07 ( -8.28058e-08  7.22568e-08 ) ergs/cm2
1-s peak spectrum fit
Power-law model
Time interval is from    0.250 sec. to    1.250 sec.

Spectral model in power-law:
------------------------------------------------------------
Parameters  : value       lower 90%   higher 90%
Photon index: -0.94778     ( -0.157323   0.160264 )
Norm@50keV  : 1.51740E-02    ( -0.00124851   0.00124428 )
------------------------------------------------------------
#Fit statistic : Chi-Squared =          63.27 using 59 PHA bins.
# Reduced chi-squared =          1.110 for     57 degrees of freedom
# Null hypothesis probability =   2.647724e-01

Photon flux (15-150 keV)    in 1 sec: 1.74321 ( -0.14456  0.14505 ) ph/cm2/s
Energy fluence (15-150 keV)             : 1.67244e-07 ( -1.53292e-08  1.54566e-08 ) ergs/cm2
Cutoff power-law model

Time interval is from    0.250 sec. to    1.250 sec.
Spectral model in the cutoff power-law:
------------------------------------------------------------
Parameters  : value       lower 90%   higher 90%
Photon index: -0.941505     ( -0.230062   0.346287 )
Epeak [keV] : 9999.34      ( -9999.36 -9999.36 )
Norm@50keV  : 1.52675E-02    ( -0.00123586   0.00622998 )
------------------------------------------------------------
#Fit statistic : Chi-Squared =          63.30 using 59 PHA bins.
# Reduced chi-squared =          1.130 for     56 degrees of freedom
# Null hypothesis probability =   2.344573e-01

Photon flux (15-150 keV)    in 1 sec: 1.75580 ( -0.15786  0.13173 ) ph/cm2/s
Energy fluence (15-150 keV)             : 1.67174e-07 ( -1.53432e-08  1.54593e-08 ) ergs/cm2
Time-resolved spectra
Distribution
T90 vs. Hardness ratio plot
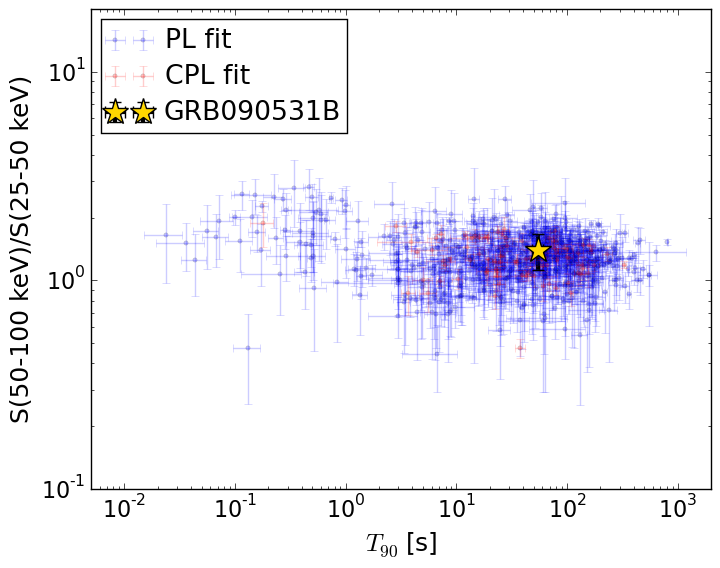
T90                                   = 54.996 sec.
Hardness ratio (energy fluence ratio) = 1.39829875367
S(15-50 keV) vs. S(50-150 keV) plot
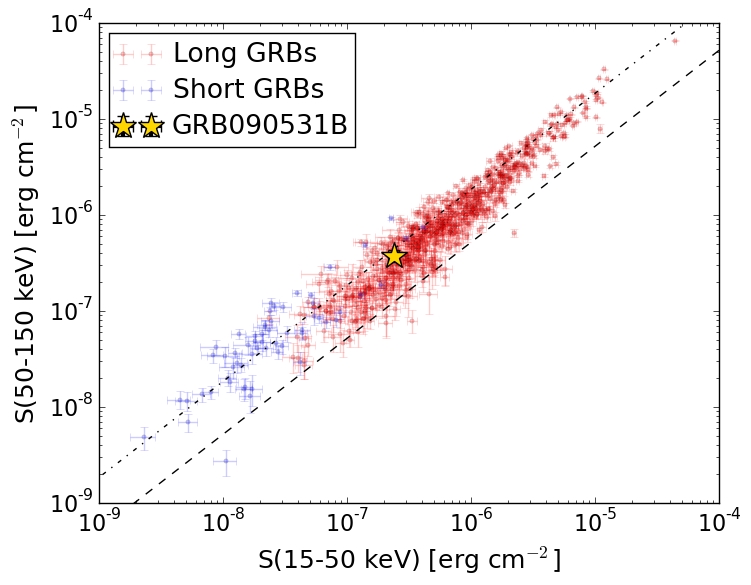
S(15-50 keV)  = 2.3689093e-07
S(50-150 keV) = 3.763261e-07
The dash-dotted line and the dashed line traces the fluences calculated from the Band function with Epeak = 15 and 150 keV, respectively. Both lines assume a canonical values of alpha = -1 and beta = -2.5.
Mask shadow pattern
IMX = 2.181239179977716E-01, IMY = -4.609093939030418E-02
Spacecraft aspect plot
Bright source in the pre-burst/pre-slew/post-slew images
Pre-burst image of 15-350 keV band
Time interval of the image:
-620.859400 -588.914100
-239.960000 0.252000

# RAcent  DECcent POSerr Theta    Phi  PeakCts   SNR AngSep     Name
#  [deg]    [deg]    ['] [deg]  [deg]                   [']
186.5126 -62.8308    5.5  57.2  -24.2  -2.7111  -2.1    5.4	GX 301-2
244.9810 -15.6459    0.4  25.7   68.6   9.1132  31.5    0.4	Sco X-1
256.1170 -37.9571    4.9  10.3   -3.2   0.4758   2.3    9.2	4U 1700-377
256.4445 -36.2562    4.1   9.3    5.0   0.5800   2.8   10.0	GX 349+2
263.0750 -24.7385    3.4   8.1  100.4   0.6786   3.4    3.6	GX 1+4
264.6794 -44.6523    0.0  12.5  -50.4   0.8069   3.9   12.4	4U 1735-44
268.4600  -1.5643    5.7  30.7  127.1   0.6494   2.0    8.7	SW J1753.5-0127
270.3489 -24.9037   10.6   8.1  148.7   0.2106   1.1   11.1	GX 5-1
270.0844 -25.6986   13.3   7.2  149.5   0.1738   0.9   12.1	GRS 1758-258
274.0591 -14.1202    2.2  19.4  145.9   1.1141   5.2    5.9	GX 17+2
275.9500 -30.3410    1.8   8.3 -157.5   1.3246   6.5    2.0	H1820-303
285.0799 -24.7402    9.0  17.9 -166.7  -0.2759  -1.3   11.1	HT1900.1-2455
288.7317  10.9861    2.9  48.2  153.2   3.2118   4.0    4.6	GRS 1915+105
263.0026 -33.8071    2.0   3.4    4.9   1.2292   5.6    1.8	GX 354-0
272.3470   5.1837    2.5  37.8  132.9   2.2301   4.7 ------	UNKNOWN
298.7033  -3.3383    2.7  41.8  176.3   1.4520   4.3 ------	UNKNOWN
266.5305 -32.2150    1.2   0.0   99.8   2.1004   9.8 ------	UNKNOWN
255.7339 -48.7818    2.4  18.4  -33.5   1.0238   4.9 ------	UNKNOWN
318.7937  -9.9223    3.8  53.0 -159.3   1.8913   3.0 ------	UNKNOWN
Pre-slew background subtracted image of 15-350 keV band
Time interval of the image:
0.252000 56.132000

# RAcent  DECcent POSerr Theta    Phi  PeakCts   SNR AngSep     Name
#  [deg]    [deg]    ['] [deg]  [deg]                   [']
186.7303 -62.6898    3.9  57.1  -24.1  -1.1342  -2.9    5.2	GX 301-2
245.0617 -15.4728    7.5  25.7   69.0  -0.1616  -1.5   11.1	Sco X-1
256.1125 -37.7552   11.2  10.2   -2.3  -0.0787  -1.0    8.0	4U 1700-377
256.4427 -36.4639    5.6   9.3    3.9   0.1612   2.1    2.5	GX 349+2
263.1013 -24.5991    9.4   8.2  101.0   0.0956   1.2   10.1	GX 1+4
264.6794 -44.6523    0.0  12.5  -50.4  -0.1309  -1.7   12.4	4U 1735-44
268.3268  -1.3117   51.2  31.0  126.9  -0.0288  -0.2    8.8	SW J1753.5-0127
270.4583 -25.0427    7.1   8.0  149.8   0.1293   1.6    9.7	GX 5-1
270.2567 -25.6778    6.5   7.3  150.6   0.1438   1.8    4.6	GRS 1758-258
273.9573 -13.9876    6.7  19.5  145.4  -0.1435  -1.7    4.1	GX 17+2
276.1381 -30.3587    5.0   8.4 -157.1  -0.1723  -2.3   11.0	H1820-303
285.0517 -24.7115    0.0  17.9 -166.8  -0.0926  -1.2   12.6	HT1900.1-2455
288.7593  11.0518    4.3  48.2  153.2  -0.7185  -2.7    6.8	GRS 1915+105
262.7950 -33.8584    4.9   3.5    5.4  -0.1924  -2.4    9.8	GX 354-0
297.4851  13.1479    2.4  54.2  161.5   2.3801   4.9 ------	UNKNOWN
252.0507 -36.0371    0.8  12.6   11.9   1.1104  15.2 ------	UNKNOWN
Post-slew image of 15-350 keV band
Time interval of the image:
167.340600 359.440600

# RAcent  DECcent POSerr Theta    Phi  PeakCts   SNR AngSep     Name
#  [deg]    [deg]    ['] [deg]  [deg]                   [']
255.9226 -37.6909   21.5  26.1   59.1   0.1060   0.5    9.7	4U 1700-377
256.3846 -36.2588    6.9  26.2   62.4   0.3266   1.7   10.2	GX 349+2
262.7880 -24.7429    0.0  27.7   90.7   0.3869   1.7   12.0	GX 1+4
264.8863 -44.3455    6.0  18.3   44.3  -0.2768  -1.9    8.8	4U 1735-44
270.2751 -25.2474  117.7  22.6  101.4  -0.0177  -0.1   10.1	GX 5-1
270.2057 -25.8517    6.7  22.2  100.3   0.3119   1.7    8.4	GRS 1758-258
273.9591 -13.9820    6.2  30.4  121.5   0.4468   1.9    4.2	GX 17+2
275.8730 -30.3687    1.2  15.5  102.5   1.3739   9.2    2.7	H1820-303
285.0938 -25.1172    0.0  16.5  138.1   0.1274   0.8   12.2	HT1900.1-2455
263.0273 -33.8412    3.3  22.2   73.2   0.6644   3.5    1.9	GX 354-0
266.5544 -32.2027    2.2  20.4   81.2   1.0210   5.3 ------	UNKNOWN
301.7597   0.7174    2.2  43.3  170.4   1.5141   5.3 ------	UNKNOWN
347.1660 -60.6274    3.0  39.5  -68.1   2.1671   3.7 ------	UNKNOWN